
In 2016, total investment levels in the European Union (EU) amounted to almost €3 000 bn. 49% concerned construction, with machinery, equipment and weapons systems (30%) and intellectual property products (20%) following. The latter category has shown the largest increase in proportion to total capital investment.
Overall, total investment in the EU was equivalent to 19.7% of GDP in 2016, compared with 21% in 1996. This represented a decrease by 1.3 percentage points (pp).
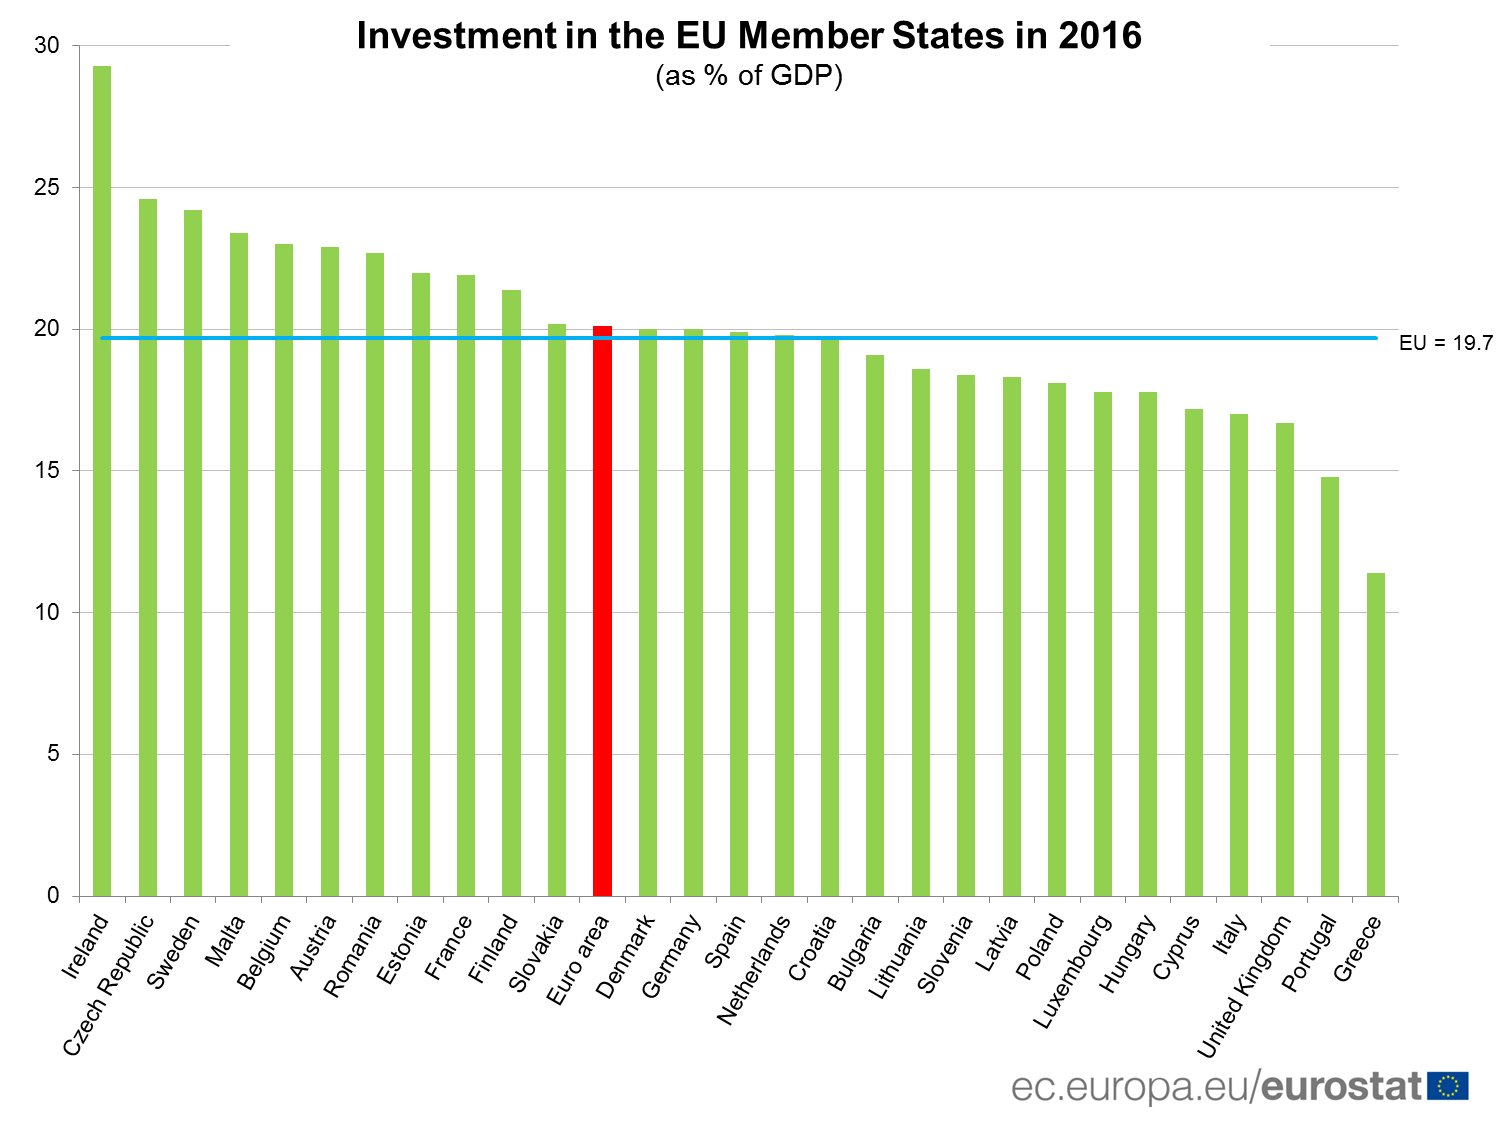
Ratio of investment to GDP highest in Ireland, lowest in Greece
Across the EU Member States, Ireland recorded in 2016 the largest ratio of investment to GDP (29.3%), ahead of the Czech Republic (24.6%), Sweden (24.2%), Malta (23.4%), Belgium (23.0%), Austria (22.9%) and Romania (22.7%). At the opposite end of the scale, the lowest share of investment was registered by Greece (11.4% of GDP), followed by Portugal (14.8%), the United Kingdom (16.7%), Italy (17.0%) and Cyprus (17.2%).
The source dataset can be found here.
Highest growth of investment to GDP in Bulgaria, largest fall in Slovakia
Between 1996 and 2016, the ratio of investment to GDP decreased in a majority of the EU Member States with the largest declines being observed in Slovakia (20.2% in 2016 vs.33.5% in 1996, or -13.3 pp), the Czech Republic and Greece (both -9.4 pp) as well as Portugal (-9.0 pp). Among the nine Member States which have seen the ratio rise between 1996 and 2016, the largest increases were recorded in Bulgaria (from 5.4% of GDP in 1996 to 19.1% in 2016, or +13.7 pp) and Ireland (+9.5 pp), followed by Sweden (+4.2 pp) and France (+2.1 pp).

The source dataset can be found here.