Tutorial:Rounding of numbers
Authors of statistical publications face the challenge of finding a good balance between accuracy and readability. In this perspective, reporting numbers to the last available digit is not reasonable because it makes grasping relevant information difficult and may give a false impression about the actual accuracy of data. For this reason, rounding both large numbers and long decimals makes publications better readable and avoids spurious accuracy.[1][2][3]
While the Common editorial guidelines for Eurostat publications[4] have already a paragraph about rounding of numbers, more comprehensive guidelines are needed as the Dissemination unit is increasingly confronted with requests on this matter from authors, contractors and practitioners in other statistical organisations.
The most appropriate rounding policy depends on the context of the publication and the statistical domain being treated, and it is therefore difficult to formulate universal rules. Nevertheless, this document aims at harmonising practices and providing simple recommendations for publications targeted to a general public of non-specialists.
General recommendations
The general recommendations apply to all communication elements of statistical publications (texts, tables, graphs and maps):
- Use only the number of digits which are necessary and make sense for the purpose of a clear communication.
- Rounding of numbers should take place at the latest phase of data processing and analysis.
- For target indicators always use the full precision of the indicator to assess whether the target has been met. The rounding should not change the situation of the countries towards the target (to achieve or exceed the target).
- Big numbers are difficult to grasp. It may be reasonable to round them and use the words millions, billions, etc.
- In case of doubt on the number of digits to be used, authors should consult the Dissemination unit.
- A disclaimer should be added, when applicable, at the beginning or end of the publication describing the rounding policy and the reasons for possible inconsistencies. For instance:
- Due to rounding, some totals may not correspond with the sum of the separate figures.
Specific recommendations
The specific recommendations are based on three increasing levels of approximation: while detailed figures from data sources (e.g. Eurobase) should not be changed when preparing graphs and maps (level 0), they should be partially rounded for compiling tables (level 1) and rounded even further when writing texts (level 2).
Summary
- Level 0: Graphs and maps should be built using unrounded figures from the original dataset(s).
- Examples: 12.34 % and 56.789 %, 1 234 and 56 789 persons
- Level 1: For tables with percentages, the general rule is to round to one decimal. For tables with absolute numbers, identify the smallest number, decide how many digits to keep for this number, and then round all other entries to those digits.
- Examples: 12.3 % and 56.8 %, 1 200 and 56 800 persons
- Level 2: In text two significant (non-zero) digits are in general sufficient.
- Examples: 12 % and 57 %, 1 200 and 57 000 persons
Details
The assessment whether a target has been met should be done on the bases of unrounded figures (and properly reflecting the accuracy of the data).
- Level 1: Numbers and percentages shown in tables should be the result of a first level of rounding (this recommendation concerns the text tables, not the detailed tables that appear in annexes).
- If the table presents relative quantities such as percentages and proportions, rounding to one decimal should be applied. However, when values are generally higher than 70 %, no decimal would be used. On the other hand, for some indicators, like monthly changes, keeping more than one decimal might be needed.
- Nevertheless, in the case of target indicators or thresholds, the rounding should not affect the position of countries towards the target/threshold (i.e. rounding should not lead to the conclusion that a country is above the threshold while using decimals shows that this country is under the threshold, or vice versa).
- When compiling a table with absolute numbers, identify the “shortest” number (in terms of number of digits) and decide which significant digits to keep (two are in general sufficient), then round all other entries to those digits. In this way the rounded total will be consistent with the sum of the rounded addends (except for small rounding differences).
- For exchange rates showing the decimals is however important.
- If several indicators are presented in the same table, try to keep the same number of significant digits at one side for all absolute figures, and at the other side for all relative quantities.
- Level 2: Numbers and percentages shown in text should present a further level of rounding compared to tables.
- In general it is not necessary to report detailed numbers and percentages in texts when presenting analysis (about tables, maps and/or graphs). If the reader could benefit from such detailed numbers and percentages, consider the inclusion of an additional table in the publication.
- When precision is not strictly needed, envisage grouping countries (or other statistical units) and describe their characteristics with wording such as “at least”, ”about”, “less than”, etc. In order to do so, do the regrouping by using unrounded numbers and then do the rounding. It may be necessary to reconsider the text after the rounding as close numbers may end up in the same rounded number.
- In the case of target indicators or thresholds, use the maximum precision to rank countries towards the target/threshold (above or under).
- When analysing absolute numbers, keeping the same number of significant digits for countries of different size may eventually result in keeping different significant positions. These inconsistencies are not of concern in texts as their primary function is the communication of concepts.
- When reporting totals, do not add up rounded addends, but add unrounded numbers or percentages and round the total.
- As a consequence of the general rule, the advice for relative quantities such as percentages and proportions is to report in text one decimal for percentages below 10 %, no decimals for figures above 20 %, and for percentages between 10 and 20 % the choice between one or no decimal depends on the precision of the indicator.
Recommendations illustrated with an example
Tables
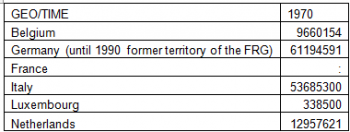
Consider the following population data extracted from Eurobase:
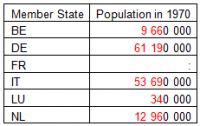
Luxembourg shows the smallest figure; keeping two significant digits implies rounding to the “ten-thousands” position, i.e. to 340 000. By rounding all other numbers to this position we obtain the table:
The unrounded total is 137 836 166 which, according to the rounding scheme applied in the table, rounds to 137 840 000. This is exactly the sum of the rounded figures in the table!
Even though the proposed rounding scheme reduces the possibility of inconsistencies between the sum of rounded numbers and the rounded sum, small differences could still occur. In this case, it is important to report the disclaimer described above (general recommendations number 6).
Texts
Consider the same population dataset as above. By keeping two significant digits, population in Germany rounds to 61 000 000, in Belgium to 9 700 000 and in Luxembourg to 340 000. The significant positions clearly differ in these three numbers; however this is generally not a problem in texts.
Further examples
Text describing a table: good example
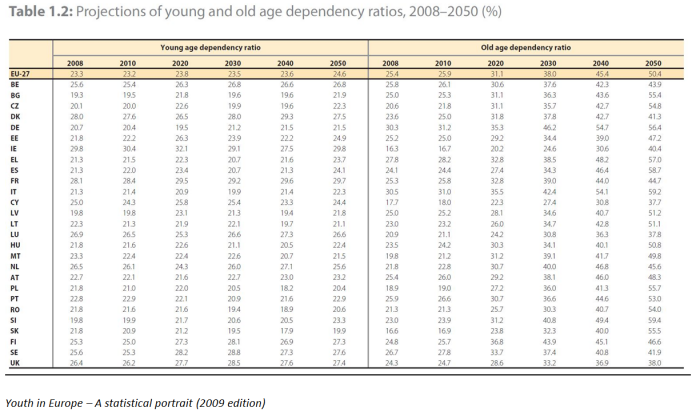
The following is a good example of how to present analysis of numbers reported in a table. In the accompanying text, countries are regrouped and rounded figures are used.
Example of numbers in text with too many digits
Consider the following example of text:
The total number of available hospitals beds in the EU-27 was 2.70 million in 2010, equivalent to one bed for every 185.8 persons or 538.2 hospitals beds per 100 000 inhabitants.
The figures in this text are too much detailed (up to four significant digits) and it is difficult for the reader to retain the main messages. Original numbers should be rounded to two digits only.
Solution
The total number of available hospital beds in the EU-27 was 2.7 million in 2010, equivalent to around one bed for every 190 persons, or 540 hospitals beds per 100 000 inhabitants.
Note that the rounding above must be done on the most detailed available figures for increased consistency.
Rounding of numbers in tables: bad example
Reconsider the population dataset introduced in the first table. If instead of applying the above mentioned recommendation for tables, we had kept the same number of significant digits in all figures in the table, we would not have achieved the same level of coherence. For instance, with two significance digits we have
The rounded total is 140 000 000 and this is different from the sum of the rounded figures (138 040 000).
Solution
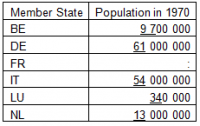
We have already seen that the correct scheme consists in rounding all figures to the “ten of thousand” position. Apart from the second table, the following two alternative tables correctly represent the data:
Practice in Eurobase
As background information, this section describes the current practices for tables and datasets in Eurobase (the database of Eurostat).
Main tables
- For tables derived directly from the source dataset (no calculation): the rounding of the source dataset is kept.
- Examples:
- 1) tec00046 Direct investment flows as % of GDP : the rounding is the same of that of the selected series from bop_fdi_main; no intervention from the unit reponsible of Eurobase.
- 2) ten00065 Environmental tax revenues - % of GDP : data from dataset env_ac_tax; no calculation performed, no rounding from the unit reponsible of Eurobase.
- For tables deriving data from more than one dataset (calculation): the rounding is done by the unit reponsible of Eurobase, in order to avoid different and high number of decimals which may be the consequence of the calculation. The number of decimals can vary according to the type of number and to the request of the Domain Manager (in the production unit).
- Examples:
- 1) t2020_rd210 Water productivity: data are the division of selected series from datasets nama_gdp_k and env_wat_abs; the number of decimals is 1.
- 2) t2020_rk210 Final energy consumption in households by fuel: division from nrg_102a and nrg_100a; the number of decimals is 1.
- For tables where a policy target is reported: in this case an additional column is added for the target which is derived from a dataset different from the source one. However, if no calculation is performed, the rounding is kept as the one of the source dataset.
- Example: t2020_10 Employment rate by sex, age group 20-64
Datasets
There is no intervention from the unit reponsible of Eurobase in the number of decimals of data sent by the production unit.
The only exception is the one of derived datasets, which are multidimensional tables (datasets) but derived from other datasets. In this case, the situation is the same of that of the main tables, that is the number of decimals is set by the unit reponsible of Eurobase, only if the unit reponsible of Eurobase performs a calculation.
Example of derived dataset with rounding: yth_demo_010 - Child and youth population on 1 January by sex and age. The dataset adds different data series from demo_pjangroup and the number of decimals is zero.
Derived datasets with calculation are really exception in Eurobase.
There are cases in the database where the same indicator has different number of decimals within the same dataset, and then the unit reponsible of Eurobase always asks the Domain Manager to try to avoid this situation.
See also
- Tutorials - overview of all tutorials
Notes
- ↑ UNECE; Making Data Meaningful. Part 1: A guide to writing stories about numbers
- ↑ UNECE; Making Data Meaningful. Part 2. A guide to presenting statistics
- ↑ UN Statistical Division and Statistics New Zealand; Policy on rounding of numbers
- ↑ Eurostat; Common editorial guidelines for Eurostat publications


