International trade in goods and services by end use
Data extracted in May 2023
Planned article update: June 2024
Highlights
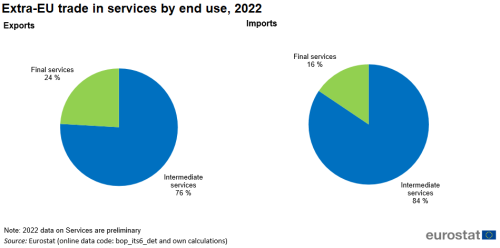
In 2022, intermediate services made up 76% of total services extra-EU exports and 84% of total services extra-EU imports.
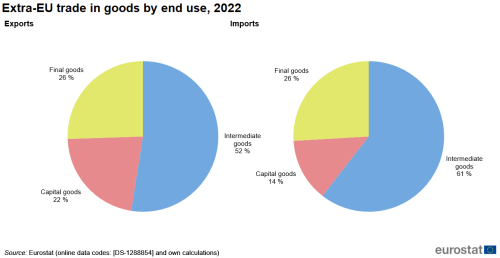
In 2022, intermediate goods made up 52% of total goods extra-EU exports and 61% of total goods extra-EU imports.
International trade can be analysed from new perspectives thanks to the latest revision of the classification of Broad Economic Categories (BEC). The main analytical use of the BEC classification is that it offers insight into the end-use of goods and services which can be final use (consumption) or inputs to other economic activities (intermediate use). Goods can also be used for fixed capital formation.
Intermediate goods and services are particularly relevant for the analysis of global value chains (GVCs). GVCs comprise the full range of activities that are required to bring a product from its conception, through its design, its sourced raw materials and intermediate inputs, its marketing, its distribution and its support to the final consumer. Cars are a typical example: producers source materials from different widespread geographical locations to assemble them in a central location, a process made possible by low transport and labour costs and improved means of communication.
As observed during the Covid-19 pandemic, disruptions in trade in intermediate goods and services pose serious problems for global value chains, where the cessation of production of some intermediate goods in one location has led to the cessation of production of goods in other locations, demonstrating the fragility of global value chains. In the following years the markets have quickly recovered, for services that happened with a faster pace.
This article is a first step in the analysis of EU exports and imports of goods and services by end-use. The data are still in an experimental phase, partly based on estimates, as explained in the "Methodology" section.
Full article
Main conclusions
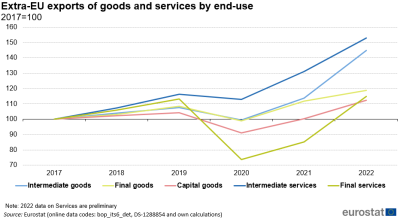
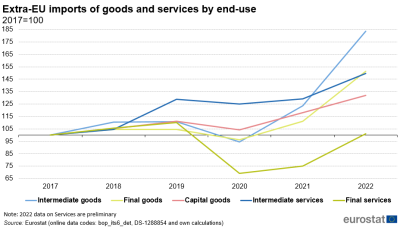
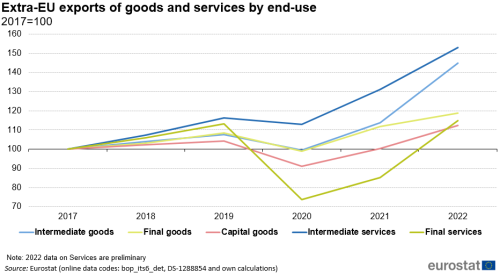
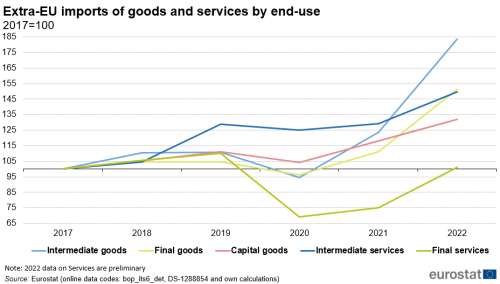
- Extra-EU imports of final services suffered the most from the COVID-19 pandemic in 2020; despite significant growth in 2022 they were still lacking behind and had not reach the pre-pandemic levels (in 2022 they were about 2017 levels and 8% lower compared to 2019). Exports of intermediate goods and services as well as final goods exceeded their pre-pandemic levels already in 2021 and kept on growing in 2022. The exports of capital goods recovered only in 2022.
- Similarly to the imports, extra-EU exports of final services also dropped the most in 2020 (35% compared to 2019 levels). In 2022 they have reached the pre-crisis levels. Imports of intermediate services continued to decline in 2020, reaching the pre-pandemic level in 2021 and in 2022 marked 16% increase. In contrast, imports of goods started growing significantly in 2021 and kept the trend in 2022, especially goods for intermediate use, driven by the strong increase in prices for the energy sector.
- In 2022, intermediate services made up 76 % of total services exports and 84 % of total services imports. In the same year, intermediate goods made up 52 % of total goods exports and 61 % of total goods imports.
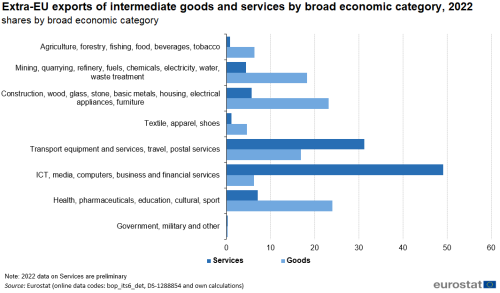
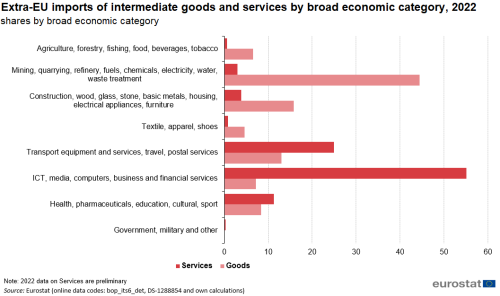
- In 2022, intermediate services were most prevalent in the category ‘ICT, media, computers, business and financial services’ both for extra-EU exports and imports.
- In 2022, intermediate goods in extra-EU exports were most prevalent in the category 'Health, pharmaceuticals, education, cultural, sport', while for imports they had the largest share in ‘Mining, quarrying, refinery, fuels, chemicals, electricity, water, waste treatment'.
International trade by end-use
Between 2017 and 2019, EU exports of goods and services increased for intermediate and final goods and services as well as for capital goods (Figure 1). The Covid-19 pandemic caused a decline for all of them. The largest decrease was for final services, while intermediate services decreased much less. Final services recorded the sharpest decline in 2020 (26 p.p. below the 2017 levels for exports and 31 p.p. for imports). This dramatic drop could be mostly attributed to the Covid-19 related sanitary and health restrictions especially in early to mid-2020. Final services are mostly driven by the travel item (expenditure of foreign tourists and travelers). Since there were practically no travels for the biggest part of 2020, or only very limited, the result is visible in the values of final services for 2020. The decreases for goods fell between these two extremes. In 2022, all categories of goods and services reached their highest levels since 2017. Most notably for intermediate goods and services.
Source: Eurostat (online data codes: bop_its6_det, DS-1288854 and own calculations)
Like exports, total extra-EU imports of goods and services fell in 2020 compared to 2019 levels, with the largest fall again in final services (figure 2). The imports of intermediate services started recovering in 2021 and continued growing during the next year. Extra-EU imports of capital goods decreased in 2020, while in extra-EU exports dropped most and reached 2017 levels in 2021. In 2022, imports in all categories of goods and services reached their highest levels since 2017 with the exception of final services which peaked in 2019. The increase was highest for intermediate goods due to sharply increasing energy prices.
Source: Eurostat (online data codes: bop_its6_det, DS-1288854 and own calculations)
Figures 3 and 4 provide further insight by presenting goods and services trade broken down by end-use (intermediate consumption, final consumption and capital goods).
In 2022, intermediates services are predominant: 76 % of the exported and 84 % of the imported services were intermediate services (that means that about two to three times as many intermediate services are traded as final services).
In goods, 52 % of the exported and 61 % of the imported goods are intermediate goods. By comparison, capital goods account for 22 % of exports and 14 % of imports, while final goods account for 26 % both for exports and imports.
Source: Eurostat (online data codes: bop_its6_det and own calculations)
Source: Eurostat (online data codes: DS-1288854 and own calculations)
International trade in intermediate goods and services by broad economic category
Figures 5 and 6 show the distribution of extra-EU trade of intermediate goods and services by broad economic categories in 2022. In 2022, the most exported and imported intermediate services to/from the EU were 'ICT, media, computers, business and financial services' (49 % for exports and 55 % for imports), followed by 'Transport equipment and services, travel, postal services' (31 % for exports and 25 % for imports), and 'Health, pharmaceuticals, education, cultural, sport services' (7 % for exports and 11 % for imports).
In exports of intermediate goods, the largest category was 'Health, pharmaceuticals, education, cultural, sport' (24 %), closely followed by 'Construction, wood, glass, stone, basic metals, housing, electrical appliances, furniture' (23 %) and 'Mining, quarrying, refinery, fuels, chemicals, electricity, water, waste treatment' (18 %).
The leading category for imports of intermediate goods was 'Mining, quarrying, refinery, fuels, chemicals, electricity, water, waste treatment' (44 %), followed by 'Construction, wood, glass, stone, basic metals, housing, electrical appliances, furniture' (16 %).
Source: Eurostat (online data codes: bop_its6_det, DS-1288854 and own calculations)
Source: Eurostat (online data codes: bop_its6_det, DS-1288854 and own calculations)
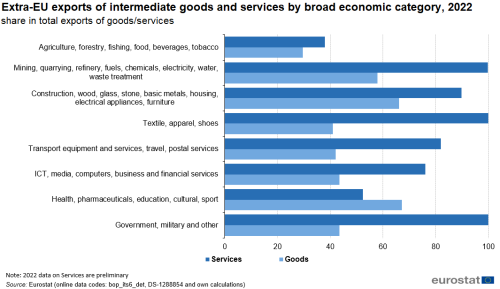
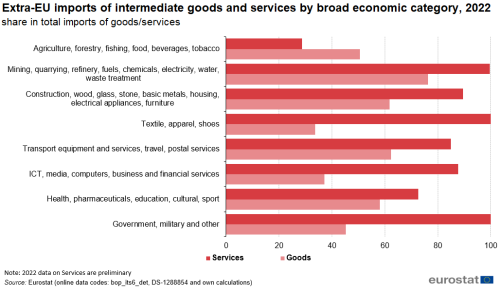
Figures 7 and 8 present EU intermediate goods and services trade broken down by broad economic categories in comparison with the total exported/imported goods and services in 2022.
In 2022, the largest shares of intermediate services in total services were found in the categories: 'Textile, apparel, shoes', 'Mining, quarrying, refinery, fuels, chemicals, electricity, water, waste treatment' and 'Government, military and other' (both for exports and imports). For goods, the largest shares of intermediate goods in total goods were in the categories: 'Health, pharmaceuticals, education, cultural, sport' and 'Construction, wood, glass, stone, basic metals, housing, electrical appliances, furniture' (for exports) and in 'Mining, quarrying, refinery, fuels, chemicals, electricity, water, waste treatment' and 'Transport equipment and services, travel, postal services' (for imports).
Source: Eurostat (online data codes: bop_its6_det, DS-1288854 and own calculations)
Source: Eurostat (online data codes: bop_its6_det, DS-1288854 and own calculations)
International trade in intermediate goods and services by Member State
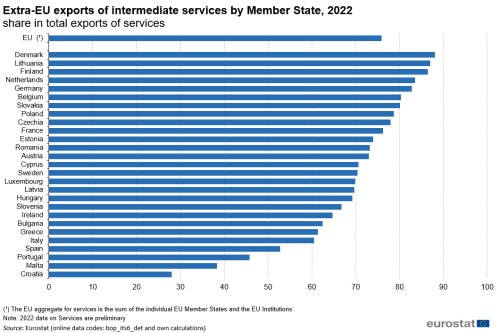
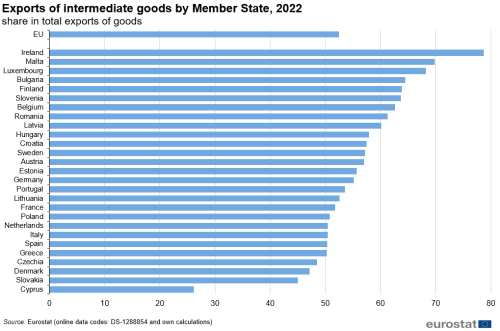
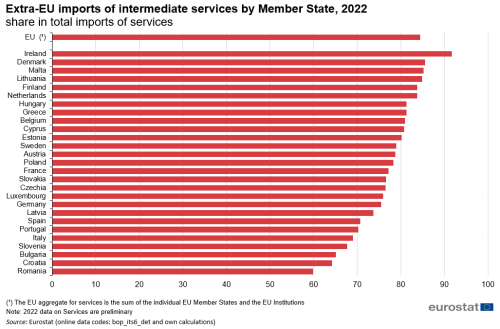
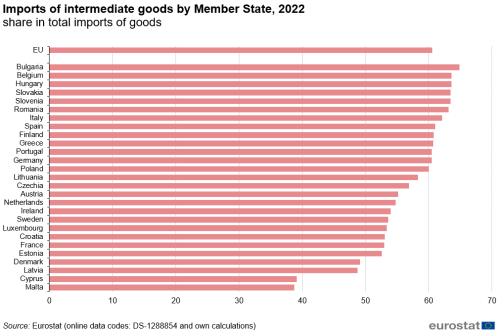
Figures 9 to 12 show the relative shares of intermediate goods and services in exports and imports of each EU Member State in 2022. The results for trade in services should be viewed with some caution, however, as Eurostat estimated the split of some EBOPS items to their constituents for some Member States.
The shares for intermediates in exports of services were highest in Denmark (88 %) and Lithuania (87 %) and below 50 % in Portugal (46 %), Malta (38 %) and Croatia (28 %), see Figure 9.
Source: Eurostat (online data codes: bop_its6_det and own calculations)
The shares for intermediates in exports of goods were highest in Ireland (79 %) and Malta (70 %) and lowest in Slovakia (45 %) and Cyprus (26 %).
Source: Eurostat (online data codes: DS-1288854 and own calculations)
Figure 11 shows that the EU Member States predominantly import intermediate services. For Ireland, Denmark, Malta, Lithuania, Finland and the Netherlands more than 83 % of imported services are intermediate services.
Source: Eurostat (online data codes: bop_its6_det and own calculations)
Figure 12 shows that Bulgaria, Belgium, Hungary, Slovakia, Slovenia and Romania had the highest shares for intermediate goods (more than 63 %), while Malta and Cyprus were the only Member States with shares below 40 % for intermediate goods.
Source: Eurostat (online data codes: DS-1288854 and own calculations)
Source data for tables and graphs
Data sources
Eurostat disseminates statistics on international trade in two related but different systems of statistics. These two systems are balance of payments statistics (BoP) (for ITSS) and international trade in goods statistics (ITGS). The methodological and conceptual differences in the principles underlying BoP and ITGS are explained in "Differences between balance of payments and foreign trade statistics".
Balance of payments statistics (BOP) cover an economy’s transactions with the rest of the world. The methodological standard for the compilation of BOP statistics is the IMF’s 6th edition of the Balance of Payments and International Investment Position Manual (BPM6). The implementation of this in Eurostat statistics is explained in the Manual on Statistics of International Trade in Services.
The source data for international trade in services statistics used in this article, is bop_its6_det enhanced with Eurostat’s own calculations.
Compilation of ITGS is based on European business statistics compilers' manual for international trade in goods statistics — detailed data — 2022 edition. To the most possible extent, European concepts and definitions have been aligned to international recommendations and conventions described in the United Nations Statistics Division publication International Merchandise Trade Statistics: Concepts and Definitions (IMTS 2010).
The source data for international trade in goods statistics used in this article, is DS-1288854 enhanced with Eurostat’s own calculations.
Methodological notes for trade in goods statistics
The conversion from HS-2017 to BEC Rev.5 codes was made using the correspondence table published on Eurostat’s classification server which contains the relation between HS-codes and BEC Rev.5 codes.
For the large majority of products, a specific HS code corresponds to an end-use category. For the remaining products, a dual use category was identified. A typical example is the products related to the energy, which can be used as intermediate, if used by enterprises, or as final consumption, if used by households. At total level the dual use codes made up around 25 % of the total trade in the period 2017-2021.
The shares of dual use products in each category are the following: about 30-40% for mineral fuel and mineral oil, 90% for pharmaceutical products, 60% for vehicles, 20% of the machinery and mechanical appliances, 7% of other categories.
Dual use code were allocated 50-50 to their two constituent parts.
Methodological notes for trade in services statistics
1. Input
The conversion from EBOPS 2010 items to BEC Rev.5 categories was made using the fine-tuned correlation table, published on RAMON Eurostat classifications server with the modelled allocation shares. This table is based on a correspondence table between the Classification by Broad Economic Categories revision 5 (BEC Rev. 5), the Central Product Classification, version 2.1 (CPC 2.1) and the Extended Balance of Payments Services Classification, version 2010 (EBOPS 2010), published by the UNSD. The fine-tuned table builds upon the EBOPS-CPC-BEC conversion table and provides modelled allocation shares of the EBOPS items to the relevant BEC Rev.5 categories (the estimations are evidence based and applicable for the EU).
More specifically, in cases where a single EBOPS item corresponds to more than one BEC code, Eurostat used additional information and modelling techniques to split the EBOPS code among the respective BEC categories.
Eurostat estimated a mapping of such items, based on available data from Services trade by enterprise characteristics (STEC) statistics, SBS, National Accounts and modelling using the count-seed RAS methodology[1].
In some cases, an allocation could not be derived, as the available data only contain information at a more aggregated level. These cases were:
- Operating leasing services SJ33,
- trade related services SJ34,
- other direct insurance services SF13, and
- explicitly charged financial services SG1.
For these items, an estimated proportional allocation was used; however, in most cases this does not affect the Intermediate vs. Final consumption allocation (as all the associated BEC categories have the same use).
2. Estimations
Some of the detailed EBOPS items required in the EBOPS to BEC conversion table are confidential / non-publishable (especially for individual countries) or simply non-available (e.g. voluntary items). Eurostat estimated all missing voluntary items in the country data sets by calculating imputation-shares based on the reported values. The reported voluntary items from few countries were used to define the shares for the countries not reporting these voluntary items.
For the Travel item (SD), the split by type of product was estimated for all countries using the shares provided in the correlation table, except for those countries that already report these sub-items to Eurostat (Czechia, Ireland, Croatia, Slovenia and Sweden).
The EBOPS to BEC conversion requires that the goods value contained in Travel is removed from BEC services (in fact, it should be correlated to BEC categories for goods). For this article, it was assumed that the goods amount present in Travel is about 25 % of the Travel item (estimate based on modelling and data reported by some countries). For this reason, the BEC services total is always lower than the reported total services by EBOPS 2010.
The split of the item charges for the use of intellectual property (SH) into its sub-items was estimated (entirely or partly) for all countries except Bulgaria, Cyprus, Czechia, Finland, Croatia, Ireland, Lithuania, Poland, Portugal and Romania (both for exports and imports).
The estimations of all missing items for 2022 were calculated on the bases of the shares from 2021 data.
Context
Globalisation has created new opportunities and competitive challenges, forcing producers to seek more efficient ways to create their products. It has become increasingly common to divide the traditional vertically integrated production model into stages or tasks (fragmentation), allowing part of the production process to be outsourced to another country or economy.
Lower trade barriers, organisational innovations and progress in information and communication technologies have made slicing up the production process cheaper and easier. Coordination costs have fallen, and different stages of production are now often located in two or more countries. High labour costs and heavy regulations in more developed countries have also helped to accelerate the shift through a wave of outsourcing and offshoring to developing countries [2].
Therefore, instead of intermediate and final production taking place all within one exporting country, exports are more likely to embody intermediate goods and services sourced from any number of countries. Thus, the value and characteristics of exports do not reflect only the production and technological capabilities of the exporter (as the product is not made in a single country but in several countries).
To stay competitive, enterprises increasingly organise their production globally, breaking up their value chains into smaller parts supplied by a growing number of providers located worldwide into so-called global value chains (GVCs). The resultant GVCs comprise the full range of activities required to bring a product or service from conception through the different phases of production, delivery to final consumers and final disposal after use. The rise of GVCs has made the analytical distinction between trade in intermediate goods/services and trade in final goods/services more important. In this respect, it is important to note that all trade in intermediate services is (by its own nature) GVC trade: both trading enterprises (i.e. the exporter/supplier and the importer/customer) are part of a GVC.
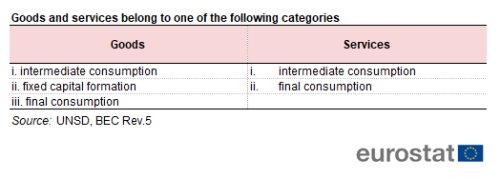
For international trade in goods a classification distinguishing intermediate, final consumption and capital goods already existed. The new BEC Rev. 5 classification improves on this classification and for the first time extends the classification to include also services. This allows the distinction in intermediate services and final consumption services. Table 1 shows the end-use categories of goods and services in BEC Rev. 5.
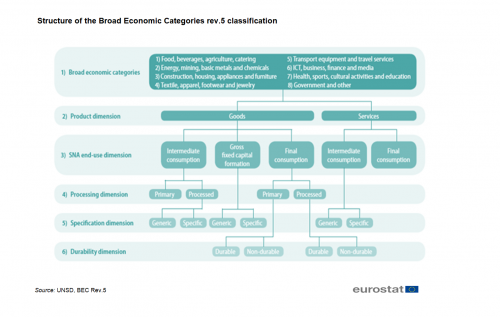
Figure 13 gives an overview of the structure of BEC Rev.5.
Direct access to
See also
Dedicated section
Notes
- ↑ Mattia Cai & José Manuel Rueda-Cantuche (2019) Bridging macroeconomic data between statistical classifications: the count-seed RAS approach, Economic Systems Research, 31:3, 382-403, DOI: 10.1080/09535314.2018.1540404. Accessed here: JRC Publications Repository: Browsing JRC Publications Repository (europa.eu)
- ↑ Source: UNECE Guide to measuring global production
