Tutorials
Log in
Statistics Explained
menu
search
search
Navigation
Main page
Statistical themes
Glossary
Categories
Statistics 4 beginners
Tutorials
Help
Eurostat home
Education corner
Online publications
Regional yearbook
Sustainable development
Full list
Tools
User contributions
Logs
View user groups
Special pages
search
Navigation
Main page
Statistical themes
Glossary
Categories
Statistics 4 beginners
Tutorials
Help
Eurostat home
Education corner
Online publications
Regional yearbook
Sustainable development
Full list
Tools
User contributions
Logs
View user groups
Special pages
Navigation
Main page
Statistical themes
Glossary
Categories
Statistics 4 beginners
Tutorials
Help
Eurostat home
Education corner
Online publications
Regional yearbook
Sustainable development
Full list
Tools
User contributions
Logs
View user groups
Special pages
Uploads by Debusmc
This special page shows all uploaded files.
File list
Items per page:
20
50
100
250
500
Search for media name:
Username:
Include old versions of files
Go
First page
Previous page
Next page
Last page
Date
Name
Thumbnail
Size
Description
Versions
15:46, 23 October 2014
Redirect to content page.png
(
file
)
5 KB
1
15:00, 25 July 2014
Baltic Sea region coastal-non-coastal urban-rural.png
(
file
)
158 KB
1
14:10, 12 June 2014
Sighting pane.png
(
file
)
17 KB
1
14:59, 16 May 2014
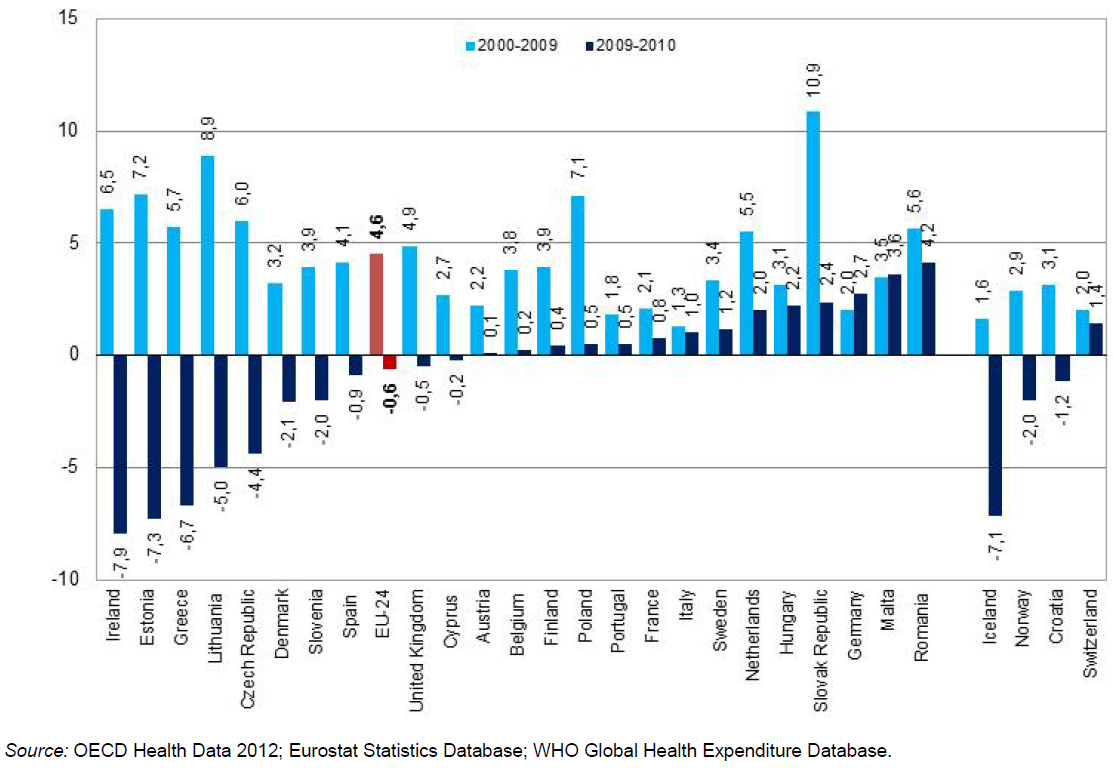
Annual average growth rate in per capita health expenditure, per capita, in real terms, 2000 to 2010 (or nearest year).png
(
file
)
272 KB
1
15:38, 14 March 2014
MEETS project overview, key results and follow-up.docx
(
file
)
60 KB
1
17:01, 31 January 2014
Transect information collected by LUCAS detailed.png
(
file
)
459 KB
1
10:25, 24 January 2014
Test.docx
(
file
)
58 KB
1
15:07, 13 November 2013
Wikitext insertion buttons.png
(
file
)
9 KB
1
14:59, 13 November 2013
Wikitext text processing buttons.png
(
file
)
8 KB
1
14:38, 13 November 2013
Wikitext editing buttons.png
(
file
)
17 KB
1
13:44, 31 October 2013
National Europe 2020 indicators - most recent data and targets.png
(
file
)
70 KB
1
10:25, 4 June 2013
One-to-five-year survival rates of enterprises, 2010, business economy, (%).png
(
file
)
11 KB
1
11:35, 28 May 2013
JIRA entry page.png
(
file
)
9 KB
1
14:09, 17 May 2013
Impact of the update on the gross value added distribution by urban-rural typology.png
(
file
)
12 KB
1
12:28, 17 May 2013
Impact of the update on population distribution by urban-rural typology, % of total population, 2011.png
(
file
)
9 KB
1
12:19, 17 May 2013
Impacts of the update on area distribution by urban-rural typology.png
(
file
)
11 KB
1
17:49, 15 May 2013
NUTS-3 regions without boundary changes between NUTS 2006 and NUTS 2010 by urban-rural typology.png
(
file
)
28 KB
1
17:44, 15 May 2013
NUTS 3 regions in southern Finland and Estonia by urban-rural typology using the 2001 population grid and NUTS 2006 (left) and the 2006 population grid and NUTS 2010 (right) .png
(
file
)
401 KB
1
17:38, 15 May 2013
NUTS-3 regions with boundary changes between NUTS 2006 and NUTS 2010 by urban-rural typology.png
(
file
)
11 KB
1
17:24, 15 May 2013
EU NUTS-3 regions - area, population and gross value added by updated urban-rural typology.png
(
file
)
34 KB
1
17:18, 15 May 2013
Distribution of NUTS-3 regions by the update urban-rural typology.png
(
file
)
19 KB
1
17:06, 15 May 2013
Previous urban-rural typology for NUTS3 regions, using 2001 population grid and according to NUTS 2006.png
(
file
)
696 KB
1
18:11, 4 April 2013
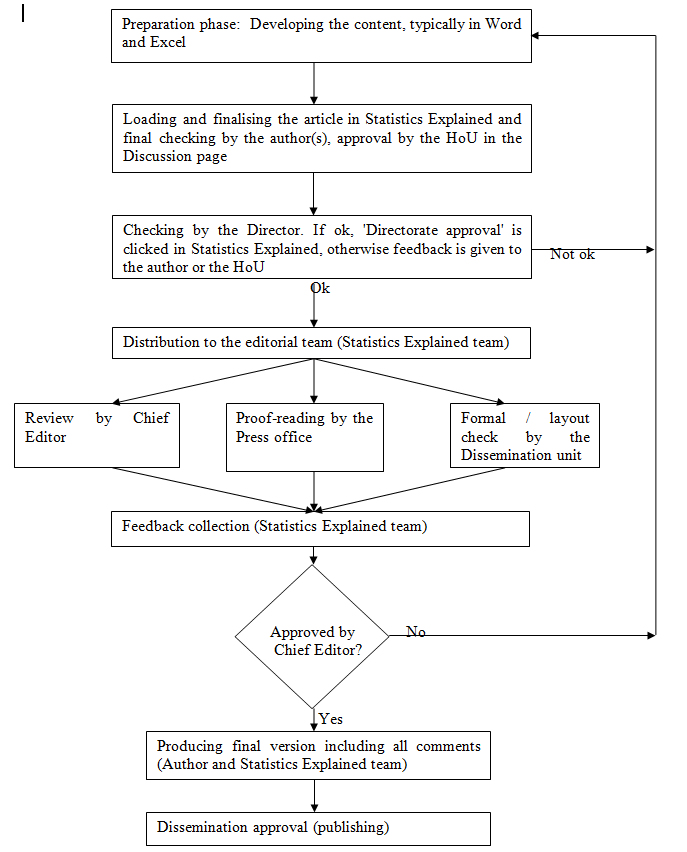
Workflow Statistics in focus.png
(
file
)
40 KB
1
12:04, 12 February 2013
Structure of active enterprises by sector, business economy, 2009.png
(
file
)
96 KB
1
11:58, 12 February 2013
Structure of active enterprises by sector, business economy, 2009 (%).png
(
file
)
96 KB
1
15:44, 30 January 2013
Select boilerplate.png
(
file
)
2 KB
1
17:31, 23 January 2013
Boilerplate screenshot.png
(
file
)
21 KB
1
16:14, 30 November 2012
Circle exclamation icon.png
(
file
)
22 KB
1
12:02, 28 November 2012
Structure of employment by sector, business economy, 2009, (%).png
(
file
)
24 KB
1
09:24, 9 August 2012
Access to finance other interesting figures.xls
(
file
)
66 KB
1
18:22, 30 January 2012
Five main imported and exported products, 2010, by country (continued)-ru.PNG
(
file
)
157 KB
1
18:13, 30 January 2012
Five main imported and exported products, 2010, by country-ru.PNG
(
file
)
260 KB
1
17:34, 30 January 2012
EU-27 exports to the CIS, 2010 share by type of goods ( %)-ru.png
(
file
)
59 KB
1
17:29, 30 January 2012
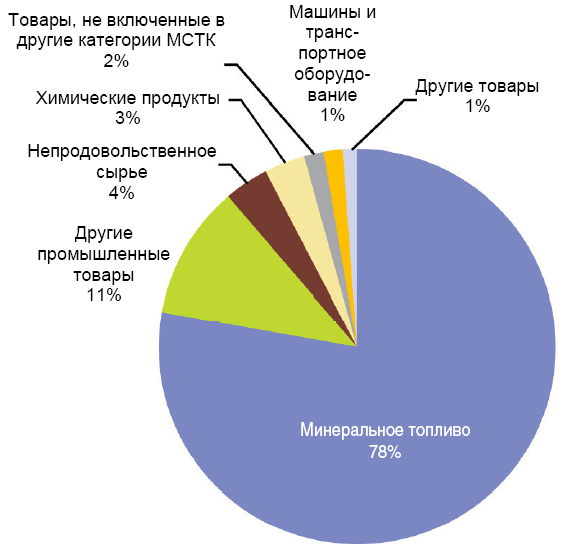
EU-27 imports from the CIS, 2010, share by type of goods ( %)-ru.png
(
file
)
63 KB
1
17:24, 30 January 2012
EU-27 exports to CIS, 2010 share by country (%)-ru.png
(
file
)
74 KB
1
17:20, 30 January 2012
EU-27 imports from CIS in 2010, share by country (%)-ru.png
(
file
)
69 KB
1
17:17, 30 January 2012
EU-27 trade with the individual CIS countries in 2010 (EUR million)-ru.png
(
file
)
52 KB
1
17:10, 30 January 2012
EU-27 exports to selected CIS countries - development 2000–2010-ru.png
(
file
)
111 KB
1
17:04, 30 January 2012
EU-27 imports from selected CIS countries - development 2000-2010-ru.png
(
file
)
156 KB
1
16:55, 30 January 2012
EU-27 trade with the CIS countries (EUR million)-ru.png
(
file
)
36 KB
1
15:29, 30 January 2012
EU-27 trade in goods with the CIS 2000-2010 (EUR million)-ru.PNG
(
file
)
21 KB
1
16:30, 30 November 2011
Change in the number of unemployed persons (compared to previous month, in thousands), seasonally adjusted, January 2006 - September 2011.PNG
(
file
)
8 KB
Reverted to version as of 11:03, 28 October 2011
3
15:46, 7 September 2011
Corporations' turnover of the environmental goods and services sector, 2004, 2007, 2008.png
(
file
)
11 KB
3
14:20, 19 August 2011
Production, share of sold production value, EU-27, 2010.PNG
(
file
)
167 KB
1
10:53, 16 August 2011
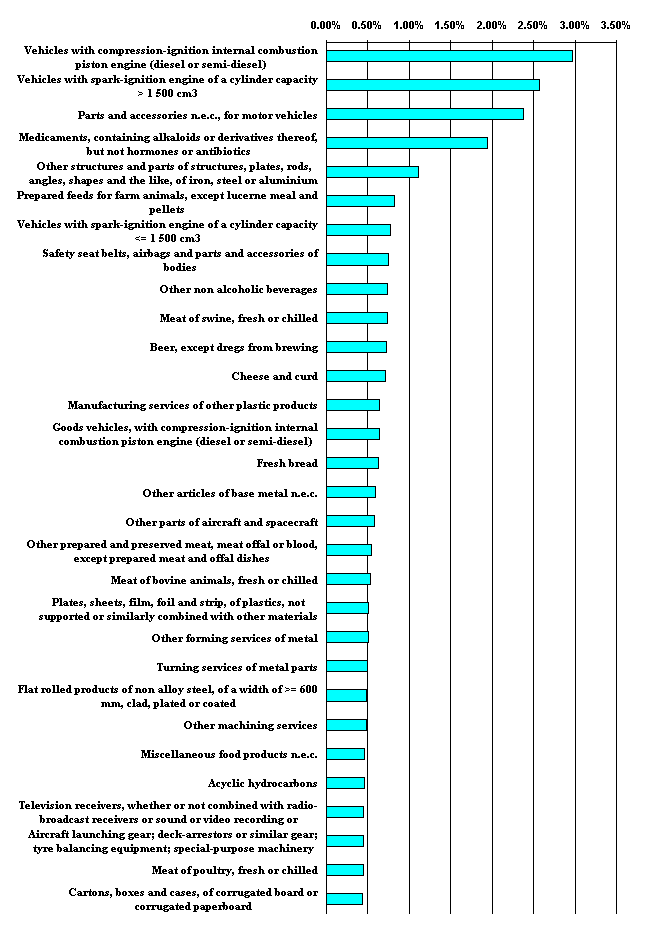
Share of EU-27 total of top-30 products at CPA level by value of sold production, 2010.PNG
(
file
)
39 KB
1
14:13, 11 July 2011
Environmental products and services sector turnover by type of production, Austria 2008.png
(
file
)
7 KB
1
16:32, 6 April 2011
Electricity market indicators 2009.xls
(
file
)
86 KB
2
16:51, 8 March 2011
Destination of international sourcing - Share of core and or support functions sourced internationally (%), 2009.png
(
file
)
9 KB
1
15:30, 16 February 2011
Extra-EU world economic regions.PNG
(
file
)
175 KB
1
17:41, 20 December 2010
Examples of map definitions in Excel.xls
(
file
)
492 KB
1
First page
Previous page
Next page
Last page
Special page
ISSN 2443-8219


.png)

.png)


_and_the_2006_population_grid_and_NUTS_2010_(right)_.png)


.png)

.png)
-ru.PNG)

-ru.png)
-ru.png)
-ru.png)
-ru.png)
-ru.png)


-ru.png)
-ru.PNG)
,_seasonally_adjusted,_January_2006_-_September_2011.PNG)


,_2009.png)
