International trade in medicinal and pharmaceutical products
Data from April 2024
Planned article update: April 2025
Highlights
The United States and Switzerland were the EU's main trading partners for medicinal and pharmaceutical products in 2023.
Among the EU countries, Germany was the largest exporter of medicinal and pharmaceutical products to countries outside the EU, in 2023.
EU trade in medicinal and pharmaceutical products, 2002-2023
This article is part of an online publication providing recent statistics on international trade in goods, covering information on the EU's main partners, main products traded, specific characteristics of trade as well as background information.
Full article
Strong growth of trade in medicinal and pharmaceutical products in 2023
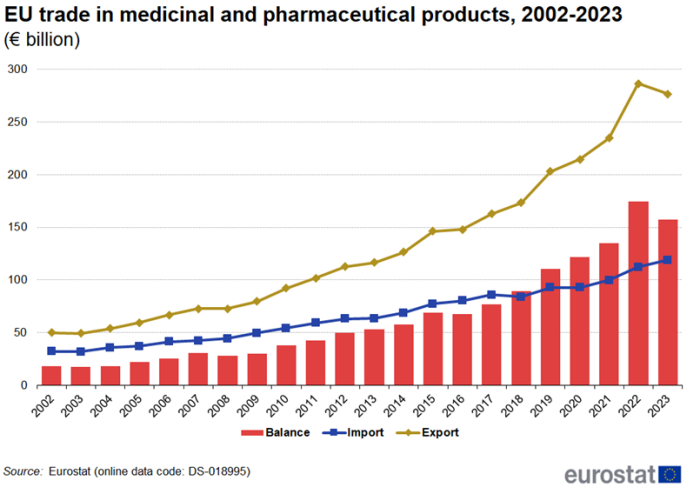
Figure 1 shows that extra-EU exports of medicinal and pharmaceutical products have decreased for the first time since 2008, dropping €10 billion compared to 2022, while imports continued to increase. Even the financial crisis of 2008, which affected trade in many other products, did not cause a fall in exports or imports. With exports increasing more than imports, the trade surplus increased from €18 billion in 2002 to a record high of €174 billion in 2022 but fell to €158 billion in 2023.
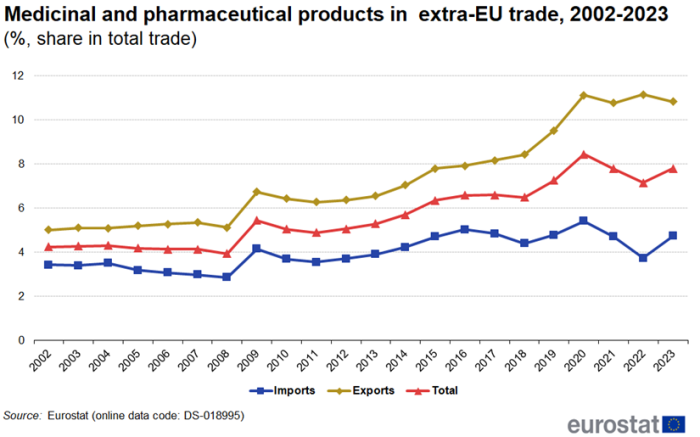
In 2023, the share of medicinal and pharmaceutical products in total extra-EU trade was 7.8% with the share for imports (4.7%) much smaller than the share for exports (10.8%). Between 2002 and 2008 these shares remained fairly stable (Figure 2). In 2009, the share of imports increased by 1.3 percentage points (pp) and exports by 1.6 pp. This was not caused by an increase in trade in medicinal and pharmaceutical products but rather by the decline in total trade. Since 2009, the shares have been fluctuating but there is a clear overall growth.
United States and Switzerland remain the top EU partners
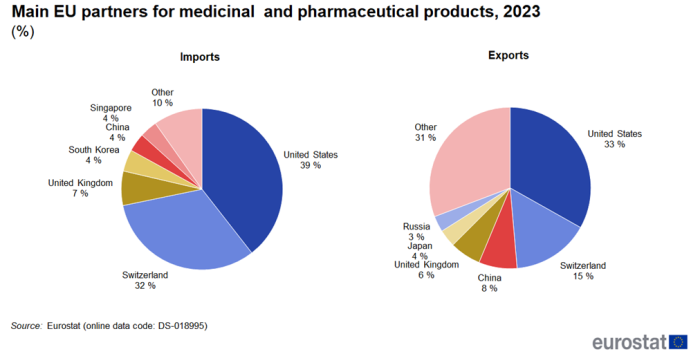
The United States stands out as the EU's main trading partner for medicinal and pharmaceutical products in 2023 (Figure 3). Exports to the United States (33 %) were almost a third of all EU exports and were followed at some distance by Switzerland (15 %) and China (8 %). Imports to the EU were dominated even more by the United States (39 %) and Switzerland (32 %) followed by the United Kingdom (7 %). Since the United States and Switzerland are by far the two largest trade partners, the development of their trade in medicinal and pharmaceutical products with the EU is shown in Figure 4 and Figure 5.
Trade with the United States and Switzerland between 2002 and 2023
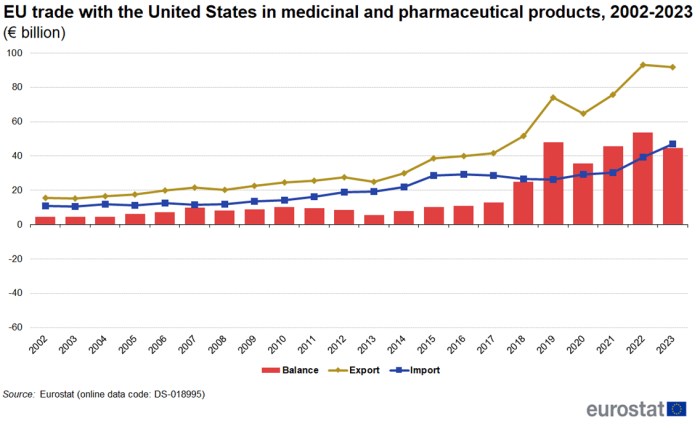
Figure 4 shows the development of trade in medicinal and pharmaceutical products between the EU and the United States from 2002 to 2023. Between 2022 and 2023, imports from the United States increased by 19.3% while exports decreased by 1.5%. This caused the trade balance to fall from €54 billion in 2022 to €45 billion in 2023. Measured as average annual growth between 2002 and 2023, exports increased by 8.8 % per year and imports increased by 7.2 % per year. During the whole period the EU has had a trade surplus with the United States, peaking at €54 billion in 2022.
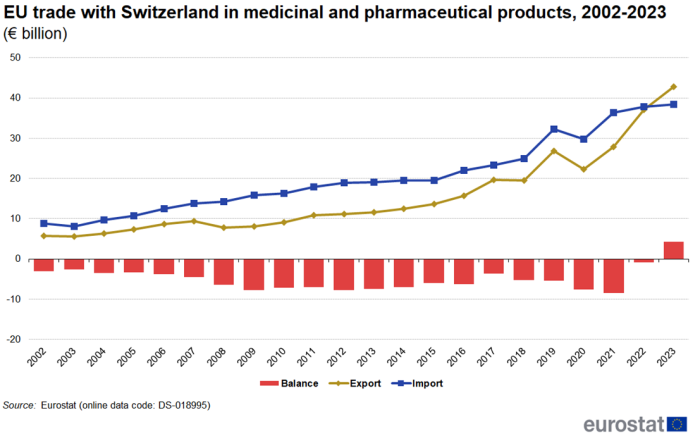
Figure 5 shows the development of trade in medicinal and pharmaceutical products between the EU and Switzerland from 2002 to 2023. In 2023, for the first time in the period under investigation, exports (€43 billion) were larger than imports (€38 billion), causing the trade deficit of €1 billion in 2022 to turn into a surplus of €4 billion in 2023. Over the whole period between 2002 and 2023, measured as average annual growth, exports increased by 10.0 % per year, while imports increased by 7.3 % per year.
Trade in medicinal and pharmaceutical products by EU Member State
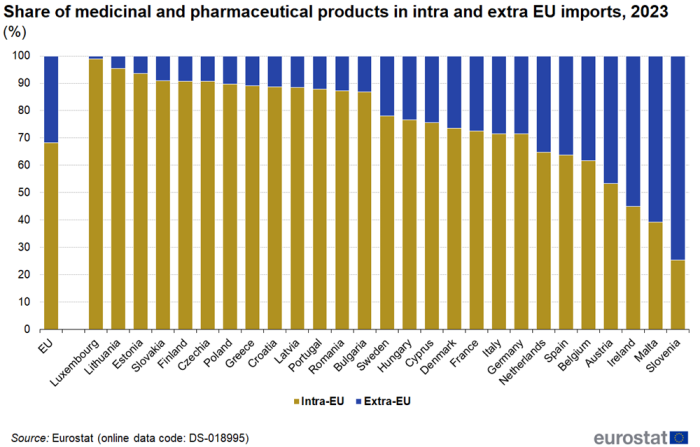
The share of intra EU imports in total (intra + extra) imports of medicinal and pharmaceutical products varied greatly between EU countries in 2023 (Figure 6). For Luxembourg, Lithuania and Estonia it was above 93 %, while for Slovenia and Malta it was below 40 %. The average for the EU was 68 %.
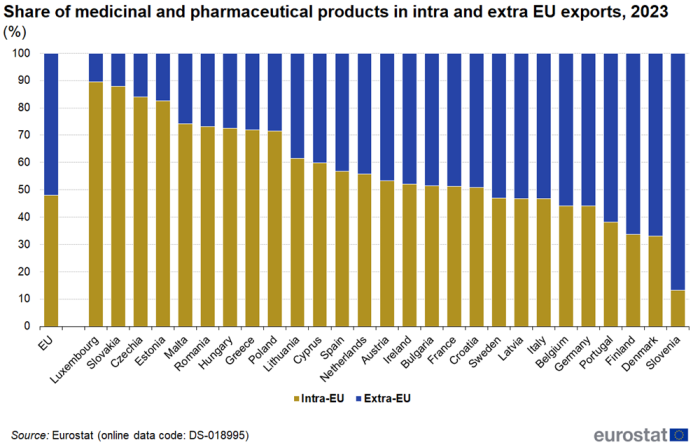
The share of intra EU exports in total (intra + extra) exports of medicinal and pharmaceutical products also varied greatly between EU countries in 2023 (Figure 7). For Luxembourg, Slovakia, Czechia and Estonia it was above 80 %, while for Portugal, Finland, Denmark and Slovenia it was below 40 %. The average for the EU was 48 %.
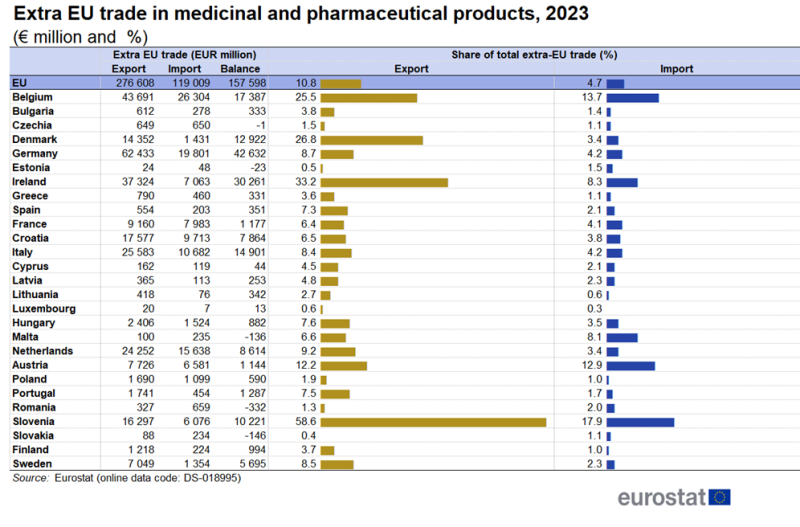
Table 1 shows that in 2023, amongst the EU countries, Germany had the highest extra-EU exports (€62 billion) followed by Belgium (€43 billion) and Ireland (€37 billion). Four countries had shares higher than 20 % for medicinal and pharmaceutical products in their total extra-EU exports. These were Slovenia (59 %), Ireland (33 %), Denmark (27 %) and Belgium (25 %).
Belgium (€26 billion), Germany (€20 billion) and the Netherlands (€16 billion) were the largest importers of medicinal and pharmaceutical products from countries outside the EU, in 2023[1]. In 2023, Slovenia (18 %), Belgium (14 %) and Austria (13 %) had the highest shares for medicinal and pharmaceutical products in their total extra-EU imports.
Germany (€43 billion) and Ireland (€31 billion) had the largest extra-EU trade surpluses for medicinal and pharmaceutical products in 2023. Only Romania, Slovakia, Malta, Estonia and Czechia had trade deficits.
Source data for tables and graphs
Data sources
This article is based on data available in the Eurostat COMEXT database for EU EU countries and in the United Nations COMTRADE database for non-EU countries.
A code (such as 'DS_018995') is inserted as part of the source. This code allows the reader to easily access the most recent EU data on the Eurostat website. Note that data on the website is frequently updated and may also be more detailed or have a different measurement unit. It should also be noted that European statistics on international trade in goods are compiled according to the EU concepts and definitions and may, therefore, differ from national data published by EU countries.
Product classification
Division 54 'Medicinal and pharmaceutical products' of the Standard international trade classification revision 4 (SITC Rev. 4), is made up of the sub-groups:
- 5411 'Provitamins and vitamins (not put up as medicaments)';
- 5413 'Antibiotics (not put up as medicaments)';
- 5414 'Vegetable alkaloids (not put up as medicaments)';
- 5415 'Hormones, prostaglandins, thromboxanes and leukotrienes';
- 5416 'Glycosides; glands or other organs; antisera, vaccines;
- 5419 'Pharmaceutical goods, other than medicaments';
- 5421 'Medicaments containing antibiotics';
- 5422 'Medicaments containing hormones, etc., but not antibiotics';
- 5423 'Medicaments containing alkaloids, but not containing hormones etc. or antibiotics';
- 5429 'Medicaments not elsewhere specified'.
Unit of measure
Trade values are expressed in millions (106) or billions (109) of euros. They correspond to the statistical value, i.e. to the amount which would be invoiced in case of sale or purchase at the national border of the reporting country. It is called a FOB value (free on board) for exports and a CIF value (cost, insurance, freight) for imports.
A bias in the geographical allocation of extra-EU flows
Extra-EU imports and exports are reported by the Member State where the customs declaration is lodged, usually the place where the goods cross the EU external frontier (here referred to as the exit/entry Member State). This is not necessarily the Member State of actual import or export. The geographical allocation of an extra-EU flow is biased in the case where the entry/exit Member State is not the actual importing/exporting Member State. In such a case, the extra-EU trade will be allocated to the entry/exit Member State and the actual importing/exporting Member State will report only intra-EU flows with the exit/entry Member State. This issue particularly impacts the extra-EU imports of EU countries having important ports for transshipment of goods like Antwerp in Belgium and Rotterdam in the Netherlands. This is why it is known as the 'Rotterdam effect'.
The United Kingdom is considered as an extra-EU partner country for the EU for the whole period covered by this article. However, the United Kingdom was still part of the internal market until the end of the transitory period (31 December 2020), meaning that data on trade with the United Kingdom are still based on statistical concepts applicable to trade between the EU countries. Consequently, while imports from any other extra-EU trade partner are grouped by country of origin, the United Kingdom data reflect the country of consignment. In practice this means that the goods imported by the EU from the United Kingdom were physically transported from the United Kingdom but part of these goods could have been of other origin than the United Kingdom. For this reason, data on trade with the United Kingdom are not fully comparable with data on trade with other extra-EU trade partners.
Context
Pharmaceutical products are among the most important products within the chemicals sector (SITC section 5). Today, the pharmaceutical sector is extensively regulated at EU level in the dual interest of ensuring the highest possible level of public health and patient confidence in safe, effective and high-quality medicinal products, while continuing to develop a single EU market for pharmaceuticals in order to strengthen the European pharmaceutical industry's competitiveness and research capability.
The most common trade impediments faced by pharmaceutical exporters are a range of burdensome and costly registration, licensing and certification procedures. The EU aims to redress these through its bilateral trade agreements or by tackling individual barriers as part of its market access partnership.
Direct access to
Notes
- ↑ Dutch and Belgian imports can be overestimated due to the so-called "Rotterdam effect" (See section Data sources for more details)
