Consumer prices - inflation
Data extracted in March 2024.
Planned update: March 2025.
Highlights
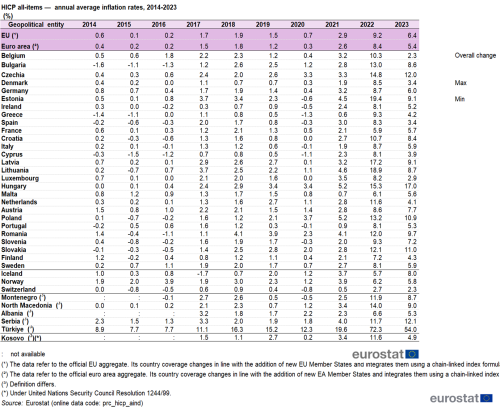
In 2023, the highest annual inflation rates among EU Member States were recorded in Hungary (17.0 %), Czechia (12.0 %) and Slovakia (11.0 %).
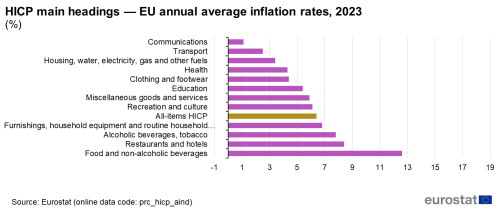
In 2023, the highest annual price increases in the EU were recorded for food and non-alcoholic beverages (up 12.6 %), greatly pushed by non-alcoholic beverages (up 12.2 %).
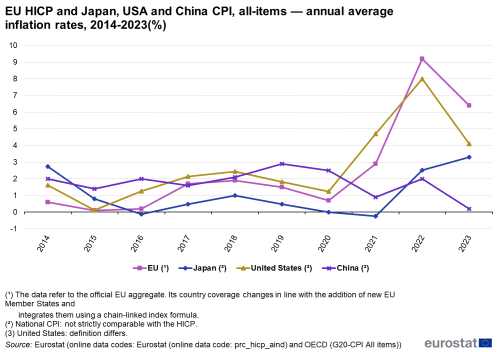
HICP and CPI all-items, development of the annual average inflation rates, 2014-2023
Inflation is the increase in the general level of prices of goods and services in an economy; the reverse situation is deflation, when the general level of prices falls. Inflation and deflation are usually measured by consumer price indices or retail price indices. Within the European Union (EU), a specific consumer price index has been developed — the harmonised index of consumer prices (HICP). Other factors (such as wages) being equal, inflation in an economy means that the purchasing power of consumers falls as they are no longer able to purchase the same amount of goods and services with the same amount of money.
Full article
Inflation: price changes over time in the European Union
Over the last decade, EU inflation decreased between 2014 and 2015, reaching a low of 0.1 % in 2015 and a slightly higher rate of 0.2 % in 2016. The average annual inflation rate increased to 1.7 % in 2017 and to 1.9 % in 2018, subsequently decreasing to 1.5 % in 2019. After a significant drop to 0.7 % in 2020, it rose sharply to 2.9 % in 2021, reaching a historical high of 9.2 % in 2022. Thus, the lowest EU inflation rates were recorded during the period 2014-2016. Annual inflation accelerated from 2017 to 2019; decreased in 2020 under the impact of the COVID-19 measures [1], increased sharply in 2021 to more than triple in 2022. In 2023 it stood at 6.4 %, the second highest rate for the period 2014-2023 (see Figure 1).
The overall change in the HICP in the EU during the period 2014-2023 was 25.2 %, or an annual average of 2.1 %. Figure 1 shows comparative consumer price developments for several of the largest world economies. Price changes in Japan were generally lower than in the EU, whereas they were generally higher in the United States and China in the period 2014-2020. During the period 2014-2023, consumer prices rose by an annual average of 0.9 % in Japan, 2.8 % in the United States and 1.7 % in China.

(%)
Source: Eurostat (prc_hicp_aind) and OECD (G20 — CPI All-items)
Among the EU Member States, Hungary (60.7 %), Estonia (49.6 %) and Lithuania (48.5 %) registered the highest overall increases in the HICP between 2014 and 2023. By contrast, Cyprus experienced the lowest overall increase in the HICP during the same period (12.7 %).
Looking at the latest annual data for the HICP (see Table 1), in 2023 consumer prices rose by as much as 17.0 % in Hungary. The next highest increases were recorded in Czechia (12.0 %) and Slovakia (11.0 %). At the other end of the range, the lowest average annual inflation rates in 2023 were recorded in Belgium (2.3 %), Luxembourg (2.9 %), and Denmark and Spain (both 3.4 %).

(%)
Source: Eurostat (prc_hicp_aind)
Inflation rates by product
Looking at the latest annual developments in the EU (see Figure 2), among the 12 main headings, consumer prices for food and non-alcoholic beverages registered the highest increase in 2023, with an average of 12.6 %. Restaurants and hotels followed, with an average increase of 8.4 %, while alcoholic beverages and tobacco rose by an average of 7.8 %. In contrast, the price of communications was 1.1 %. The other main headings all rose in 2023, between 2.5 % and 6.8 %.

(%)
Source: Eurostat (prc_hicp_aind)
Between 2014 and 2023, food and non-alcoholic beverages was the HICP main heading with the highest increase in the EU, 39.6 %. The index for alcoholic beverages and tobacco had the second-highest increase, 37.0 %. By contrast, the price of communications fell by 3.3 % overall during the same period. The remaining main headings of the HICP recorded double-digit increases during this period (see 'Source data for tables and graphs').
Source data for tables and graphs
Data sources
The HICP is an index for measuring the change in prices of consumer goods and services acquired by households in monetary transactions. Certain categories of consumption expenditure are excluded from the HICP on the grounds that they pose practical problems for price collection, do not represent monetary transactions, or do not yet have a harmonised method of treatment. These include, for example, narcotics, owner-occupied housing and games of chance.
Goods and services are classified according to the European classification of individual consumption by purpose. At the most disaggregated level currently available, Eurostat publishes around 400 sub-indices for consumer prices. The annual inflation rate measures the change of the index between one month and the same month of the previous year, and the monthly rate compares indices between two consecutive months.
The indices are compiled according to a common approach, providing comparable measures of consumer price changes across countries, as well as for different country groupings, namely: the euro area, the European Union, and the European Economic Area (which includes the EU Member States plus Iceland and Norway).
HICPs have a common reference year (currently 2015 = 100). Normally the indices are used to calculate percentage changes that show price increases/decreases. Although the rates of change shown in the tables and figures for this article are annual averages, the basic indices are compiled and published on a monthly basis.
Since October 2001, a flash estimate of the euro area inflation rate has been published at the end of each reference month. This estimate, is nowadays calculated based on data received directly from the euro area countries (nowcasting), and is replaced in the middle of the following month once a full set of data is available.
Notes
- ↑ More information on COVID-19 and the HICP can be found in the 'HICP dedicated section'.
Context
The HICP is used for measuring inflation in the euro area; the primary objective of the European Central Bank’s (ECB) monetary policy is to maintain price stability. In 2021, the ECB Governing Council specified that ‘price stability is best maintained by aiming for a two per cent inflation target over the medium term.'.
HICPs are also used for the purposes of monetary policy and assessing inflation convergence as required in the Treaty on the functioning of the European Union among other uses.
Direct access to
- Harmonised indices of consumer prices (HICP) (t_prc_hicp)
- Harmonised indices of consumer prices (HICP) (prc_hicp), see:
- HICP - monthly data (index) (prc_hicp_midx)
- HICP - monthly data (annual rate of change) (prc_hicp_manr)
- HICP - monthly data (monthly rate of change) (prc_hicp_mmor)
- HICP - monthly data (12-month average rate of change) (prc_hicp_mv12r)
- HICP - annual data (average index and rate of change) (prc_hicp_aind)
- HICP - contributions to euro area annual inflation (in percentage points) (prc_hicp_ctrb)
- HICP at constant tax rates (prc_hicp_ct)
- HICP at constant tax rates - monthly data (index) (prc_hicp_cind)
- HICP at constant tax rates - monthly data (annual rate of change) (prc_hicp_cann)
- HICP at constant tax rates - monthly data (monthly rate of change) (prc_hicp_cmon)
- HICP - administered prices (composition) (prc_hicp_apc)
- HICP - country weights (prc_hicp_cow)
- HICP - item weights (prc_hicp_inw)
ESMS metadata files
- Harmonised indices of consumer prices (HICP) (ESMS metadata file — prc_hicp_esms)
Publications