Archive:Asia-Europe Meeting (ASEM) and EU - key statistical indicators
- Data from April 2014. Most recent data: Further Eurostat information, Main tables and Database.
This article presents recent statistics on the European Union (EU) and its partners in the Asia-Europe Meeting (ASEM), highlighting the EU’s and the ASEM’s role in the world. It compares the ASEM economies and analyses the economic ties between the 28 EU Member States (EU-28), Switzerland and Norway on the one hand and the ASEM partners in Asia and Oceania on the other. This includes a deeper look at the gross domestic product (GDP), as well as mutual foreign direct investments (FDI), trade in goods and trade in services.
The Asia-Europe Meeting (ASEM) is Europe’s main multilateral channel for communication with Asia. Its key objective is to strengthen relations between Asia and Europe in a spirit of mutual respect and partnership. The European Commission has a strong interest in promoting closer Asia-Europe relations and multilateralism in the international arena.

‘‘Source:’’ Eurostat (demo_pjan) and United Nations Population Division of the Department of Economic and Social Affairs

‘‘Source:’’ Eurostat (demo_pjan) and United Nations Population Division of the Department of Economic and Social Affairs

‘‘Source:’’ Eurostat (nama_gdp_c) and World Bank

‘‘Source:’’ Eurostat (nama_gdp_c) and World Bank

‘‘Source:’’ Eurostat (nama_gdp_c), United Nations Population Division of the Department of Economic and Social Affairs, World Bank

‘‘Source:’’ Eurostat (bop_fdi_flow_r2)

‘‘Source:’’ Eurostat (bop_fdi_pos_r2)

‘‘Source:’’ Eurostat (DS_018995) and (DS-043227)

‘‘Source:’’ Eurostat (DS_018995) and (DS-043227)

‘‘Source:’’ Eurostat (DS_018995) and (DS-043227)

‘‘Source:’’ Eurostat (DS_018995) and (DS-043227)

‘‘Source:’’ Eurostat (DS_018995) and (DS-043227)

‘‘Source:’’ Eurostat (DS_018995) and (DS-043227)

‘‘Source:’’ Eurostat (DS_018995) and (DS-043227)

‘‘Source:’’ Eurostat (bop_its_det)
Main statistical findings
Population
The main part of the world population is concerned by ASEM
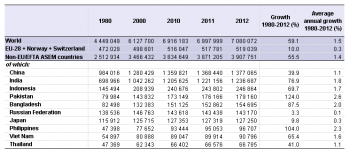
ASEM is a forum relevant to a major part of the population across the globe. In total, the population of the ASEM countries made up 62.5 % of the world population in 2012. The EU-28 and the European partners Switzerland and Norway represented 7.3%, while the other ASEM partners represented 55.2 % of the world population. Amongst the ASEM partners, especially China and India stand out; China alone made up almost a fifth of the total world population, India made up a sixth.
Overall, the share of ASEM in the world population has fallen slightly over the last 30 years, from 67.1 % in 1980 to 62.5 % in 2012. The share of the ASEM partners in Asia and Oceania has remained relatively stable over this period, amounting to 56.5 % in 1980, 56.2 % in 2000 and 55.2 % in 2012. The growth in the population of these countries over the period is almost exactly the same as for the world population as a whole.
In contrast, the population of the European partners in ASEM, the EU-28 plus Norway and Switzerland, has grown slowly. The average growth rate was a mere 0.3 % over this period. As a result, the share of the European ASEM partners in the world population fell from 10.6 % in 1980 to 7.3 % in 2012.
Over the same time, the population more than doubled in several of the Asian partners. In particular, this happened in Pakistan and in most of the member states of the ASEAN: Cambodia, Singapore, Brunei, Malaysia, Lao PDR and the Philippines.
Gross domestic product (GDP)
EU-28 and its ASEM partners create more than half of world GDP
In 2012, 57% of the gross domestic product (GDP) in the world was created in ASEM. The EU-28 together with Norway and Switzerland produced roughly a quarter of world GDP, while the other ASEM partners produced almost a third. Amongst these partners, especially China and Japan stands out, with 11 % and 8 % of world GDP respectively.
For the world as a whole, GDP at current prices has risen at an average rate of 6.2 % over the period 2005 to 2012. Despite a slowdown in GDP growth in the ‘crisis years’ 2008 to 2010, GDP growth has picked up again in later years. However, it should be noted that GDP at current prices is not adjusted for inflation.
Over this period, the ASEM as a whole outperformed the world economy. The GDP of ASEM grew by an average of 6.6 %. This was driven in particular by the Asian partners, whose GDP at current prices rose at an average rate of 10.8 %. Amongst the larger economies, the GDP rose strongly in particular in China and Indonesia. Many of the Asian ASEM partners recorded an average rise in GDP of more than 10 % over this period. The development was more challenging for the European partners; the combined GDP at current prices of the EU-28, Norway and Switzerland grew by 2.5 % on average over the period.
The GDP is generally considered a basic measure of a country's overall economic health. A key issue is how this translates to the citizens in the country, measured as GDP per inhabitant. This is normally called ‘GDP per capita’. In 2012, the combined GDP per capita of the EU-28, Norway and Switzerland was close to EUR 26 700 per inhabitant. In comparison, the value for the world was almost EUR 8 000. For the ASEM partners in Asia and Oceania, the combined GDP per inhabitant was close to EUR 4 700. However, this total masks large differences between countries. Indeed, in 2012 the aggregated GDP per capita of the European ASEM partners was exceeded by Australia, Singapore, Japan, Brunei and New Zealand. Nevertheless, amongst all ASEM partners the highest GDP per capita was registered in Luxembourg, Norway and Switzerland.
It should be noted that this direct measure is not adjusted for differences in price level between countries. GDP per capita also does not reflect the distribution of income and wealth within countries.
Foreign direct investments (FDI)
Strong ties between the economies of the ASEM
The figures for FDI flows vary strongly form year to year, reflecting both general economic conditions and the investment decisions of individual economic actors. The available data show strong links between the ASEM economies, with large and increasing investments across the partner economies.
Within ASEM, investors in the EU-28, Norway and Switzerland invested large amounts in particular in China and Australia in 2012. For China this is a continuing trend over the past years, whereas the European investments in Australia have varied strongly from year to year. Other interesting Asian ASEM investment markets are India, Indonesia and South Korea, although there was a blip in the European partners’ investment in South Korea in 2012.
Looking at the investment flows in the opposite direction, investments in the EU-28, Norway and Switzerland came particularly from China, South Korea and Thailand in 2012. In the preceding years, there were also considerable investments in these European economies from India and Australia. However, for both countries there have been large swings in these investment flows from year to year.
By 2012, investments from the EU-28, Norway and Switzerland in the ASEM partner economies were valued at EUR 482 billion, down from a valuation of EUR 516 billion in 2011. However, it should be noted that date are not available for all partners. The highest value of European outward FDI stocks in 2012 was in Australia, followed by China and Japan. Amongst the ASEM partners for whom data are available, investments in the economies of the EU-28, Norway and Switzerland reached EUR 258 billion in 2012. Japanese investors had accumulated two thirds of these investments, with Japanese investments valued at EUR 163 billion.
International trade in goods
Exports to the ASEM partners rose sharply in 2012, reducing the trade deficit
The combined exports of EU-28, Norway and Switzerland to the ASEM partners jumped by 10 %, from EUR 477 billion in 2011 to EUR 525 billion in 2012. At the same time, imports rose by just 1 % to EUR 779 billion. This resulted in a significantly improved trade balance with the ASEM partners, reducing the deficit by almost 14% to EUR 254 billion.
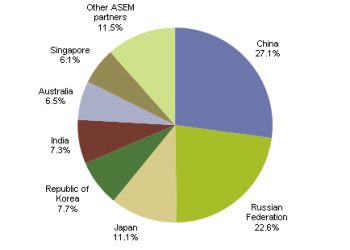
Among the ASEM partners, China was by far the main destination for exports from EU-28, Norway and Switzerland in 2012, followed by Russia. Together, these two countries were the destination for half of the exports to the ASEM partners in 2012. At some distance, Japan, South Korea and India followed. From 2011 to 2012, the exports increased to all ASEM partners except India and Bangladesh. Amongst the largest ASEM partners, the sharpest rises in exports were seen for Russia and Japan.
Also on the import side, China dominated as source for imports from ASEM to the EU-28, Norway and Switzerland. Again, Russia followed with some distance. Together, the imports from China and Russia made up almost two thirds of the imports from ASEM partners in 2012. Japan followed far behind these two as the third most important source for imports from ASEM. Whereas the imports in particular from Russia rose from 2011 to 2012, they fell for Japan, India and China.
Machinery and vehicles is the dominant product group in ASEM trade
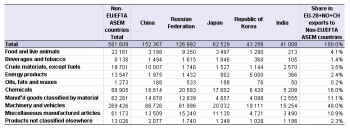
Machinery and vehicles made up close to half of the exports from EU-28, Norway and Switzerland to the ASEM partners in 2012. Included in this group are e.g. cars and trucks, medical apparatus, aircraft, and oil and gas extraction machinery. The next largest group, albeit much less important, was chemicals; the main product group within chemicals was pharmaceuticals.
With slightly more than a third of the total, machinery and vehicles was the largest group also in the imports from the ASEM partners to EU-28, Norway and Switzerland. Within the imports of this product group, the main products included electronic equipment, computers, telephones and other telecommunications equipment. The import of energy products was also important; the main products within this group were crude oil and natural gas. The third largest product group in imports was miscellaneous manufactured articles, mainly clothing and footwear.
The products traded with individual ASEM partners differ strongly
There are large differences in the types of products that the EU-28, Norway and Switzerland export to and import from the different ASEM partners. The importance of the ASEM partners to the exports and imports of the different product groups also varies distinctly.
The exports from the EU-28, Norway and Switzerland to China are strongly dominated by machinery and vehicles, making up 57 % of the total exports to China. This is also the most central product group in the exports to Russia (49 % of the total), South Korea (44 %), India (37 %) and Japan (32 %). However, also chemicals have a central role, in particular in the exports to Japan (28 %). Manufactured goods classified by material are equally important to the exports to India, making up 30 % of the total exports from the EU-28, Norway and Switzerland to that country.
On the import side, the profile of the ASEM partners in their trade with the EU-28, Norway and Switzerland is much more differentiated. Machinery and vehicles make up almost two thirds of the imports from Japan and South Korea. This product group makes up half of the imports also for China; however, with 30% of the total, also the miscellaneous manufactured articles play a central role in the imports from China.
Overall, China dominates the imports from ASEM to the EU-28, Norway and Switzerland for several important product groups: miscellaneous manufactured articles (63 % of total imports from ASEM partners), machinery and vehicles (55 %) and manufactured articles classified by material (46 %).
The imports from Russia is characterised by a heavy dominance of energy products, mainly crude oil and natural gas. This makes up more than three quarters of the imports from Russia. Indeed, Russia stands for almost all of the imports of energy products from the ASEM partners. However, on the whole, the ASEM partners only make up a bit more than a third of the energy product imports to the EU-28, Norway and Switzerland.
The ASEM partners are much more important to the imports of miscellaneous manufactured articles (68 % of the total imports), machinery and vehicles (61 %) and manufactured articles classified by material (50 %). They are also central to the imports of oils, fats and waxes, although the total value is much lower than for the other product groups.
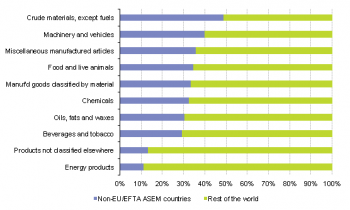
Within the exports, the ASEM partners are core markets in particular for crude materials other than fuels and for machinery and vehicles. The ASEM partners are also the destination for roughly a third of the exports of miscellaneous manufactured articles, of food and live animals, of manufactured goods classified by material and of chemicals.
International trade in services
Surplus in trade in services with all major ASEM partners except Thailand
In 2012, the EU-28, Norway and Switzerland recorded surpluses in the trade of services with almost all major ASEM partners. The largest surplus was recorded in the trade in services with Russia (EUR 14 billion), followed by Australia (EUR 11 billion), China and Japan (both EUR 9 billion).
This continued the trend seen also in 2011 and 2010; the European ASEM partners increase their surplus in trade of services with these countries year by year. The same also applied to South Korea. In the trade of services with India, the trade surplus fell from 2010 to 2011, but rose again in 2012, although not enough to match the surplus in 2010.
The only substantial deficit was recorded in trade in services with Thailand (EUR 2 billion), increasing by 10 % compared to the deficit in 2011. The main reason for this deficit is the high value of personal travels from the EU-28, Norway and Switzerland to Thailand, amounting to more than EUR 3 billion in 2012.
For most of the other major ASEM partners, the major part of the surplus in trade of services came from ‘Other services’, in particular ‘Other business services’. However, for Russia, also the personal travels from Russia to the EU-28, Norway and Switzerland contributed strongly (EUR 8 billion) to the trade surplus. Also for China, Australia and Japan personal travels contributed significantly to the trade surplus of the European ASEM partners.
Amongst the ‘Other business services’, EU-28, Norway and Switzerland recorded considerable surpluses for ‘Royalties and license fees’ from Singapore (EUR 4 billion), China (2 billion), as well as Russia, South Korea and Australia (almost EUR 1 billion for each). Another important product category is ‘Computer and information services’, which generated surpluses especially in the trade with Japan (EUR 3 billon), Russia (EUR 2 billion), China and Australia (both EUR 1 billion). However, there was a deficit of almost half a billion euro in the trade of computer and information services with India in 2012.
Data sources and availability
Data source: The figures presented in this publication have been extracted from Eurostat’s free dissemination database Eurobase and reflect the data availability as of April 2014. Data on the international trade of goods are also available from Eurostat’s COMEXT database. EU totals refer to EU-28.
Definitions:
Gross domestic product (GDP): National accounts data for the ASEM partners outside Europe have been extracted from the World Bank’s databases. These official figures conform to the System of National Accounts (SNA).
For European countries, annual national accounts are compiled in accordance with the European System of Accounts (ESA95); ESA is broadly consistent with the SNA as regards the definitions, accounting rules and classifications.
Data on foreign direct investment (FDI) are based on the methodological framework of the OECD Benchmark Definition of Foreign Direct Investment - Third edition. Foreign direct investment (FDI) is the international investment made by an entity in one economy (direct investor) to acquire a lasting interest in an enterprise operating in another economy (direct investment enterprise).
Through outward FDI flows, an investor country builds up FDI assets abroad (outward FDI stocks). Correspondingly, inward FDI flows cumulate into liabilities towards foreign investors (inward FDI stocks). Changes in FDI stocks differ from FDI flows because of the impact of revaluation (changes in prices and exchange rates) and other adjustments.
Data on the trade of goods: The statistics on trade of goods between EU member states and countries outside the EU (extra-EU trade) do not record exchanges involving goods in transit, placed in a customs warehouses or given temporary admission (known as "special trade"). The trade partner is the country of final destination of the goods.
SITC classification (Figures 5, 6, 7 and 8, Tables 2 and 3)
Information on commodities exported and imported is presented according to the Standard international trade classification (SITC) at a general level. A full description of SITC is available through Eurostat’s classification server RAMON.
COMEXT data (international trade of goods): please note that the sums of the individual SITC product categories are less than the totals, due to confidentiality issues.
Data on the trade in services are based on balance of payments statistics. The balance of paymentsrecords all economic transactions between a country (i.e. its residents) and foreign countries or international organisations (i.e. non-residents of that country) during a given period. As part of the balance of payments, the current account records real resources and is subdivided into four basic components: goods, services, income and current transfers. The methodological framework used is that of the fifth edition of the International Monetary Fund (IMF) Balance of Payments Manual (BPM5). The EU balance of payments is compiled by Eurostat in accordance with a methodology agreed with the European Central Bank (ECB).
The category "Other services" includes: “Merchanting”, “Architectural, engineering and other technical consultancy”, “Services between affiliated enterprises”, “Communication”, “Construction”, “Insurance”, “Financial”, “Computer services” and “Royalties and license fees”.
Context
The Asia-Europe Meeting (ASEM) is an informal process of dialogue and co-operation, bringing together the European Union Member States and the European Commission with 20 Asian countries and the ASEAN Secretariat. The ASEM dialogue addresses political, economic and cultural issues, with the objective of strengthening the relationship between the two regions, in a spirit of mutual respect and equal partnership.
Apart from the official meetings, nearly 100 initiatives have been implemented over the past decade, including numerous expert-level, thematic working meetings and symposia, often involving the business communities and civil society groups of the two regions. Subjects covered have extended from the initial emphasis on economic cooperation to include human rights, rule of law, global health threats, sustainable development, and intercultural and interfaith dialogues.
ASEM currently has 51 partners: 49 countries, the European Commission and the ASEAN Secretariat. The countries are: Australia, Austria, Bangladesh, Belgium, Brunei Darussalam, Bulgaria, Cambodia, China, Cyprus, the Czech Republic, Denmark, Estonia, Finland, France, Germany, Greece, Hungary, India, Indonesia, Ireland, Italy, Japan, Republic of Korea, Laos, Latvia, Lithuania, Luxembourg, Malaysia, Malta, Mongolia, Myanmar, the Netherlands, New Zealand, Norway, Pakistan, the Philippines, Poland, Portugal, Romania, Russia, Singapore, Slovakia, Slovenia, Spain, Sweden, Switzerland, Thailand, the United Kingdom and Viet Nam. Croatia is officially a partner of ASEM as of October 2014.
See also
- The EU in the world - introduction (online publication)
- ASEAN-EU - trade and investment statistics
- Korea-EU - business demography
- From birth to death: a closer look at business demography in selected EU countries and the Republic of Korea - Statistics in focus 1/2014
Further Eurostat information
Publications
- The EU in the world 2013 — A statistical portrait - Statistical book (2013)
- The European Union and the BRIC countries - Pocketbook (2012)
- The European Union and the Republic of Korea - A statistical portrait - Statistical book (2012)
- Goods trade with ASEAN countries rebounds from 2009 to 2010 - Statistics in focus 47/2011
Main tables
- Population, see:
- Demography (t_pop)
- Population (t_demo_pop)
- National accounts, see:
- GDP and main components (t_nama_gdp)
- Balance of payments, see:
- Balance of payments - International investment positions (t_bop_q)
- International trade in services, geographical breakdown (t_bop_its)
- European Union direct investments (t_bop_fdi)
- International trade, see:
- International trade data (t_ext)
- International trade long-term indicators (t_ext_lti)
Database
- Population, see:
- Demography (pop)
- Demography - National data (demo)
- National accounts, see:
- Annual national accounts (nama)
- GDP and main components (nama_gdp)
- Exports and imports by Member States of the EU/third countries (nama_exi)
- Balance of payments, see:
- Balance of payments statistics and International investment positions (bop_q)
- International trade in services, geographical breakdown (bop_its)
- European Union direct investments (bop_fdi)
- International trade, see:
- International trade data (ext)
- International trade detailed data (detail)
Dedicated section
- International Statistical Cooperation
- Population
- National accounts (including GDP)
- Balance of payments
- International trade
Methodology / Metadata
- Eurostat - RAMON (classification server)
- IMF Balance of Payments Manual - Fifth edition
- OECD Benchmark Definition of Foreign Direct Investment - Third edition
Source data for tables, figures and maps (MS Excel)
External links
- ASEM Infoboard – The official information platform of the Asia-Europe Meeting (ASEM)
- European External Action Service (EEAS): European Union involvement in the Asia-Europe Meeting
- European Commission – DG Development and Cooperation - EuropeAid: Building strong and lasting links with Asia
Notes
[[Category:<Asia>|Asia-Europe Meeting (ASEM) and EU - key statistical indicators]] [[Category:<Non-EU_countries>|Asia-Europe Meeting (ASEM) and EU - key statistical indicators]] [[Category:<Statistical_article>|Asia-Europe Meeting (ASEM) and EU - key statistical indicators]]
