Industrial producer price index overview
Data extracted in February 2024.
Planned article update: February 2025.
Highlights
Source: Eurostat (sts_inpp_m), (sts_inppd_m), and (sts_inppnd_m)
This article provides a general overview of the (industrial) producer price index (PPI), sometimes also called output price index, as it is calculated and used at the level of the European Union (EU) and its Member States.
Please also see the monthly Eurostat News Release from 3 July 2024. Please note that the news release focusses on domestic producer prices while this article also presents industrial producer prices for the total market (domestic and non-domestic).
Full article
Role of the industrial producer price index
The industrial producer price index measures the gross monthly change in the trading price of industrial products (there are also producer price indices for construction and for services).
The industrial producer price index (PPI) measures price changes from the point of view of the producers/manufacturers of a product (it is thus an output price). In this it differs from consumer price indices, which measure the prices from the point of view of consumers/buyers (see below). The PPI reflects basic prices, which exclude VAT and similar deductible taxes directly linked to turnover. By contrast, any subsidies on products received by the producer should be added. In order to show the true development of price movements, actual transaction prices - instead of list prices - are collected.
Industrial producer price index - sub-indices
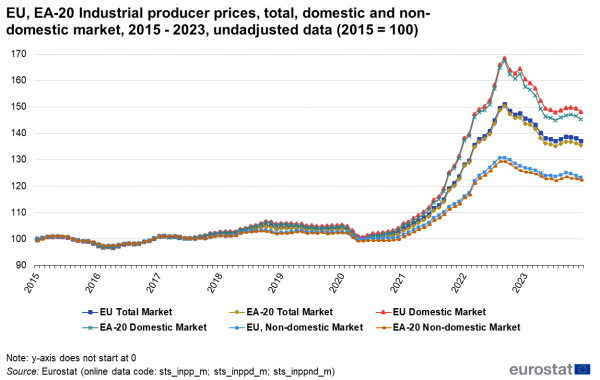
There are two sub-indices for the industrial producer price index, one for the domestic market and one for the non-domestic market (Figure 1). When combined, the sub-indices give the change in the PPI for a given industry. For producer prices on the non-domestic market, the prices are calculated at national frontiers, FOB (free on board); this means that the seller pays for transportation of the goods to the port of shipment, plus loading costs, and the buyer pays freight, insurance, unloading costs and transportation from the port of destination to their factory. All characteristics that determine the price of the products have to be taken into account. This includes quantity of units sold, transport provided, rebates, service conditions, guarantee conditions and destination.

Source: Eurostat (sts_inpp_m), (sts_inppd_m), and (sts_inppnd_m)
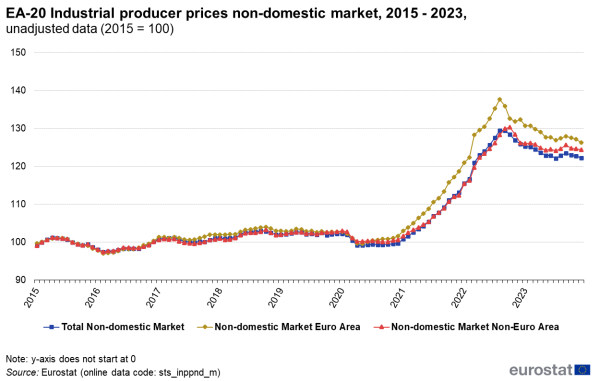
The index for the non-domestic market is further divided into an index for the euro area and one for the non-euro area (Figure 2). These sub-indices are only provided for countries in the euro area.
As Figures 1 and 2 illustrate, the various sub-indices for the EU, the euro area and for domestic and non-domestic market all moved in a relatively similar fashion.
Source: Eurostat (sts_inppnd_m)
Source: Eurostat (sts_inppd_m)
Industrial producer prices - development since 2015
Following the financial and economic crisis in 2008/2009 producer prices regained their pre-crisis level in late 2010/early 2011. In the years following 2015 industrial producer prices remained relatively stable.
In 2020, industrial producer prices on the domestic market rapidly decreased by around 3.9 % during the first wave of the Covid-19 crisis. The fall was remarkable since it occurred in a short period of just three months (February to May). The size of the reduction was, however, smaller than during the financial crisis.
As of June 2020, industrial producer prices started to increase again. The development was quite dynamic and even accelerated during the last months of 2021 and the first half of 2022. Between May 2020 and September 2022, the total industrial producer price index increased by more than two thirds.
Between September 2022 and July 2023, industrial producer prices fell again – almost as dynamically as they had increased in the months before. Since then prices have remained relatively stable and are still at a historically high level.
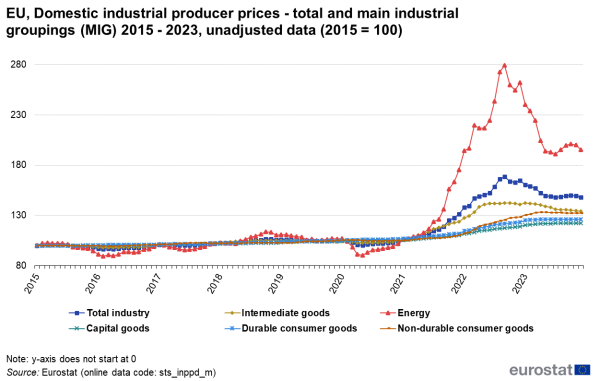
Figure 3 shows the (annual) aggregated price data on the domestic market for the Main industrial groupings (MIG). For most areas, prices developed in a relatively stable manner. Producer prices for energy are, however, very volatile and react much stronger in times of crisis. Figure 3 also shows that the unprecedented increase in producer prices between May 2020 and September 2022 was to a large extent the result of an increase in energy prices.
Source: Eurostat (sts_inppd_m)
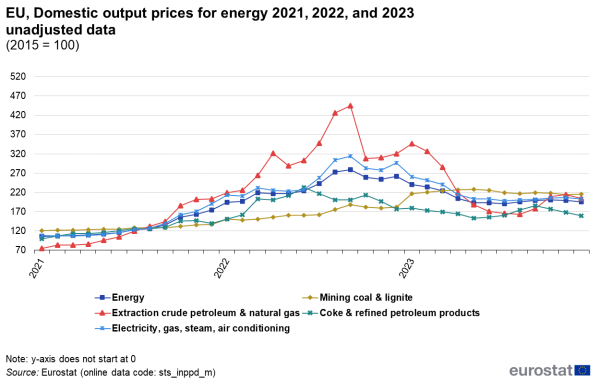
Figure 4 shows in greater detail how the recent developments of producer prices were influenced by energy prices. Between January 2021 and September 2022 (the peak of the price development), domestic industrial producer prices increased by 59.1 %, averaging around 2 % per month. During the same period, producer prices for energy increased by an average of almost 5 % per month, which amounted to a total increase of 163.0 %. Since September 2022, energy prices dropped by 30.1 % (-2.3 % on average per month).
Particularly strong were the variations for the extraction of crude petroleum and natural gas (9 % on average per month between January 2021 and September 2022 and -5 % on average per month between September 2022 and December 2023) and the manufacturing of electricity, gas, steam and air conditioning (5 % average per month between January 2021 and September 2022 and -3 % on average per month between September 2022 and December 2023).
Source: Eurostat (sts_inppgr_a)
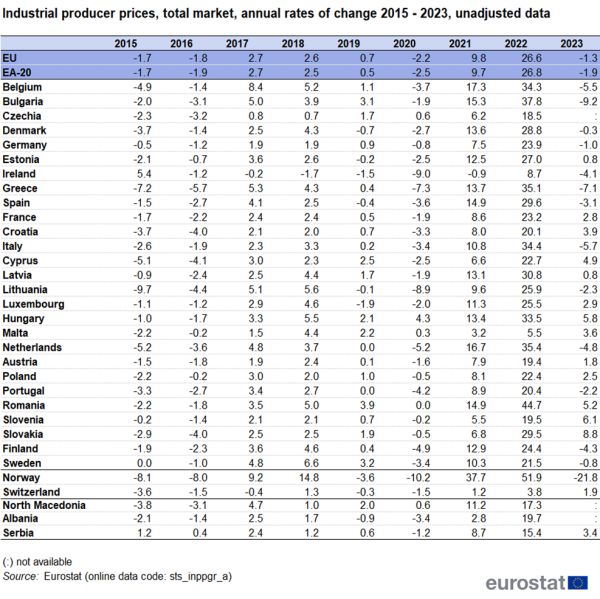
Table 1 shows the annual rates of change for the EU, the euro area and the individual Member States. In 2015 and 2016, the moderate downward trend that had started some years earlier continued. In 2017, an increase in prices can be observed in almost all EU countries. In 2018 and 2019, prices continued their upward trend, in 2019 the development was for most countries, although much less dynamic than in the year before.
In 2020, the total industrial producer price dropped in a large majority of countries and the magnitude of the decreases sometimes reached the levels that were witnessed during the economic and financial crisis in 2008/2009. In 2021, almost all countries witnessed massive increases in industrial producer prices with annual rates of change of two digits. The only exception to the general trend is Ireland, where the industrial producer prices slightly fell. Despite the fact that prices started to fall again in late 2022, the annual rates for this year were exceptionally high for all countries. They ranged from almost 45 % in Romania to around 6 % in Malta. In 2023, the consolidation of price levels that had already started in the second half of 2022 continued. Around half of the countries for which data are available even showed a negative rate of change for total industrial output prices.
Source data for tables and graphs
Data sources
Coverage
The data collection at European level is based on Regulation (EU) No 2019/2152 (European Business Statistics Regulation) of 27 November 2019 and Commission Implementing Regulation (EU) No 2020/1197 of 30 July 2020. In addition to the regulations there is also a methodological guide to ensure consistent data collection in all countries which was developed by Eurostat with the help of Member States.
All Member States are obliged to transmit data at 2-digit level of the NACE classification (an EU standard classification of economic activities) for:
- Mining and quarrying (Section B);
- Manufacturing (Section C);
- Electricity, gas and water supply (Section D and division E36).
The industrial producer price index is published monthly. Countries send data to Eurostat no later than one month and 5 days after the end of the reference period. Eurostat publishes the European price index one month and 5 days after the reference period.
Data collection
The PPI data are based on selling prices reported by establishments of all sizes selected as being representative of the whole population. Regular collection of prices data normally flows from a sample of units and a sample of their products. Data are increasingly collected by electronic means. The basic sampling method used varies from one national statistical authority to another (cut-off sampling or sampling proportional to size are applied) and depends on the market that is being studied – i.e. domestic or non-domestic. On the domestic market, the sample of enterprises is normally drawn from the Statistical Business Register. The observation units for the PPI for the non-domestic market are very often selected from external trade data. Samples for the PPI for the non-domestic market are generally much smaller than those for the domestic market.
One key issue in the production of PPIs is to measure the price of the same product over time. In many industrial sectors, the products evolve rather quickly. Therefore methods to deal with the change of product and quality adjustment are important. The aim is to measure accurately which part of the price development comes from a quality change and which part is a real price change. Especially for tailor made industrial products (e.g. railway locomotives) rather sophisticated methods are needed to identify price changes in a correct manner.
Weights for the aggregation of prices into indices are based on turnover information from the Structural Business Statistics database or on information coming directly from Member States. Weights and base years are generally revised every five years. The data in this article were calculated with 2015 as the base year (=100). As of March 2024 short-term statistics data use the base year 2021.
Context
PPI data are widely used by both the business community and government, and enable monthly monitoring of prices at different stages of the manufacturing process. There are three major uses of PPIs.
- As an economic indicator – PPIs capture price movements prior to the retail level. Therefore, they may foreshadow subsequent price changes for businesses and consumers. They can be an early indicator of inflationary pressures in the economy. These data are used in formulating fiscal and monetary policies.
- As a deflator of other economic series – PPIs are used to adjust other economic time series for price changes.
- As the basis for contract price adjustments (escalation) – PPI data are used in escalating purchase and sales contracts. These contracts typically specify amounts of money to be paid at some point in the future. It is often desirable to include an escalation clause that takes account of increases in input prices.
In many countries, there is a big demand for PPIs from the business and trade organisations. As these indices have already been in existence for decades, they are part of economic life for national accountants and businesses. For these uses they need to be maintained by the national statistical institutes at a detailed level. Many medium-sized and small countries calculate detailed PPIs beyond the requirements of the EU Regulation in order to satisfy a national demand.
Source: Eurostat (sts_inppd_m) and (prc_hicp_midx)
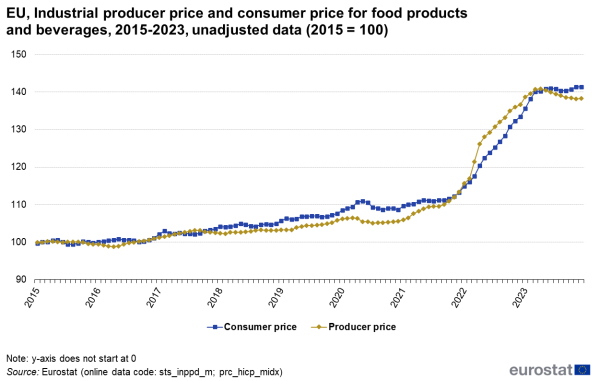
To some extent the direction and magnitude of changes in the PPI for finished goods prefigures a similar change in the consumer price index (CPI) for all items (Figure 5). This relation is however not general. Both the PPI and CPI measure price change over time for a fixed set of goods. A primary use of the PPI is to deflate revenue streams in order to measure real growth in output. A primary use of the CPI is to adjust income and expenditure streams for changes in the cost of living. The different uses cause various conceptual differences that can be described as follows:
- The definition of prices – The price collected for an item included in the PPIs is the revenue received by its producer. Sales and excise taxes are not included in the price because they do not represent revenue to the producer. The price collected for an item included in the CPI is the expenditure by a consumer for the item. Sales and excise taxes are included in the price because they are necessary expenditures by the consumer for the item.
- The composition of the set of commodities and services – The target set of goods and services included in the PPIs is the entire marketed output of the producers. The set includes both goods and services purchased by other producers as inputs to their operations or as capital investment, and goods and services purchased by consumers either directly from the service producer or indirectly from a retailer. Because the PPI target is the output of the producers, imports are excluded. The target set of items included in the CPI is the set of goods and services purchased for consumption purposes by the households. This set includes imports.
Direct access to
Other articles
Publications
Main tables
- Industry (NACE Rev.2) (t_sts_ind)
- Producer prices in industry (PPI) (t_sts_ind_pric)
Database
- Industry (NACE Rev.2) (sts_ind)
- Producer prices in industry (sts_ind_pric)