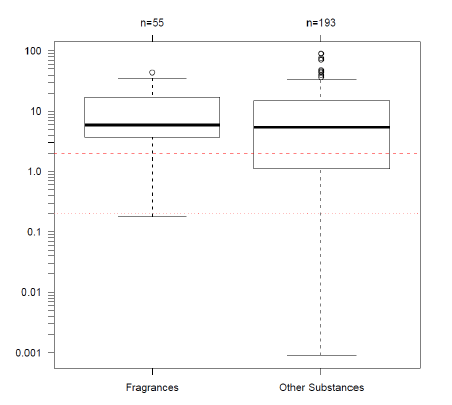
Figure 8-1: The distribution of fragrance chemicals and a variety of other chemicalsThe distribution of fragrance chemicals and a variety of other chemicals (e.g. biocides, dyes, plastic materials), taken from the three references (164-166), are depicted as boxplots on a logarithmic scale. The bottom of the box denotes the 1st quartile (25% percentile), the thick line in the box the median, and the top of the box the 3rd quartile (75% percentile). Outliers, i.e. below the 25% and above the 75% percentiles, are shown as whiskers. Beyond the 1.5-fold interquartile range, single values are shown as circles instead of whiskers. The difference in distribution is not significant (Wilcoxon test: p=0.061).  Note: EC3 values for the five oxidised fragrances additionally examined (Table 8-2) range from 3.0 to 4.8 (median 4.4) and are lower by a factor of around 7 than EC3 values of the respective non-oxidised material. Source:
SCCS, |