
In 2019, households in the EU spent over €1 700 bn (equivalent to 12.3% of EU GDP) on ‘Housing, water, electricity, gas and other fuels’.
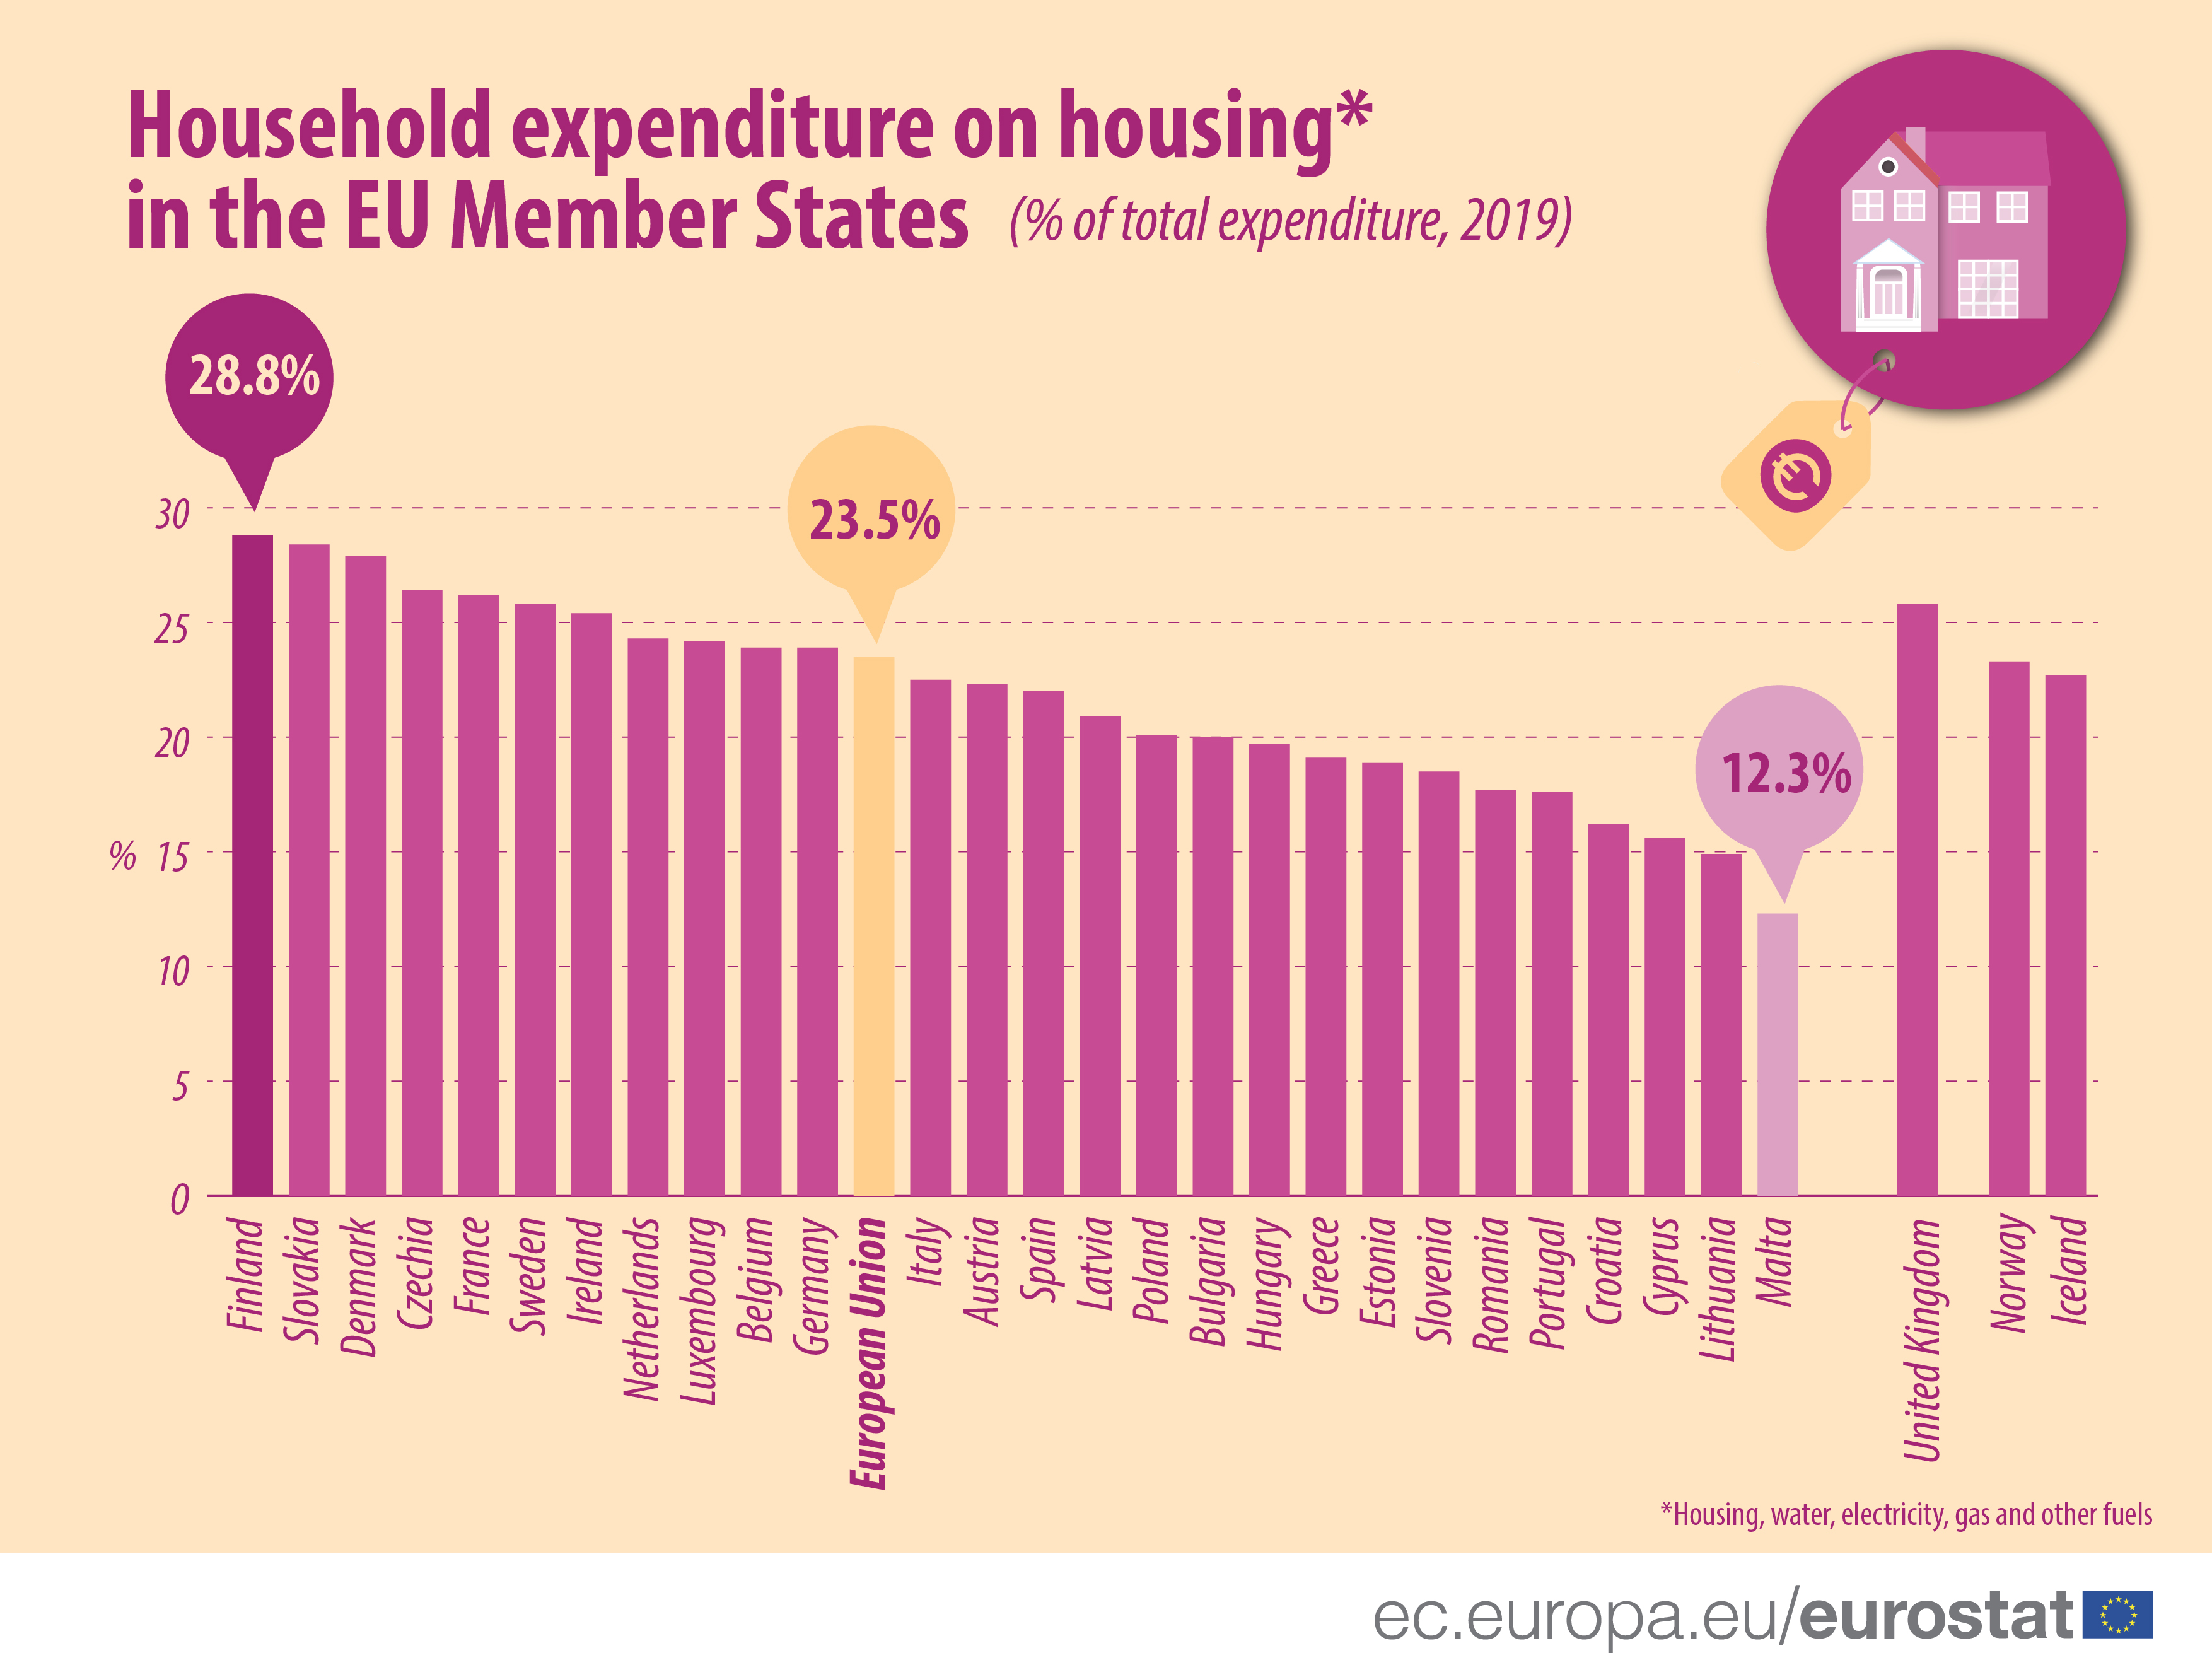
This represents nearly a quarter (23.5%) of their total consumption expenditure and is by far the EU's largest household expenditure item, ahead of ‘Transport’ (13.1%), ‘Food and non-alcoholic beverages’ (13.0%), ‘Restaurants and hotels’ as well as ‘Recreation and culture’ (both 8.7%).
Finland and Slovakia spend highest share of household expenditure on housing, Malta spends least
In the vast majority of EU Member States, ‘Housing, water, electricity, gas and other fuels’ represents the most substantial item of household expenditure.
In 2019, the share of household expenditure devoted to housing was largest in Finland (28.8%), Slovakia (28.4%) and Denmark (27.9%), followed by Czechia (26.4%), France (26.2%), Sweden (25.8%) and Ireland (25.4%).
In contrast, Malta (12.3%), Lithuania (14.9%), Cyprus (15.6%) and Croatia (16.2%) recorded the lowest shares of household expenditure on housing.
Source dataset: nama_10_co3_p3
Romania - highest decrease in housing expenditure, Finland and Ireland the highest increase
Between 2009 and 2019, the share of housing in total household expenditure decreased or remained stable in a majority of the EU Member States. The largest decrease was recorded in Romania (from 25.2% of total household expenditure in 2009 to 17.7% in 2019, or a decrease of 7.5 pp), followed by Poland (-2.6 pp), Cyprus (-2.5 pp), Hungary (-2.3 pp), Latvia (-2.2 pp) and Slovakia (-2.1 pp).
In contrast, this share increased in 11 EU Member States: Ireland (from 22.0% in 2009 to 25.4% in 2019, or a rise of 3.4 pp) and Finland (from 25.4% in 2009 to 28.8% in 2019, or a rise of 3.4 pp as well), ahead of the Netherlands (+2.1 pp), Belgium, Luxembourg and Portugal (all +1.4 pp).
Would you like to know more about household consumption expenditure?
A more complete overview, broken down by consumption purpose, is available in the Statistics Explained article and the interactive infographics.
Would you like to know more about housing in Europe?
To access the latest figures on many different aspects of housing, you can read our new digital publication on Housing in Europe – Statistics visualised.
Notes:
- This article shows the situation before the start of the COVID-19 pandemic, which might impact the 2020 data to be published next year.
- The European Union (EU) includes 27 EU Member States. The United Kingdom left the European Union on 31 January 2020. Further information is published here.
To contact us, please visit our User Support page.
For press queries, please contact our Media Support.