Archive:Youth unemployment
Planned article update: May 2020.
This article explains how youth unemployment in the European Union (EU) and its member states is measured and how youth unemployment rates are affected by the transition of young adults from formal education to the labour market. Two factors are particularly relevant. First, there is a steep rise in participation in the labour market between the ages of 15 and 24. Second, young people in formal education are often also employed or unemployed, so there is an overlap between the labour market and education.
The article focuses on measures of youth unemployment, and is a supplement to a companion article called 'Participation of young people in education and the labour market' which further develops on the interplay between formal education and labour market participation. The latest Eurostat data on youth unemployment can be found here.
Full article
Definition of unemployment and youth unemployment indicators
A person's labour force status falls into one of three categories: employed, unemployed or outside the labour force. Eurostat uses the International Labour Organisation (ILO)'s definitions of employment and unemployment. The labour force, which may also be reffered to as active population, comprises of employed and unemployed persons. These concepts are explained in detail in an article on the EU-LFS methodology. The same definitions apply to young people just as they do to any other age group.
Video 1 shows the population of young persons 15-24 years old divided into three groups based on their labour force status from 2005 to 2018. The video uses figures for each year to represent the number of young people that were employed, unemployed and outside the labour force. As shown in the video, youth unemployment has been decreasing from 5.1 million in 2005 to 4.2 million in 2008. It began to rise again in 2009, before decreasing again since 2013 and reaching a new low of 3.4 million in 2018. Furthermore, the number of young persons outside the labour force in the given years was the highest in 2005 reaching 34.4 million and the lowest in 2018 with 31.4 million.
A video with the evolution at EU level here.
or there.
People are classified as being employed or unemployed irrespective of whether they are in formal education or not. In other words, Eurostat unemployment statistics, in line with ILO standards, do not exclude students from unemployment just because they are students. The same criteria that apply to the rest of the population also apply to them. This means that whether someone is in formal education or not is irrelevant for his/her status regarding employment or unemployment. However, participation in education of the population as a whole has an indirect effect on youth unemployment indicators, as will be shown below.
The main indicator of youth unemployment is the youth unemployment rate for the age group 15-24. This uses the same standard definition as the unemployment rate for the population of working age. For a given age group, it is the number of those unemployed divided by the total number of people in the labour market (employed plus unemployed). In the EU-28 in 2018, there were on average 3.4 million unemployed persons aged 15-24 and 22.4 million persons of that age group in the labour market, according to the EU labour force survey. This gives a youth unemployment rate of 15.2 %.
Given that not every young person is in the labour market, the youth unemployment rate does not reflect the proportion of all young adults who are unemployed. Youth unemployment rates are frequently misinterpreted in this sense. A 25 % youth unemployment rate does not mean that '1 out of 4 young persons is unemployed'. This is a common fallacy. Also, the youth unemployment rate may be high even if the number of unemployed persons is limited. This may be the case when the young labour force (i.e. the rate's denominator) is relatively small. This is not an issue for the unemployment rate of the whole population of working age due to the higher participation of that population in the labour market (x % at ages 15-24, compared to 85 % at ages 25-54, 2018 EU-28 estimates)
Another indicator of youth unemployment published by Eurostat is the youth unemployment ratio. This has the same numerator as the youth unemployment rate, but the denominator is the total population aged 15 to 24. It thus gives an unemployment-to-population measure. The size of the youth labour market (i.e. the size of the young labour force) does not trigger effects in the youth unemployment ratio, contrary to the unemployment rate.
In 2018, in the EU-28 there were 53.9 million persons aged 15-24, of whom 3.4 million were unemployed. This gives a youth unemployment ratio of 6.3 %. Figure 1 shows youth unemployment rates alongside youth unemployment ratios for 2018 for each country. Data is based on the EU labour force survey.
The youth unemployment ratio is by definition always smaller than the youth unemployment rate, typically less than half of it. This difference is entirely due to the different denominators.
Young persons' participation in the labour market
As explained above, unemployment rates and unemployment ratios differ because unemployment rates include only the part of the population that is in the labour market in the denominator. There is also a strong link between labour market participation and educational status, which becomes particularly clear when looking at young people's situation at different ages. This section analyses this issue in more detail.
At 15 years of age, nearly 100 % of the population in the EU and its Member Sates are still at school. As the young grow older, many move into the labour market, becoming employed or unemployed, or remain outside the labour market. Not all young people make this transition at the same age, so there is a gradual rise in the number of the young people on the labour market. Figure 2 below shows the proportion of young people in formal education and/or on the labour market at each year of age (data for EU-28, 2018). The persons in formal education are colour-coded in light blue, and those not in education are colour coded in orange. There is a steep rise in the labour market participation, from some 5 % at age 15 to some 80 % at 24. This steep increase explains the difference between the youth unemployment rates and youth unemployment ratios, introduced in the previous section. This is a distinctive feature of the young population and it has no equivalent at other ages, except for the gentle decrease in labour participation by older workers as they retire. Figure 2 is based on EU labour force survey data and it counts all those who state they have been in formal education or training during the previous four weeks as being in education, and does not include people who participated exclusively in non-formal training sessions such as attending a course, a seminar or taking private lessons.
A second feature in Figure 2 is that many young people join the labour market before they finish their studies or they participate in formal education while already on the labour market. This means that people can be simultaneously in education and on the labour market. (It is noted that participation in the labour market, according to ILO definitions, occurs by working as little as 1 hour in the week, or looking and being available for such work). Otherwise said, those in formal education and those on the labour market are not always different groups as an overlap exists between the two groups. The transition from education to the labour market is not a simple switch of status but a complex overlap of different situations. This is developed further in a separate Statistics Explained article(Participation of young people in education and the labour market
Figure 2 shows that in 2018, in the EU-28 there were 2.5 million young unemployed persons aged 15-24 that were not in education, and 825.5 thousand persons unemployed but in education. There were also many young employed while in education amounting to 7.1 million. As can be seen, there are more young employed in education than young unemployed (whether in education or not).
Picture box 1 below shows the different denominator involved in the calculation of the youth unemployment rate and youth unemployment ratio. It is a visual presentation of the definitions described in Figure 2 above.

![thumb|centre|500px|Figure 1: Youth unemployment rates and ratios (%), 2018Source: Eurostat [https://ec.europa.eu/eurostat/databrowser/view/une_rt_a/default/table?lang=en (une_rt_a)] [https://ec.europa.eu/eurostat/databrowser/view/lfsi_act_a/default/table?lang=en (lfsi_act_a)]](/eurostat/statistics-explained/index.php?title=Figure_1:_Youth_unemployment_rate_ratio,_2018.png&action=edit&redlink=1)
As can be seen, both indicators use the same numerator but the denominators differ. The interplay between education and labour market participation is further developed in a seperate article (Participation of young people in education and the labour market).
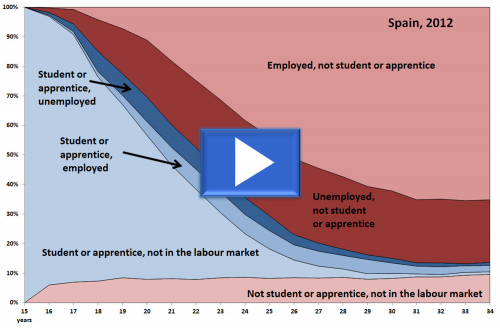 Video 1: Changes in the status of the young population, Spain 2007-2012
Click the image for an interactive view of the data
The effects of the crisis on youth unemployment
Video 2
The video above shows a sequence of charts such as Figure 2 with young persons 15-34 years of age in employment and/or formal education or non of the above in the EU-28. The video covers all years ranging from 2005 to 2018 to capture the changes in the labour force status of the given population prior to the crisis, during and after the crisis. An increase in youth unemployment was one of the outcomes of the economic crisis not only in countries that were severely affected such as Spain and Greece but also EU-28 as a whole. As indicated by the charts, the number of young persons unemployed and not in education reached a highest peak in 2012 and 2013, decreasing considerably in the following years and reaching its lowest point in 2018. The proportion of the population simultanously in education and on the labour market reached the highest point in 2008, gradually decreasing in the following years until increasing again in the last couple of years.
Context
Young people are a priority for European Union’s social vision, and the crisis further highlighted the need to sustain the young human capital. In November 2009, the Council of Youth Ministers adopted the EU Youth Strategy for 2010-2018 which had two overall objectives: to provide more and equal opportunities for young people in education and in the labour market to promote the active citizenship, social inclusion for all young people. Recently, following the Council Resolution of 26 November 2018, the EU Youth Strategy 2019-2027 has been introduced with 11 European Youth Goals among them quality employment set as one of the objectives.
The Open Method of Coordination supports the implementation of the strategy which should create favourable conditions for youth to develop their skills, fulfil their potential, work, and actively participate in society. In this framework youth statistics are an essential tool to support evidence-based policy-making in the various domains covered by the strategy.
Focus on young people has been also highlighted with the adoption of the Europe 2020 strategy back in June 2010. Quality education and training, successful labour market integration and more mobility of young people are key to unleashing all young people's potential and achieving the Europe 2020 objectives. Youth on the Move presents a framework of policy priorities for action at national and EU level to reduce youth unemployment by facilitating the transition from school to work and reducing labour market segmentation. Particular focus is put on the role of public employment services, promoting the Youth Guarantee scheme to ensure all young people are in a job, in education or in activation, creating a European Vacancy Monitor and supporting young entrepreneurs.
Direct access to
- All articles on labour market
- Education and training statistics introduced
- EU labour force survey (online publication)
- Participation of young people in education and the labour market (background article)