Migrant integration statistics - socioeconomic situation of young people
Data extracted on 27 November 2023.
Planned article update: October 2024.
Highlights
The proportions in the EU of young people aged 15-29 years either born outside their country of residence or residing in another country than their country of citizenship were respectively 12.7% and 10.7% in 2022 and followed an upward trend between 2013 and 2022.
In 2022, young non-EU citizens living in the EU were 3 times more often early leavers from education and training and 2 times more exposed to a risk of being neither in employment nor in education or training than young EU citizens living in their own country.
In 2022, young non-EU citizens living in the EU were more than twice exposed to a risk of poverty or social exclusion than young EU citizens living in their own country.
In 2022, the unemployment rate of young non-EU citizens living in the EU was 1.4 times higher than that of young EU citizens living in their own country.
Migration has been an important factor determining the population dynamics in Member States of the European Union (EU), whether migrants coming from elsewhere within the EU or from elsewhere in the world. The flow of migrants has led to a range of skills and talents being introduced into local economies, while also increasing cultural diversity.
This article sheds light on the integration of young foreign-born and young non-nationals through the analysis of socio-economic indicators in the areas of demography, employment, education and social inclusion. Integration of those two groups of youngsters is of utmost importance since they are representing an increasing proportion of the young people residing in the EU, in particular within the context of an ageing EU population. Integration of young foreign-born and young non-nationals in the EU is assessed by comparing selected Zaragoza indicators[1] for young native-born and nationals. The last part of this article shows the main trends and features in terms of integration of young foreign-born and non-nationals over the past ten years.
The main age group covered by this article is the 15-29 years age group, which was considered as a reference in the European Year of Youth 2022 context. However, analysed age groups can vary depending on the specificity of the indicator. For example, specific age group of 18-24 is applied as the standard for the indicator on early leavers from education and training.
Information is presented for various groups of non-nationals or foreign-born persons and compares these with EU citizens living in their own country or native-born persons living in their own country. Non-nationals include EU citizens living in another EU country than their country of citizenship and non-EU citizens residing in the EU. Similarly, foreign-born persons include EU-born persons living in another EU country than their country of birth and non-EU-born persons residing in the EU.
Full article
Demographic trends
Traditionally, two population groups are used in official statistics for analysing migrant integration: non-nationals (i.e., people without the citizenship of their country of residence) and foreign-born (people born outside their country of residence).
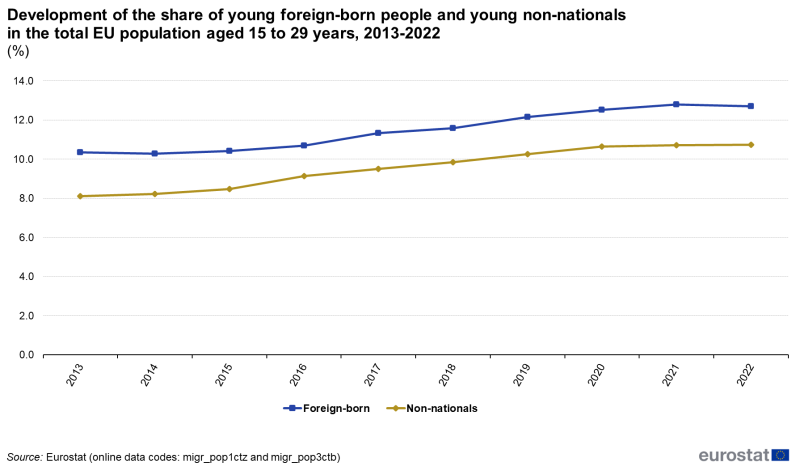
Figur 1 shows the development of the proportion of non-nationals and foreign-born aged 15-29 years in the resident population for the age group in the EU between 2013 and 2022. For both non-nationals and foreign-born, the share of young people followed an upward trend, with an increase over the whole period of 2.6 percentage points (pp) for young non-nationals and 2.4 pp for young foreign-born people. At the beginning of 2022, young non-nationals accounted for 10.7 % of the population aged 15 to 29 years in the EU whereas young foreign-born people represented 12.7 %.
(%)
Source: Eurostat (migr_pop1ctz) and (migr_pop3ctb)
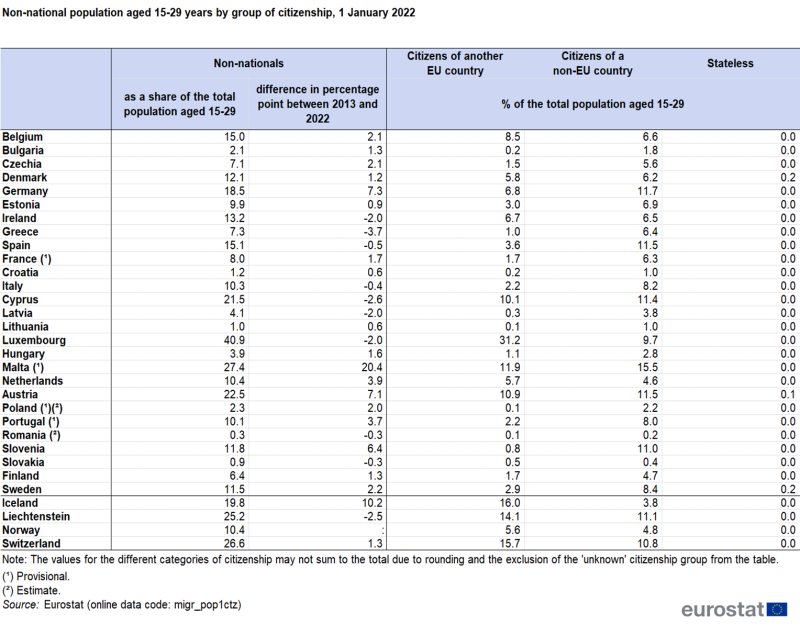
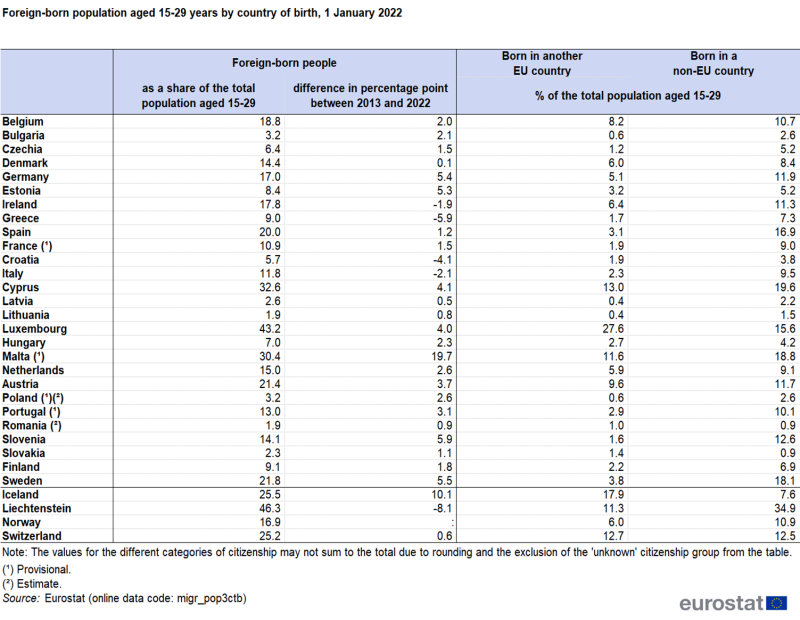
When looking at Tables 1 and 2, the share of young non-nationals and young foreign-born people in 2022 varied greatly from one EU Member State to another. It ranged between 0.3 % (in Romania) and 40.9 % (in Luxembourg) for non-nationals and between 1.9 % (in Romania and Lithuania) and 43.2 % (again in Luxembourg) for foreign-born people.
Source: Eurostat (migr_pop1ctz)
Source: Eurostat (migr_pop3ctb)
Over the 2013-2022 period, the share of young non-nationals increased in 18 EU Member States while the share of young foreign-born people increased in 23 Member States. The highest growth in the share of young non-nationals could be seen in Malta (+20.4 pp), Germany (+7.3 pp), Austria (+7.1 pp) and Slovenia (+6.4 pp). Concerning the share of young foreign-born people, Malta (+19.7 pp) also recorded the highest growth in percentage points (pp) followed by Slovenia (+5.9 pp), Sweden (+5.5 pp), Germany (+5.4 pp) and Estonia (5.3 pp).
Based upon both the proportion of young non-nationals and young foreign-born in the EU population and the recently observed upward trend, assessing their integration in the EU appears to be of particular importance.
Selected indicators of youth integration
The following parts of this article present information on the current and recent development of the socioeconomic status of young people in the EU with an analysis according to their citizenship (citizens of other EU countries, non-EU citizens and nationals). The indicators presented in this section are based on Zaragoza indicators in the areas of employment, education and social inclusion. Six indicators, derived from the annual Labour Force Survey (LFS) and EU-Statistics on Income and Living Conditions (EU-SILC) are analysed in the context of this article:
- the unemployment rate of young people;
- the employment rate of young people;
- the rate of early leavers from education and training;
- the share of young people with a tertiary level of education (ISCED level 5-8);
- the share of young people neither in employment nor in education or training;
- the share of young people at risk of poverty or social exclusion.
Unemployment and employment rates provide information on possible labour market disadvantages for some young non-nationals. The unemployment rate only concerns those young people aged 15 to 29 years who are already in the labour market, excluding those who are still attending school or higher education. The employment rate gives the share of the population aged 25 to 29 years who are working.
Education has the potential to increase employment opportunities and social inclusion for individuals through the acquisition of basic skills and common values shared within society. Early leavers from education and training are defined as people aged 18-24 years having attained, at most, lower secondary education and not involved in further education or training. This indicator provides an insight on the share of young non-nationals who start their professional life with a low educational background. Conversely, the share of those aged 25 to 34 years with a tertiary level indicates the proportion of young non-nationals with a high educational background.
The indicator of young people not in employment, education or training corresponds to the proportion of the population aged 15-29 years who were not employed and not involved in further education or training and thus shows the share of young non-nationals that are not included in society through either employment or education. It should be noted that this indicator differs from the unemployment rate since not all the young people covered by this indicator are recorded as unemployed. Lastly, the indicator concerning at risk of poverty or social exclusion is a composite measure with three subcomponents: the at-risk-of-poverty, severe material and social deprivation, and households with very low work intensity. The at-risk-of-poverty or social exclusion rate measures the number of people who are in at least one of the three situations as a proportion of the young non-national population aged 16 to 29 years.
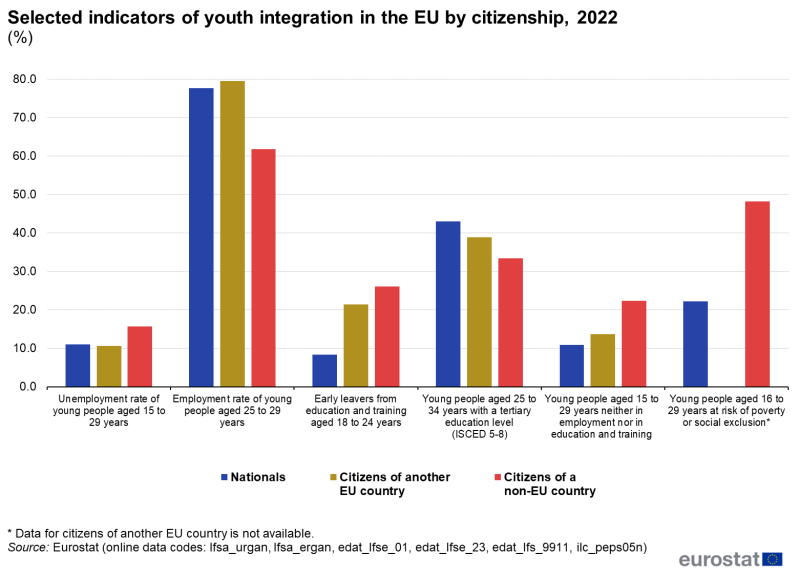
In Figure 2, the values of these six indicators are presented for the three main groups of citizenships considered in this article: citizens of another EU country, citizens of a non-EU country and nationals. Nationals are defined as the people having the citizenship of the country in which they reside. Data related to the at-risk-of-poverty or social exclusion rate is not available for citizens of another EU country. For four of the chosen indicators (unemployment rate, early leavers from education and training, young people neither in employment nor in training and young people at risk of poverty or social exclusion) the higher the value of the indicator, the lower the integration of the considered population group. On the contrary, for the employment rate and tertiary education attainment, the higher the value of the indicator, the higher the level of integration. All six indicators in Figure 2 show the same pattern: young non-EU citizens are less integrated than young citizens of another EU country.
(%)
Source: Eurostat (lfsa_urgan) and (lfsa_ergan) and (edat_lfse_01) and (edat_lfse_23) and (edat_lfs_9911) and (ilc_peps05n)
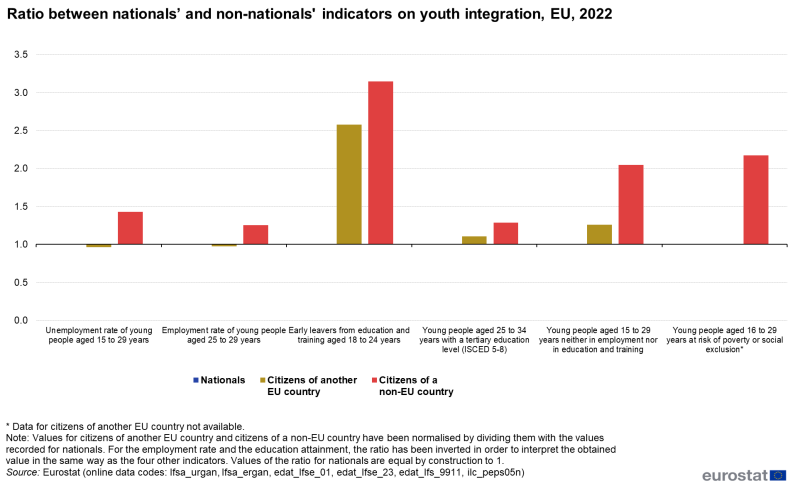
To see the indicators for which the integration gap is greatest, values for citizens of another EU country and citizens of a non-EU country have been normalised by dividing them with the values recorded for nationals. For the employment rate and education attainment, the ratio has been inverted to interpret the obtained value in the same way as the four other indicators. Results are presented in Figure 3, where values of the ratio for nationals are equal by construction to 1.
In 2022, young non-EU citizens were early leavers from education and training 3.1 times more often than nationals, which represented the main integration gap. For social inclusion indicators, non-EU citizens were more than twice (2.2) exposed to a risk of poverty or social exclusion than nationals and twice more exposed to a risk of being neither in employment nor in education or training. The unemployment rate of non-EU citizens was 1.4 times higher than that of nationals, whereas the lowest integration gaps (1.3) were observed for employment rate and tertiary education level attainment.
The integration gaps for young citizens of another EU country were lower than those for non-EU citizens for all six indicators in 2022. Tertiary educational attainment level, employment and unemployment rates of EU citizens residing abroad were almost the same as for nationals, whereas they had a risk 1.3 times higher than nationals of being neither in employment nor in education or training. The main observable integration gap for citizens of another EU country was recorded for early leavers of education and training (2.6), whereas data on being at risk of poverty or social exclusion was not available for EU citizens residing abroad.
Source: Eurostat (lfsa_urgan) and (lfsa_ergan) and (edat_lfse_01) and (edat_lfse_23) and (edat_lfs_9911) and (ilc_peps05n)
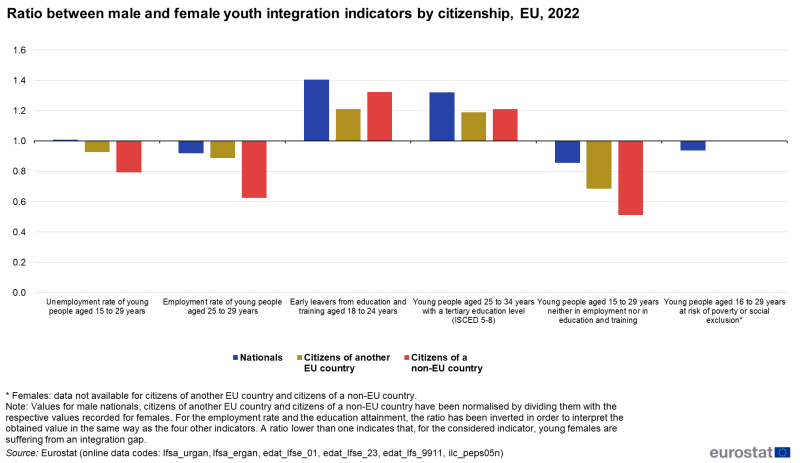
Figure 4 presents the same ratios of integration between young males and females by main groups of citizenship. For each indicator, the level for young males is compared with the one of females. A ratio lower than one indicates for the considered indicator that young females are suffering from an integration gap.
In 2022, the gender gap was favourable to young females for all groups of citizenship only in the field of education. For all other available indicators, the gender gap was favourable to young males, except for unemployment rate of young national females with a ratio slightly higher than 1.
Source: Eurostat (lfsa_urgan) and (lfsa_ergan) and (edat_lfse_01) and (edat_lfse_23) and (edat_lfs_9911) and (ilc_peps05n)
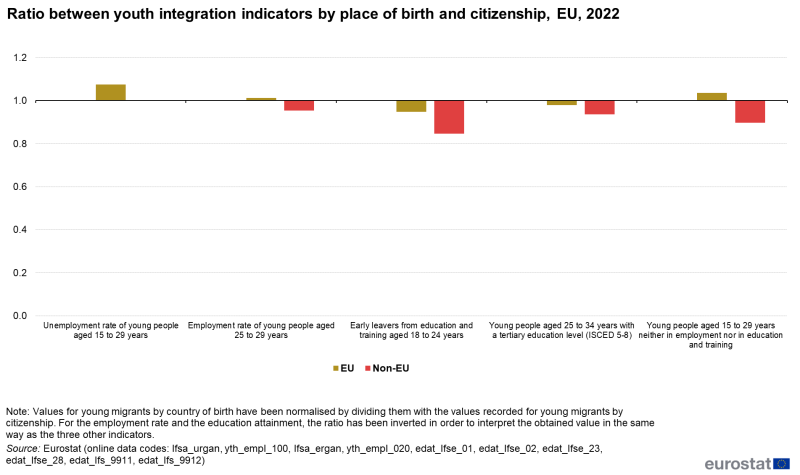
Figure 5 contrasts the integration of young people by country of birth and of young people by country of citizenship. A ratio lower than one indicates that young people who do not have the citizenship of their country of residence are suffering more from an integration gap in comparison with young foreign-born people. Since data is not available for the indicator at risk of poverty or social exclusion, only five indicators are included in Figure 5.
For four indicators, young third-country nationals were suffering from an integration gap higher in comparison with young people born outside the EU in 2022. Only the unemployment rates were identical for both populations. The difference between young citizens of another EU country and young persons born in another EU country was less pronounced with a lower unemployment rate, a higher employment rate and a lower risk to be neither in employment nor in education or training.
Source: Eurostat (lfsa_urgan) and (yth_empl_100) and (lfsa_ergan) and (yth_empl_020) and (edat_lfse_01) and (edat_lfse_02) and (edat_lfse_23) and (edat_lfse_28) and (edat_lfs_9911) and (edat_lfs_9912)
Education
Education has the potential to increase employment opportunities and social inclusion for individuals, through the acquisition of basic skills and common values shared within society.
Early leavers from education and training
Early leavers from education and training are defined as people aged 18-24 years having attained at most lower secondary education and not involved in further education or training.
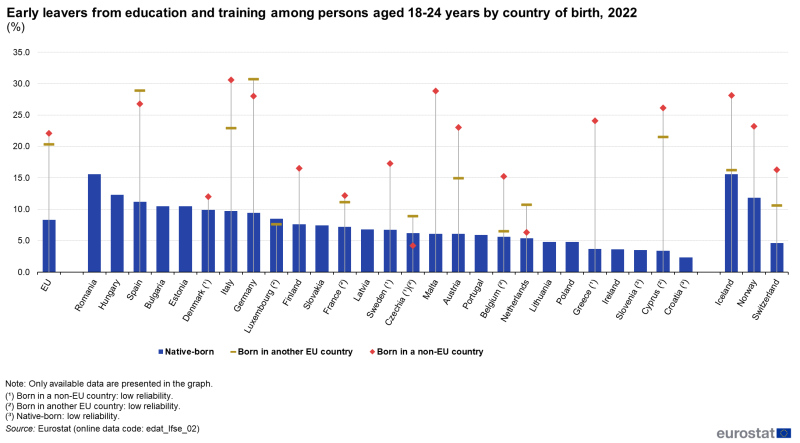
Figure 6 shows that in 2022 the proportion of young foreign-born people (both born in another EU country and born in a non-EU country) in this situation was higher than young native-born people both in the EU and in most EU countries. In 2022, less than one tenth (8.3 %) of young native-born people were early leavers in the EU, while for young foreign-born the share was more than twice as high (20.3 % for born in another EU country and 22.1 % for non-EU-born). Among the EU countries for which the data was available and reliable, the largest differences over of 20 pp between early leavers' shares for native-born and non-EU-born were recorded in three EU countries (Cyprus, Malta and Italy). Germany, Austria and Spain also reported differences of 10.0 pp or more. Turning to the comparison between young native-born early leavers with their counterparts born in another EU country, the largest differences over 10.0 pp were observed in three EU countries with reliable data (Germany, Spain and Italy).
(%)
Source: Eurostat (edat_lfse_02)
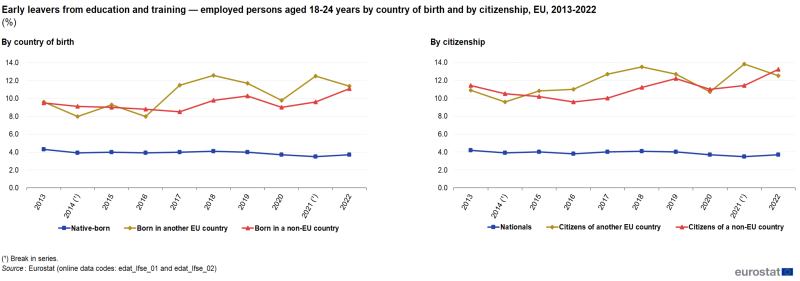
Figure 7 shows for the EU as a whole the development from 2013 to 2022 of the proportion of early leavers from education and training who were employed by country of birth and by citizenship. Both the proportions of young people born in other EU countries and non-EU countries as well as young citizens of other EU countries and non-EU countries increased, whereas the proportion decreased for nationals and native-born.
The development pattern was somewhat irregular for the proportion of employed early leavers born in other EU Member States, initially falling at a relatively fast pace up until 2014, after which there was an increase in 2015 and again a decrease in 2016; in 2017 and 2018 there were two successive increases before other falls observed in 2019 and 2020. The development in 2021 shows the share increasing again whereas in 2022 the decrease is observed. A rather similar pattern was observed for employed early leavers having the citizenship of another EU Member State.
(%)
Source: Eurostat (edat_lfse_01) and (edat_lfse_02)
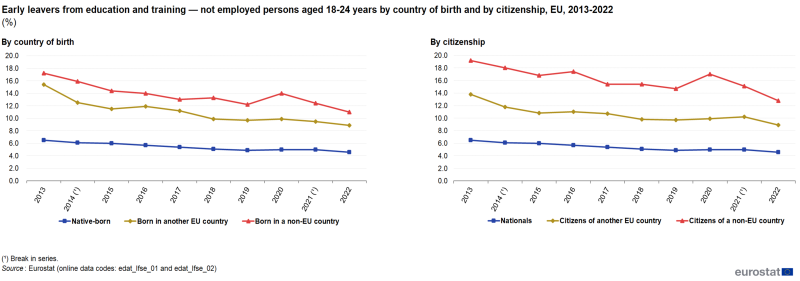
The proportion of early leavers from education and training who were not employed (therefore either unemployed or economically inactive) followed a different development to that observed among early leavers who were employed (compare the developments in Figures 7 and 8).
Between 2013 and 2022 the share of not employed early leavers among young people born outside the EU recorded a decrease of 6.2 pp, while the decrease observed for young non-EU citizens accounted for 6.4 pp. Looking at the time series presented in Figure 8, the share of not employed early leavers among young persons born in another EU country and young citizens of another EU country reached a peak in 2013 and then it started falling till 2019. In 2020, the shares of all young populations increased while the development in 2021 and 2022 shows again a decrease.
(%)
Source: Eurostat (edat_lfse_01) and (edat_lfse_02)
Young people aged 25 to 34 years with a tertiary education level
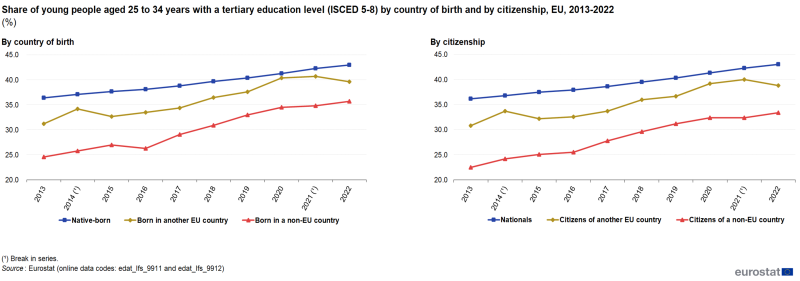
Figure 9 shows that the shares of young persons born in other EU countries and young non-EU-born people aged 25 to 34 years with a tertiary education level were always lower than their native-born counterparts. The same pattern can be observed when looking at the alternative analysis by citizenship. Between 2013 and 2022 the share of young people aged 25 to 34 years with a tertiary education level grew regardless of the analysed population group. The largest increase of 11.1 pp was observed for young non-EU-born people – from 24.6 % in 2013 to 35.7 % in 2022.
(%)
Source: Eurostat (edat_lfs_9911) and (edat_lfs_9912)
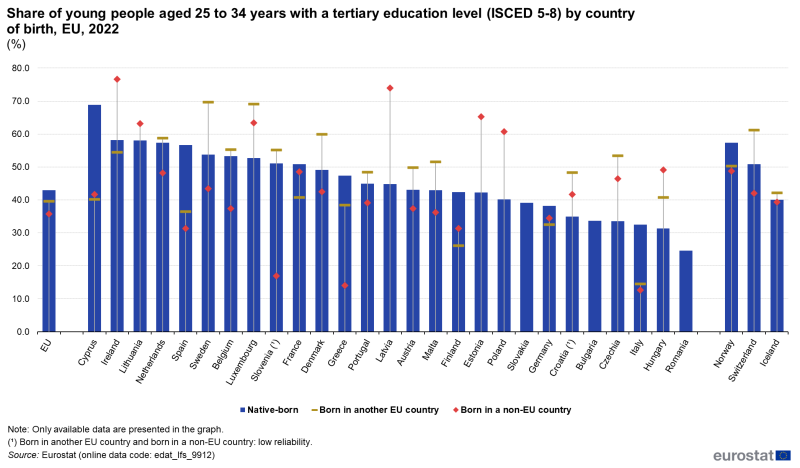
Among the Member States, for which data are available and reliable, in Cyprus, Spain, Italy, Finland and France, the proportions of highly educated young persons born in other EU countries were 10 pp or more lower than the proportions of young native-born persons. By contrast, in four Member States, the proportion of tertiary educated young persons born in another EU country was at least 10 pp higher than young native-born (Czechia, Luxembourg, Sweden and Denmark).
Turning to the comparison between young native-born and young non-EU-born persons (for which the data for 22 EU Member States were available and reliable), the proportions of highly educated young non-EU-born persons were 10 pp or more lower than the proportions of young native-born persons in seven EU Member States, with the largest gap of 33.4 pp observed in Greece. By contrast, both the proportions of young people born in other EU countries and non-EU countries as well as young citizens of other EU countries and non-EU countries increased, whereas the proportion decreased for nationals and native-born, the share of tertiary educated young non-EU-born persons was at least 10 pp higher also in seven Member States, with the largest difference of 29.2 pp observed in Latvia.
(%)
Source: Eurostat (edat_lfs_9912)
Employment and unemployment
Youth employment rate
Figure 11 shows that the employment rate at the EU level of young persons born in other EU countries was higher than that of young native-born for all the years, whereas the employment rate of young non-EU-born people was lower than the young native-born people till 2021. In 2022 the rate observed for non-EU born was higher than the rate observed for their native-born counterparts. For all groups of countries of birth, the curves were developing in a similar way and were following an upward trend. The negative impact in 2020 of the beginning of the coronavirus pandemic can also be pointed out. The gap between employment rate of young non-EU-born and native-born decreased from 7.7 pp to 0.8 pp between 2013 and 2021 with an employment rate of young native-born eventually being 1.2 pp lower than the one of non-EU-born in 2022. lower than the one of non-EU-born in 2022. Simultaneously, the gap between non-EU-born and those born in other EU countries diminished by 5.9 pp and was equal to 6.3 pp in 2022. Concerning the positive gap between young persons born in other EU countries and native-born, it widened between 2013 and 2022 from a difference of 4.5 pp in 2013 to 7.5 pp in 2022.
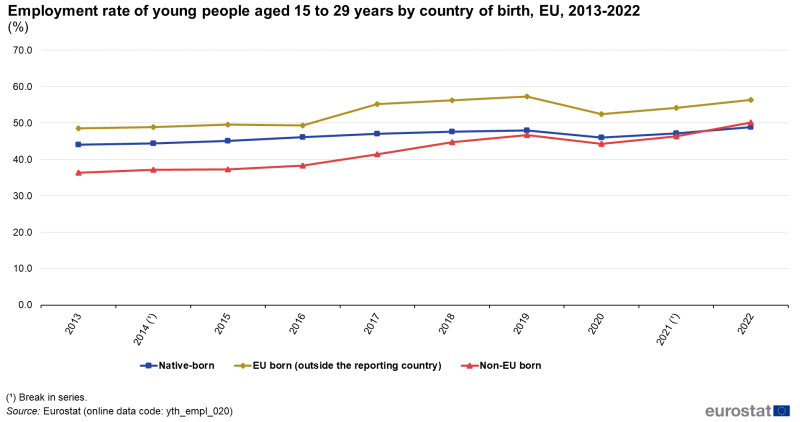
(%)
Source: Eurostat (yth_empl_020)
In 2022, across the EU countries with reliable data (Figure 12), the employment rate for young non-EU-born persons was lower than the one for young persons born in other EU countries in most Member States except in Greece, Italy, Malta, France, Finland and Hungary. It can also be noticed that the employment rate of young persons born in other EU countries was lower than the one of native-born in Member States with either a high employment rate of native-born (the Netherlands, Austria, Germany) or in Belgium, Sweden, Finland and France. Lastly, the employment rate of non-EU-born was higher than the one of native-born in 13 EU countries, whereas in Finland the rates were the same.
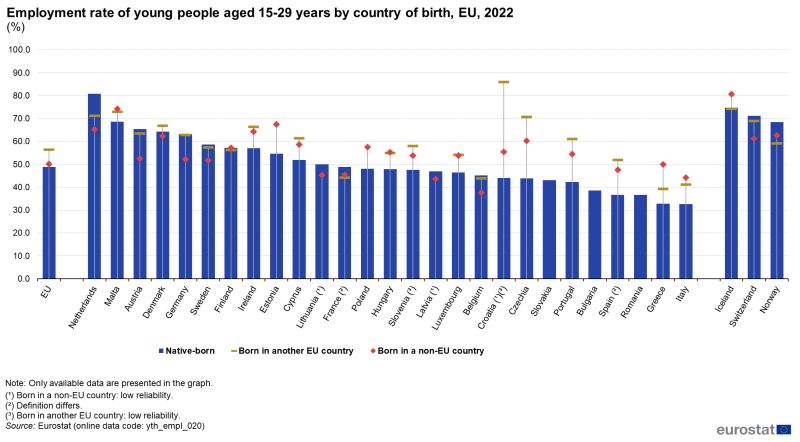
(%)
Source: Eurostat (yth_empl_020)
Considering five-year age groups among the 15-29 years (Figure 13), in 2022 people across the EU aged 25-29 years had the highest employment rates among all young people, regardless of their place of birth or their citizenship, whereas people aged 20-24 years had higher employment rates than people aged 15-19 years, still regardless of their place of birth. This pattern reflects the progressive entrance of youngsters into the labour market after finishing their studies. For all the three considered age groups, the employment rate of non-EU-born was lower than the one of young native-born and young persons born in other EU countries with the gap increasing with the age group. The same pattern is observed for young non-EU citizens in comparison with young nationals and young citizens of another EU country.
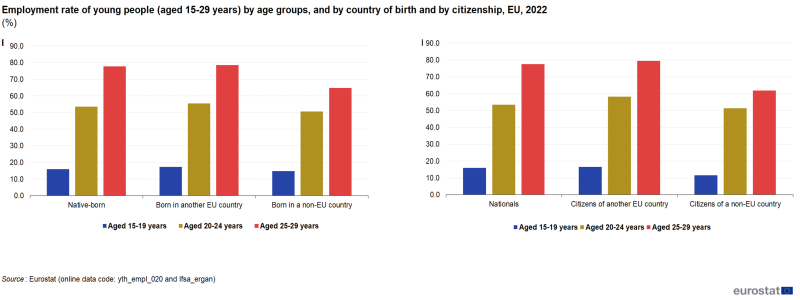
(%)
Source: Eurostat (yth_empl_020) and (lfsa_ergan)
Unemployment rate among young people
Labour market disadvantages for young people who are non-EU-born or non-EU citizens can also be visible when unemployment rates are analysed.
Figure 14 shows for the EU as a whole the development from 2013 to 2022 of unemployment rate by country of birth and by citizenship. The unemployment rate of young non-EU-born and non-EU citizens was always higher than the respective rate for young native-born and young nationals as well as young persons born in another EU country and young citizens of another EU country.
For all the considered groups of countries of birth and of citizenship, the curves were developing in a similar way and were following a downward trend. The impact in 2020 of the beginning of the coronavirus pandemic can also be noticed. The gap between the employment rate of young non-EU-born and native-born decreased by 10.7 pp between 2013 and 2022, while the gap between the employment rate of young non-EU citizens and nationals dropped by 8.0 pp. As a result, the unemployment rate for non-EU citizens was higher or equal than that of non-EU-born from 2017 onwards. Lastly, the gap between native-born and persons born in other EU countries progressively disappeared between 2013 and 2022, whereas the gap between nationals and citizens of another EU country has remained narrow through the same time period.
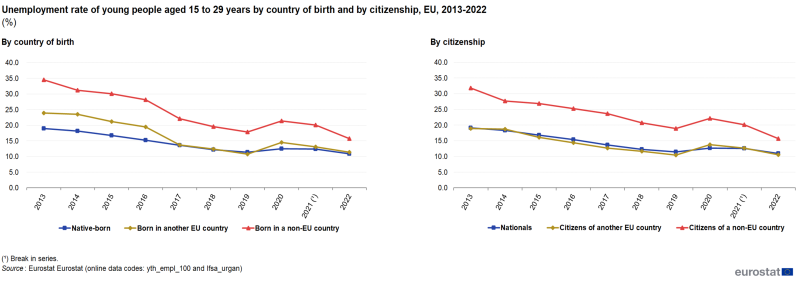
(%)
Source: Eurostat (yth_empl_100) and (lfsa_urgan)
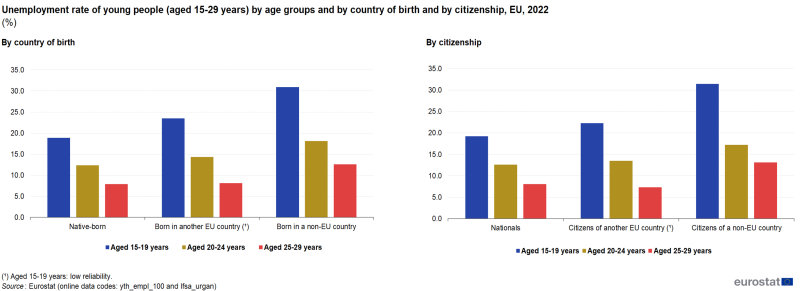
Figure 15 compares unemployment rates for five-year age groups among the 15-29 years by country of birth and by citizenship in 2022. People across the EU aged 15-19 years had the highest unemployment rates among all young people, regardless of their place of birth or their citizenship, whereas people aged 20-24 years had higher unemployment rates than people aged 25-29 years, still regardless of their place of birth. For all the three considered age groups, the unemployment rate of non-EU-born is higher than the one of native-born and persons born in other EU countries. The same pattern is observed for non-EU citizens in comparison with nationals and citizens of another EU country, but recorded unemployment rates for non-EU citizens were always slightly higher than the non-EU-born. Young persons born in another EU country and young citizens of another EU country had in 2022 a higher unemployment rate than native-born and nationals for all the age groups, especially the 15-19 years age group.
(%)
Source: Eurostat (yth_empl_100) and (lfsa_urgan)
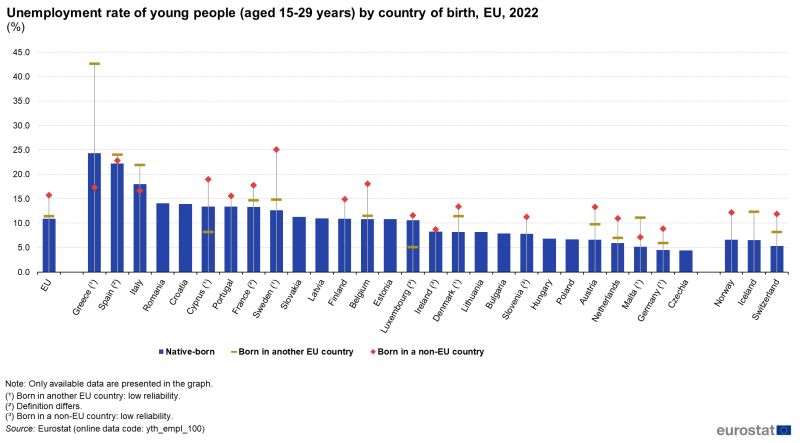
Across the Member States with available and reliable data in 2022 (Figure 16), the unemployment rate for non-EU-born was higher than that of native-born in all the Member States except in Italy and Greece, and higher than that of young persons born in other EU countries in all the Member States except in Spain and Italy. It can also be noticed that a lower unemployment rate of young persons born in other EU countries in comparison with native-born is only observed in Luxembourg.
(%)
Source: Eurostat (yth_empl_100)
Temporary employment of young people
Temporary employment can be considered either as an opportunity for labour market participation (in particular internships during studies) or as a trap into underemployment.
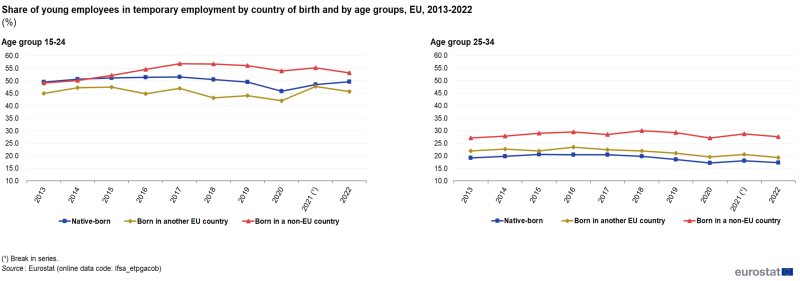
Figure 17 presents the development from 2013 to 2022 of the shares of young employees in temporary employment by country of birth in the EU for two age groups: 15-24 years and 25-34 years. For the age group 15-24 years, the share of non-EU-born employees in temporary employment was almost always higher than the ones for native-born and always higher than the shares for young persons born in other EU countries. The same pattern, with the more pronounced gaps, can be observed for the age group 25-34 years. Concerning young persons born in other EU countries in temporary employment aged 15-24 years, their share was always lower than the one for native-born, while for the age group 25-34 years, it is the contrary. This finding tends to indicate that during the period of schooling (15-24 years), young persons born in other EU countries are benefiting less from the possibility of temporary employment whereas during the beginning of their working life (25-34 years), they are suffering more from the precarity of temporary employment than their native-born counterparts.
(%)
Source: Eurostat (lfsa_etpgacob)
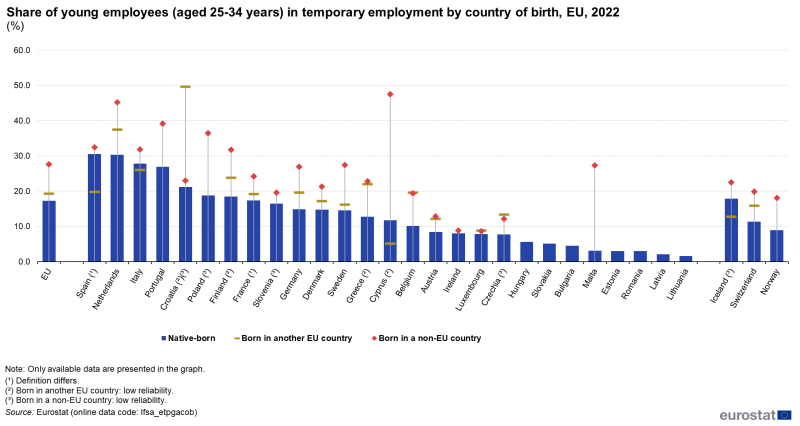
Figure 18 shows the share of young employees (aged 25-34 years) in temporary employment by country of birth in the EU and EFTA countries in 2022. The share of non-EU-born employees aged 25-34 years in temporary employment was higher than the one of native-born in all the Member States with reliable data. The share of non-EU-born employees in temporary employment was higher than the one of persons born in other EU countries in all the countries except Belgium and Luxembourg. Lastly, one can point out the lower share of employees in temporary employment born in other EU countries in comparison with native-born in two Member States (Spain and Italy) where the share of native-born aged 25-34 years in temporary employment is amongst the highest in the EU.
(%)
Source: Eurostat (lfsa_etpgacob)
Part-time employment of young people
Similar to temporary employment, part-time employment can be considered either as an opportunity for labour market participation or as a trap into underemployment.
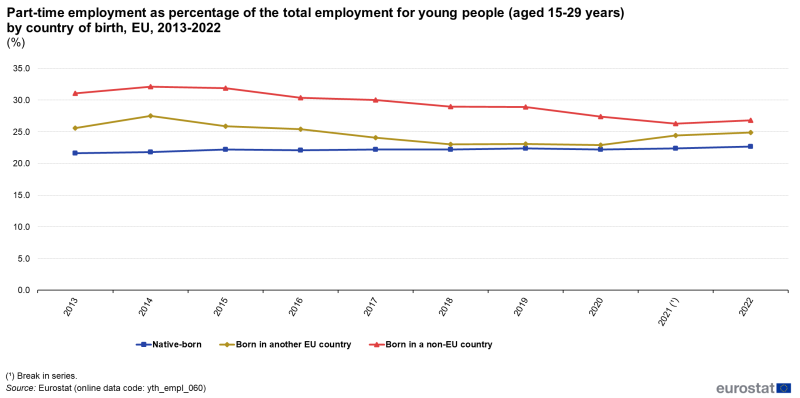
When looking at Figure 19, the share of young non-EU-born employees in part-time employment was higher than the ones of young persons born in other EU countries and young native-born over the analysed period (2013-2022), while the share of young persons born in other EU countries was higher than the one of native-born. The development for young non-EU-born and at a lesser extent for persons born in other EU countries followed a downward trend, whereas the share of young native-born in temporary employment slightly increased between 2013 and 2022. As a result, the gap between non-EU-born and native-born decreased by 5.4 pp between 2013 and 2022 while the gap between persons born in other EU countries and native-born diminished by 1.8 pp.
(%)
Source: Eurostat (yth_empl_060)
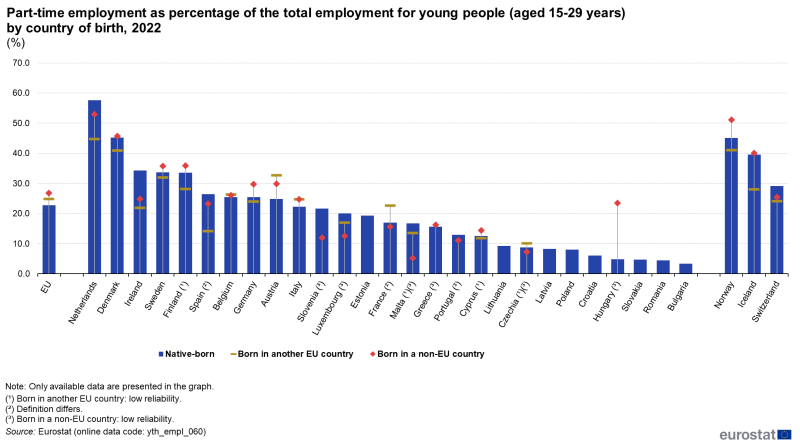
Figure 20 shows the share of young employees (aged 15-29 years) in part-time employment by country of birth in 2022. Among the Member States with reliable data, the share of non-EU-born employees aged 15-29 years in part-time employment was lower than the one for native-born in France, Spain, the Netherlands and Ireland. The share of non-EU-born employees in part-time employment was lower than the one for persons born in other EU countries in three Member States (Austria, Belgium and France), whereas in Italy the shares were identical. Lastly, one can point out the lower share of employees in part-time employment born in other EU countries in comparison with native-born in seven Member States.
(%)
Source: Eurostat (yth_empl_060)
Social inclusion
Young people not in employment, education or training
The indicator of young people not in employment, education or training corresponds to the proportion of the population aged 15-29 years who were not employed and not involved in further education or training.
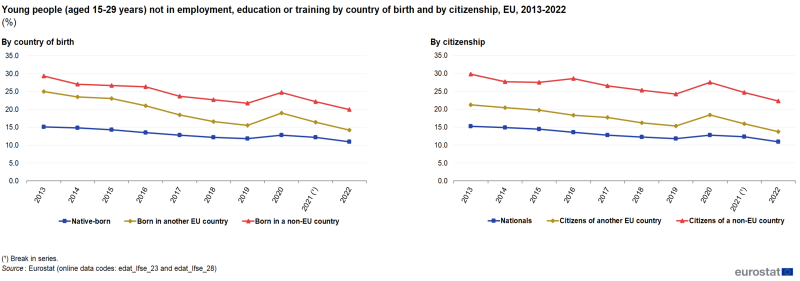
The various groups shown in Figure 21 all recorded decreases in the proportion of young people who were not in employment, education or training between 2013 and 2022. The decline was strongest for young people born in other EU Member States, down from a peak of 25.0 % in 2013 to 14.2 % in 2022. For young native-born people the decrease was equal to 4.2 pp, whereas for young non-EU-born the proportion was 9.3 pp lower at the end of the period. The impact in 2020 of the beginning of the coronavirus pandemic can also be noticed. In 2020, the shares for all subpopulations increased to fall again in 2021 and 2022. A similar pattern was observed for young non-EU citizens who were not in employment, education or training, but their proportion was constantly higher than the one of non-EU-born.
(%)
Source: Eurostat (edat_lfse_23) and (edat_lfse_28)
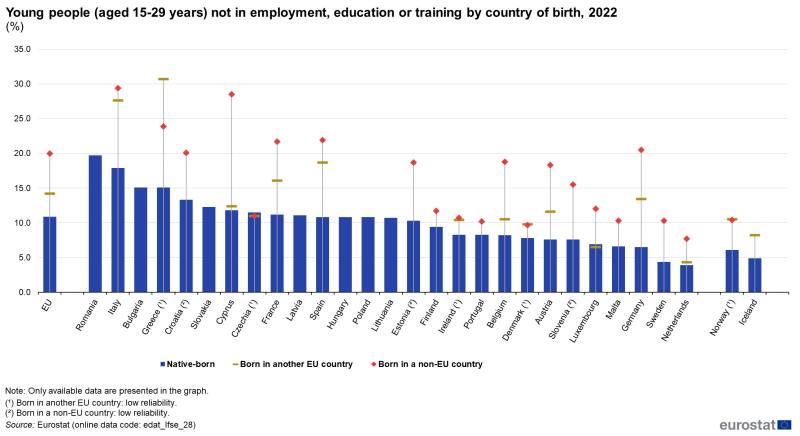
In 2022, in eight out of nine Member States with reliable data, a higher proportion of young people who were not in employment, education or training was recorded for young people born in other EU Member States in comparison with young native-born, the only exception was Luxembourg where lower share was observed for young people born in other EU Member States. The largest differences (over 5 pp) between these two subpopulations were observed in Italy and Spain. Turning to the comparison between native-born with non-EU-born young people who were not in employment, education or training, the integration gaps were more pronounced. The differences in shares of over 10 pp were observed in seven EU Member States; only in Czechia the situation was opposite.
(%)
Source: Eurostat (edat_lfse_28)
At-risk-of-poverty or social exclusion rate for young people
The indicator concerning at risk of poverty or social exclusion is a composite measure with three subcomponents: the at-risk-of-poverty rate, severe material and social deprivation and households with very low work intensity. The at-risk-of-poverty or social exclusion rate measures the number of persons who are in at least one of the three situations as a proportion of the total population.
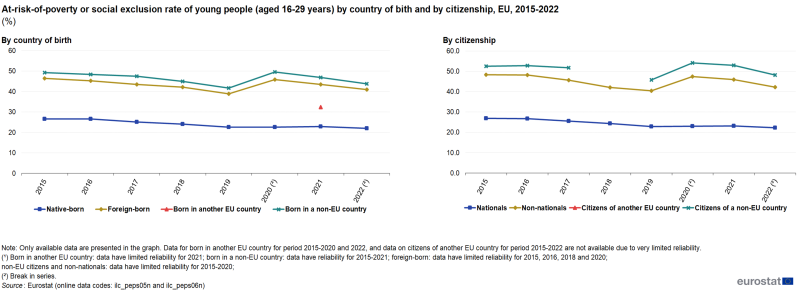
Figure 23 shows the development of risk of poverty or social exclusion for young people in the EU by country of birth or their citizenship. Because of data availability, the time series starts only in 2015 rather than in 2013. Moreover, the data for young people born in another Member State (except 2021) and young citizens of another EU country are not available as they are of very limited reliability.
The shares of young native-born and foreign-born as well as young nationals and non-nationals aged 16 to 29 years at risk of poverty or social exclusion declined steadily and considerably between 2015 and 2019 following a very similar pattern. In 2020, the share observed for young foreign-born persons / non-nationals grew leading to divergence and a significant gap with young native-born persons / young non-nationals. In the case of non-EU-born and citizens of non-EU countries, the dynamic of the gap was even more pronounced. These shares, however, rebounded to some extent in 2021 and 2022.
(%)
Source: Eurostat (ilc_peps05n) and (ilc_peps06n)
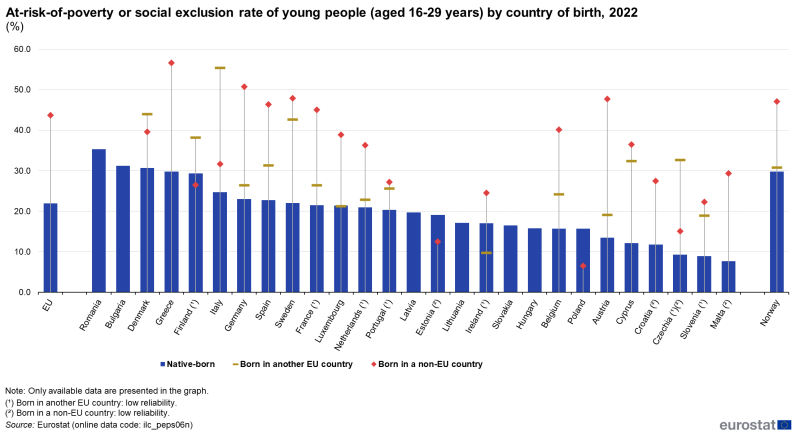
In nine out of ten Member States for which data were available and reliable, young people born in other EU countries were at higher risk of being poor or socially excluded than their young native-born counterparts. The proportion of young people born in other EU countries exceeded the proportion of young native-born by 20 pp or more in three Member States (Italy, Sweden and Cyprus). Only in Luxembourg — the risk of poverty or social exclusion among young people born in other EU countries was lower than among young native-born.
If non-EU-born young persons are considered, the gaps were larger. In 15 Member States (among 17 for which data was available and reliable), the proportion of non-EU-born young persons at risk exceeded the proportion of young native-born persons by 10 pp or more. The largest gap was observed in Austria (34.2 pp). The risk of poverty or social exclusion among young non-EU-born persons was lower than among young native-born persons in Finland and Poland.
(%)
Source: Eurostat (ilc_peps06n)
Source data for tables and graphs
Data sources
Demographic indicators
The data presented in this article are drawn from Eurostat's population statistics that are collected on an annual basis and are supplied to Eurostat by the national statistical authorities of the EU Member States and EFTA countries.
Socio-economic indicators
The main part of the article uses labour force statistics (LFS) data and statistics on income and living conditions (EU-SILC) to examine the socioeconomic situation of young non-citizens and young foreign-born.
- Labour force statistics
LFS provides estimates for the main labour market indicators, such as employment rate, unemployment rate, part-time and temporary employment rate, and other labour-related indicators, as well as important sociodemographic characteristics, such as sex, age, highest level of educational attainment, household characteristics and region of residence.
Note for Spain and France (labour-related indicators)
Spain and France have assessed respondents' attachment to their job and included in employment those who, in their reference week, had an unknown duration of absence but expected to return to the same job once health measures allow it.
- Statistics on income and living conditions
EU-SILC is the main European source for information relating to income, living conditions and social inclusion such as the share of the population at risk of poverty or social exclusion or the share of population suffering from material deprivation.
Context
The indicators presented in this article are based on the Council conclusions on integration of 2010, the subsequent study Indicators of immigrant integration — a pilot study (2011) and the report Using EU indicators of immigrant integration (2013).
There is a strong link between integration and migration policies, since successful integration is often seen as a prerequisite for maximising the economic and social benefits of immigration for individuals as well as societies. EU legislation provides a common legal framework regarding the conditions of entry and stay and a common set of rights for certain categories of migrants. EU policy covers the fight against poverty and social exclusion among society's vulnerable groups with the goal of active social inclusion and in accordance with the integration of migrants.
The active inclusion strategy of the EU also includes ensuring a decent standard of living for young migrants in the labour market. EU Member States are encouraged to design, promote and implement an integrated comprehensive strategy for the active inclusion of young persons.
In November 2020, an Action plan on Integration and Inclusion 2021-2027 (COM(2016) 377 final) was adopted with the purpose of fostering social cohesion and building inclusive societies for all. Inclusion for all is about ensuring that all policies are accessible to and work for everyone, including migrants and EU citizens with migrant background. This plan includes actions in four sectoral areas (education and training, employment and skills, health and housing) as well as actions supporting effective integration and inclusion in all sectoral areas at the EU, Member State and regional level, with a specific attention paid to young people.
In addition to the Action Plan on Integration and Inclusion, young people are a priority for the European Union's social vision, and the COVID-19 crisis further highlighted the need to sustain young human capital.
Following the Council Resolution of 26 November 2018, the EU Youth Strategy 2019-2027 has been introduced with 11 European Youth Goals and among them quality employment is set as one of the objectives. It should create favourable conditions for young people to develop their skills, fulfil their potential, work, and actively participate in society. In this framework youth statistics are an essential tool to support evidence-based policy-making in the various domains covered by the strategy.
Focus on young people is also highlighted in the European Pillar of Social Rights, which sets out 20 key principles and rights essential for fair and well-functioning labour markets and social protection systems. Principle 4 ('Active support to employment') states that "young people have the right to continued education, apprenticeship, traineeship or a job offer of good standing within four months of becoming unemployed or leaving education".
In October 2020, all EU countries committed to the implementation of the reinforced Youth Guarantee in a Council Recommendation which steps up the comprehensive job support available to young people across the EU and makes it more targeted and inclusive.
2022 was announced as the European Year of Youth. Further information regarding statistics on youth could be found here.
Direct access to
Theme entry page
Online publications
Statistical articles
- Population (national level) (ESMS metadata file — demo_pop_esms)
- LFS series — Detailed annual survey results (ESMS metadata file — lfsa_esms)
- Statistics on income and living conditions
Notes
- ↑ A set of common indicators agreed by EU Member States in the Zaragoza Declaration in 2010.