Archive:Urban Europe — statistics on cities, towns and suburbs — smart cities
Data extracted in February–April 2016
Highlights
In 2012, among the share of people aged 25–64 in the EU with a tertiary level of education, more than one third (35.5 %) lived in cities compared with less than one fifth (19.3 %) in rural areas.
Across the EU, four out of every five (81 %) persons living in cities used the internet on a regular basis in 2015, some 12 percentage points higher than the average for rural areas.
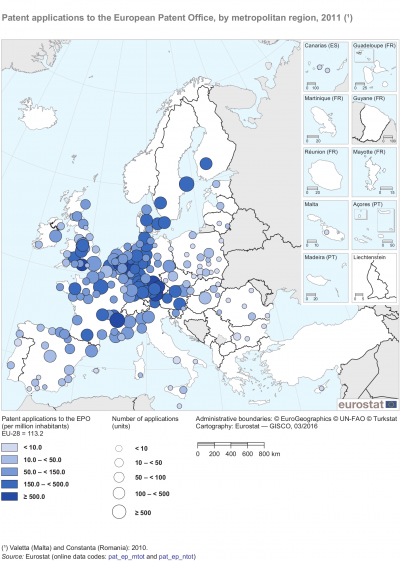
(per million inhabitants)
Source: Eurostat (pat_ep_mtot) and (pat_ep_ntot)
This chapter is part of an online publication that is based on Eurostat’s flagship publication Urban Europe — statistics on cities, towns and suburbs (which also exists as a PDF).
Definitions of territorial units
The various territorial units that are presented within Urban Europe — statistics on cities, towns and suburbs are described in more detail within the introduction. Readers are encouraged to read this carefully in order to help their understanding and interpretation of the data presented in the remainder of the publication.
Full article
Smart cities
The opening chapters have already demonstrated that the on-going process of urbanisation has resulted in the size and relative importance of cities across the European Union (EU) increasing. This pattern is particularly true for capitals and other large cities that often act as hubs for education, employment, innovation and the knowledge-based economy. Some of these European cities are at the forefront of technological and sustainable development initiatives that are transforming urban life; this chapter analyses some of the aspects related to the development of so-called ‘smart cities’, while the chapter that follows concentrates on ‘green cities’.
What makes a smart city?
For policy purposes, the EU defines a smart city as ‘a place where traditional networks and services are made more efficient with the use of digital and telecommunication technologies, for the benefit of its inhabitants and businesses’. Smart cities are innovative, making traditional networks and services more efficient through the use of digital technologies, creating more inclusive, sustainable and connected cities for the benefit of inhabitants, public administrations and businesses. Smart cities have the potential to improve the quality of life, while ensuring the needs of present and future generations with respect to economic, social and environmental challenges.
The concept of smart cities covers a broad range of areas such as: the economy, the environment, mobility, or governance. Some practical applications include more efficient ways to light and heat buildings, or the introduction of wireless sensors for waste disposal facilities to optimise collection schedules. Smart urban transport networks can be used to reduce congestion: for example, a city that is run as an integrated system would be able to reconfigure its activity if a traffic incident occurs, temporarily rerouting emergency services to avoid congestion, or sending additional public transport services to affected parts of the city. These technological advances can also enhance the understanding of how cities function and provide the potential for considerable efficiency savings, which may in turn help reach the Europe 2020 targets.
The European Innovation Partnership on Smart Cities and Communities (EIP-SCC) brings together cities, businesses and citizens with the goal of improving urban life. A budget of EUR 365 million was set aside for this purpose; the initiative is designed to accelerate the commercial roll-out of smart city solutions through an implementation plan built on the receipt of 370 eligible submissions for commitments.
The availability and quality of information and communication technologies (ICT) infrastructure represents one aspect of smart cities. These cities also appear to thrive where human capital and innovations work in unison with ICT; these issues are discussed in more detail below under the headings of education, innovation, use of the internet and transport.
Education
The wealth of cultural activities and scientific institutions in urban environments exposes young and older people to a diverse set of educational opportunities that are largely unavailable in rural settings. Such experiences have the potential to inspire, motivate, and challenge people to achieve more and may be of particular relevance to ensure the necessary human capital for stimulating the development of smart cities.
Many studies have shown that there is a link between cities which are characterised by highly-educated workforces and rapid urban development. This may be related to graduates deciding to stay close to where they studied, research institutes and science parks tending to cluster around academic institutions, or dynamic, lively cities with a high quality of life being more likely to attract entrepreneurs and highly-skilled workers.
The Italian city of Pisa had a very high number of tertiary education students
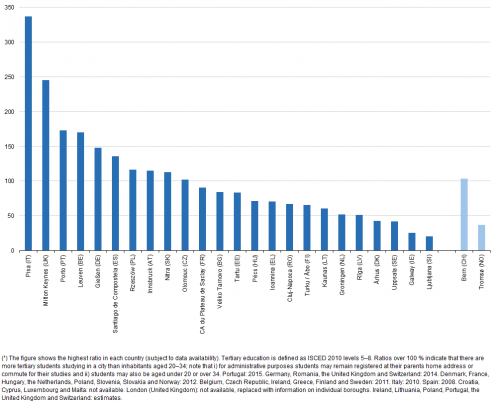
Figure 1 shows the proportion of the population aged 20–34 who were in full-time tertiary education (defined as ISCED 2011 levels 5–8); it presents the city in each of the EU Member States, Norway and Switzerland with the highest share. Note that ratios over 100 % are possible because: students may choose for administrative purposes to remain registered at their parents’ home address while the count of students is based on their place of study; some tertiary students are younger or older than the age limits that are used in the denominator for this indicator (namely, 20–34 years old). As such, it is perhaps unsurprising to find that many of the cities present in this ranking were relatively small, with tertiary students often inflating their populations considerably.
The Italian city of Pisa (2010 data) had the highest ratio of full-time tertiary students to its population of 20–34 year olds, at 336.7 %. To give an idea of the relative importance of the Pisa university system to the city, there were in excess of 50 thousand tertiary students studying in a city with a total population of fewer than 90 thousand inhabitants. The second highest ratio was recorded in Milton Keynes (the United Kingdom; 2014 data), followed by Porto (Portugal; 2015 data). Some of those cities recording high ratios were located close to much larger urban centres, for example: Leuven just to the east of Bruxelles/Brussel (Belgium; 2011 data); Gießen to the north of Frankfurt am Main (Germany; 2014 data); or the Communauté d’agglomération du Plateau de Saclay that is situated in the south-western suburbs of Paris (France; 2012 data), which is home to several tertiary education institutions.
(%)
Source: Eurostat (urb_ceduc) and (urb_cpop1)
Capital cities tended to attract a high share of graduates to their workforce
According to labour force survey statistics, the overall share of people aged 25–64 in the EU-28 with a tertiary level of educational attainment stood at just over a quarter (27.7 %) in 2012. An analysis by degree of urbanisation shows a marked contrast, with more than one third (35.5 %) of those living in cities having a tertiary level of educational attainment compared with less than one fifth (19.3 %) in rural areas. This pattern of higher shares being recorded among the working-age population living in cities was repeated in each of the EU Member States with the exception of Malta (where only a very small number of people are living in rural areas).
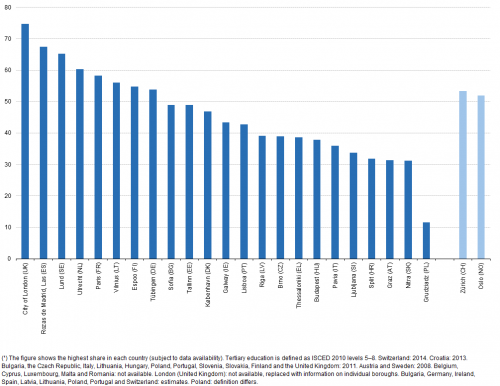
A more detailed analysis at the city level is presented in Figure 2: it shows the City of London (the United Kingdom; 2011 data) recorded the highest share of people aged 25–64 with a tertiary level of educational attainment, some 74.7 %; note that data for some of the EU Member States are presented at a very detailed level (subcity information), and that, for example, the City of London was inhabited by just seven thousand persons, as most of its relatively small area was covered by financial institutions. There were 10 other cities in the EU where the share of people aged 25–64 with a tertiary level of educational attainment was above 60.0 %: three of these were located in the suburbs around the Spanish capital of Madrid (Las Rozas de Madrid, Pozuelo de Alarcón and Majadahonda); two were suburbs of other Spanish cities — Sant Cugat del Vallès near Barcelona and Getxo near Bilbao; two were other parts of London — Richmond upon Thames and Wandsworth; while the list was completed by Cambridge (also in the United Kingdom), Utrecht (the Netherlands) and Lund (Sweden).
It was commonplace to find capitals attracting a higher than average share of graduates to their workforce, reflecting, among other factors: a wider range of potential job opportunities, both for those who studied in the capital as well as graduates from other parts of the country or indeed abroad; more dynamic career paths that may be offered (by enterprises that are located) in capital cities. This situation was apparent in/around the capital cities of the United Kingdom, Spain, France, Lithuania, Bulgaria, Estonia, Denmark, Portugal, Latvia, Hungary and Slovenia. In the remaining EU Member States, the highest shares of the working-age population with a tertiary level of educational attainment were often recorded in cities characterised by a high quality of life or their technological/innovative nature: for example, Lund (Sweden) and Espoo (Finland) are both home to a range of high-technology enterprises and business start-ups, while Utrecht (the Netherlands) has been named as the most competitive region in the EU.
(%)
Source: Eurostat (urb_ceduc)
Innovation
The innovation union is one of the seven flagship initiatives of the Europe 2020 strategy. It seeks to:
- encourage the creation of an innovation-friendly environment so that inventions can be more easily turned into new products and services;
- refocus research and development (R & D)/innovation policy on some of the major challenges facing society, for example, demographic changes, health issues, climate change, or energy and resource efficiency.
The patent system is designed to stimulate inventions as they are designed to help an inventor get a return on their investment; they may also be used to measure the knowledge potential of a city/region. Across the EU-28, there were 57.1 thousand patent applications made to the European Patent Office (EPO) in 2011; this equated to 113.2 applications for each million inhabitants.
The distribution of patent applications in the EU was highly concentrated; this may be linked to clusters that develop in/around capital cities, entrepreneurial hubs, or regions specialised in high-technology activities. These clusters provide a creative environment from which a wide range of innovations may develop; they also have the potential to provide ideas and technologies around which smart cities may develop.
Metropolitan regions had high levels of innovation output
Aside from being concentrated in metropolitan regions, the propensity to patent was also concentrated in relatively few of the EU Member States, as there were only 10 Member States where the metropolitan region with the highest ratio of patent applications per million inhabitants recorded a propensity to patent that was above the EU-28 average, they were: Germany, the Netherlands, France, Denmark, Sweden, Italy, Finland, the United Kingdom, Ireland and Belgium. Note that within each of these 10 Member States, there could be more than one metropolitan region with concentrated patent activity, for example, 31 out of the 41 German metropolitan regions for which data are available reported a propensity to patent above the EU-28 average.
Eindhoven, Düsseldorf and Portsmouth recorded the highest propensity to patent in the EU
There may be a number of reasons behind particular metropolitan regions recording high levels of propensity to patent. High propensities to patent may be linked to the existence of high-technology enterprises in science parks or similar facilities: the southern Dutch metropolitan region of Eindhoven is one such example with its high-tech campus (HTC). It claims to be the ‘smartest square kilometre’ in Europe with, on average, an application for a patent being filed every 20 minutes and more than 140 enterprises and institutions employing around 10 thousand researchers, developers and entrepreneurs; in 2011, the wider metropolitan region covering the whole of Eindhoven recorded the highest propensity for patent applications to the EPO (1 713 per million inhabitants) and the fifth highest number of applications (1 266). Similar examples exist in the south-eastern French metropolitan region of Grenoble, where CEA-Grenoble is the largest technological research centre in the Rhône-Alpes region, or in München (southern Germany), where the Max Planck Society is a prominent non-profit making research organisation.
Alternatively, in Düsseldorf (Germany), the high number of patent applications to the EPO (967 per million inhabitants in 2011) could, at least in part, be linked to the court system in Düsseldorf having a reputation for efficiently dealing with patent lawsuits. At 1 476 applications, Düsseldorf recorded the third highest absolute number of patent applications to the EPO in 2011, behind Paris (France) with 2 293 applications and Stuttgart (Germany) with 1 538 applications.
European capital of innovation
The European capital of innovation award was launched in 2014 as part of Horizon 2020, the EU’s research and innovation programme covering the period 2014–20. The first winner of the award was the Spanish city of Barcelona, where public and social services were brought closer to local citizens and made more transparent, for example, through the introduction of an online appointment system for meeting civil servants, or contactless connections to allow city-dwellers to use technology to find out what is/will be happening in their area.
In 2016, a total of 36 cities from 12 different countries applied to succeed Barcelona. Nine of these were identified for a shortlist, being recognised for their efforts to boost innovation, they were: Amsterdam (the Netherlands); Berlin (Germany); Eindhoven (the Netherlands); Glasgow (the United Kingdom); Milano (Italy); Oxford (the United Kingdom); Paris (France); Torino (Italy); and Vienna (Austria).
On 8 April 2016, Amsterdam was declared the winner of the award, with the judges stating that it had an ‘holistic vision of innovation related to four areas of urban life: governance, economics, social inclusion, and quality of life’.

(per million inhabitants)
Source: Eurostat (pat_ep_mtot) and (pat_ep_ntot)
Otherwise, metropolitan regions may record a high propensity to patent as a result of the existence of clusters of enterprises located around large (multi)national companies; this is often the case for engineering or technology sectors. For example, there were relatively high ratios of patent applications per million inhabitants for metropolitan regions specialised in the automotive industry, such as München, Stuttgart (both Germany) and Derby (the United Kingdom), or around high-technology sectors in metropolitan regions such as Rennes (France) or Eindhoven (the Netherlands).

Source: Eurostat (pat_ep_mtot), (pat_ep_mtec), (pat_ep_mict), (pat_ep_mbio), (pat_ep_ntot), (pat_ep_ntec), (pat_ep_nict) and (pat_ep_nbio)
Use of the internet
The digital agenda is a flagship initiative of the Europe 2020 strategy, with the objectives of: finalising the digital single market; enhancing interoperability and standards; strengthening online trust and security; promoting fast and ultra-fast internet access for all; investing in research and innovation; promoting digital literacy, skills and inclusion.
The availability of digital technology is considered fundamental for competitiveness and may be of particular relevance in terms of providing the necessary infrastructure for the development of smart cities. According to information society statistics, 80 % of all households in the EU-28 were already connected to broadband internet in 2015. Access to ICT is often characterised by a digital divide between urban and rural regions, skewed in favour of capital cities and other relatively large metropolitan regions. This may occur as investments in new infrastructure technologies (for example, ultrafast broadband or 5G mobile networks) are initially rolled out in major built-up areas which are characterised by their considerable (potential) customer base living in a relatively small, accessible area.
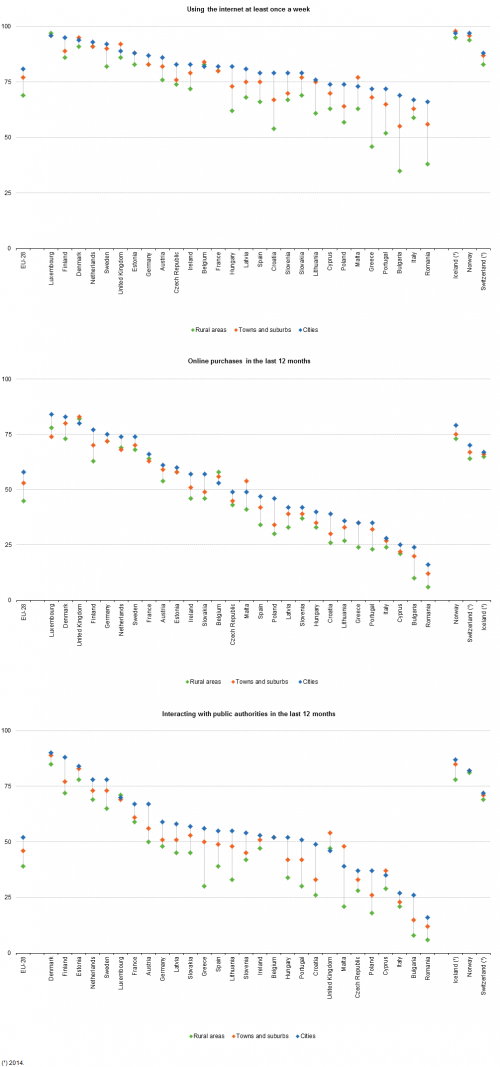
In 2015, at least 90 % of the households living in cities in the Netherlands, Luxembourg, Finland, Sweden, Germany, Denmark, the United Kingdom and Estonia had internet access, a share that rose to 98 % in Norway; by contrast, no more than three quarters of all households in the cities of Cyprus, Greece, Lithuania and Bulgaria had internet access. The patterns shown in Figure 3 reflect, at least to some degree, the unbalanced nature of internet usage across the EU, insofar as people living in households which do not have/choose not to have an internet connection cannot, for example, make online purchases or interact online with public authorities.
Santander’s transformation into a smart city
Santander in northern Spain provides a unique, city-scale experimental research facility. SmartSantander, a European research project funded by the seventh framework programme for research and technological development (FP7), has been designed to support the development of applications and services for smart cities. It focuses on experimenting with the internet of things in the context of the city and aims to stimulate interest in the use of this experimental facility among the scientific community, end-users and service providers, to encourage the development of a range of applications that may result in a higher quality of life for the city’s inhabitants and more sustainable and efficient public services.
There are a range of technologies being developed around exploiting the data collected by the sensors including applications to: make it easier to find a parking space or manage the city’s traffic (leading to benefits in terms of time and fuel savings, as well as reductions in air emissions); economise water or electricity (for example, through irrigation systems for green areas, the optimisation of street lighting requirements); assist local inhabitants to make a journey (real-time information on buses, bicycles for rent, or taxis available for hire); make refuse collections more efficient (routing vehicles only to those bins that require emptying).
For more information: http://www.smartsantander.eu/.
Use of the internet tends to be higher in cities than in rural areas
The first part of Figure 3 shows that a higher proportion of people living in cities tended to make use of the internet on a regular basis, defined here as at least once a week. Across the whole of the EU-28, upwards of four out of every five (81 %) persons living in cities used the internet on a regular basis in 2015, some 12 percentage points higher than the average recorded for rural areas.
The biggest digital divides between cities and rural areas occurred in those EU Member States characterised by relatively low levels of internet use, for example, Croatia, Greece, Romania and Bulgaria. On the other hand, in the Benelux countries, Denmark and France there was almost no difference in the rates of internet use between those living in cities and those living in rural areas.
Information society statistics also confirm that 12 % of people living in cities across the EU-28 in 2015 had never used the internet, compared with 23 % of those living in rural areas. The proportion of people living in cities who had never used the internet was either 2 % or 3 % in the Nordic Member States and Luxembourg. At the other end of the range, some 20–25 % of those living in cities in Poland, Bulgaria, Greece, Cyprus, Portugal, Malta and Italy had never used the internet.
Over recent years, the proportion of individuals shopping online grew steadily
The second part of Figure 3 shows that in most of the EU Member States, a higher share of those living in cities (compared with rural areas) made online purchases in the 12 month period prior to a survey in 2015. Across the EU-28, some 58 % of those living in cities made online purchases; this was 13 percentage points higher than the corresponding share recorded for those living in rural areas.
At least 80 % of the population living in the cities of Luxembourg, Denmark and the United Kingdom made an online purchase during the 12 month period prior to the survey in 2015. By contrast, just 16 % of those living in cities in Romania, or around one quarter in Bulgaria and Cyprus, rising to 28 % in Italy made online purchases.
More than half of the EU-28 population living in cities interacts with public authorities via the internet
Technological advances have led to a multiplication of the ways in which public authorities can offer online services to citizens and businesses alike (for example, systems for online income tax or VAT declarations). The final part of Figure 3 shows that across the EU-28, some 52 % of people living in cities used the internet to interact with public authorities during the 12 months prior to a survey in 2015; this figure was 13 percentage points higher than the share recorded for rural areas. Interaction with public authorities is defined here to include: obtaining information from public administration websites; downloading official forms through the internet; sending filled in forms through the internet.
In most of the EU Member States, people living in cities recorded a higher propensity to interact with their public authorities via the internet than those living in rural areas, which is perhaps surprising given the accessibility issues that may be faced by those living in more remote areas. Belgium, Luxembourg and the United Kingdom recorded almost no difference between those living in cities and rural areas, while the digital divide for online interaction with public authorities was much greater in Portugal, Lithuania and Croatia, as well as in Greece where the gap between those living in cities and those living in rural areas reached 26 percentage points.
(%)
Source: Eurostat (isoc_bdek_di), (isoc_bde15cbc) and (isoc_bdek_ps)
Transport
Cities can facilitate a range of ideas/responses for tackling the impact of congestion and pollution, for example: congestion charges as implemented in central London (the United Kingdom) and Milano (Italy); alternate day travel based on vehicle license plates, as implemented in the Greek capital of Athina; bans on cars when air pollution levels reach a certain limit, as implemented in the Italian capital of Roma; restrictions on the speed of travel during periods of increased pollution, as implemented in and around the French capital of Paris; or complete bans on the use of cars from historic city centres, as implemented in the Italian city of Firenze.
In 2013, the proportion of people who were satisfied with their commuting time was, on average, lower among those living in cities than in rural areas. In the EU-28, the share of people satisfied with their commuting time was highest among those living in towns and suburbs (7.5 on a scale of 0–10), while the corresponding rates for those living in rural areas (7.4) and cities (7.3) were slightly lower. Unlike many of the other indicators shown in this chapter, there was no clear pattern among the EU Member States, insofar as 10 reported a higher level of satisfaction among those living in rural areas, while nine reported a higher level for those living in cities; there was no difference in the level of satisfaction in the eight remaining Member States (Malta, not applicable).
The least satisfied city-dwellers were those living in Greece, where the level of satisfaction was 0.9 points lower than in rural areas; relatively large differences were also recorded in Spain and the United Kingdom. The opposite was particularly true in Croatia, Cyprus, the Czech Republic and Slovenia, where those living in rural areas recorded relatively low levels of satisfaction compared with their urban counterparts.

(rating, 0–10)
Source: Eurostat (ilc_pw02)
A very high proportion of those living in the Austrian capital were satisfied with their public transport
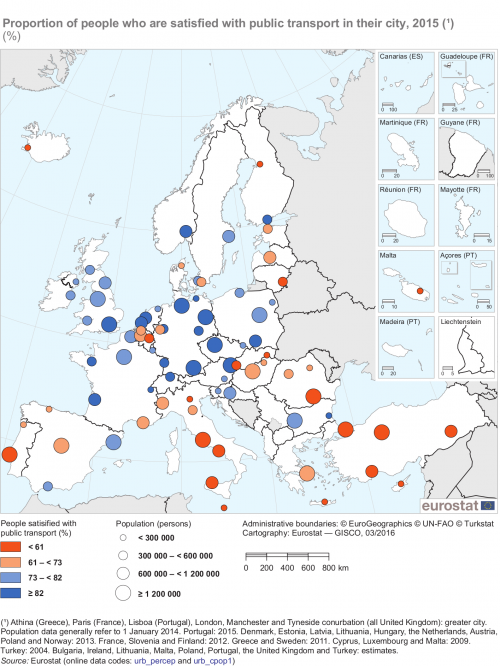
An analysis of satisfaction levels for the provision of public transport services at the city level is presented in Map 2. In 2015, the highest levels of satisfaction in the EU were recorded in the Austrian and Finnish capitals of Wien (95 %) and Helsinki (93 %); although an even higher share was recorded in the Swiss city of Zürich (97 %). There were several other capital cities where a relatively high proportion of the population was satisfied with the provision of public transport in their city, including London and the Czech capital of Praha, as well as the Norwegian capital of Oslo. Much lower levels of satisfaction with public transport were recorded in southern Europe, particularly in Italy, with the lowest satisfaction rate among any of the EU-28 capital cities recorded in Roma (30 %) and the lowest overall rate among any of the 79 European cities surveyed was recorded in the Sicilian capital of Palermo (14 %).
(%)
Source: Eurostat (urb_percep) and (urb_cpop1)
Source data for tables and graphs
Direct access to
- Urban Europe — statistics on cities, towns and suburbs (online publication)
- Degree of urbanisation classification - 2011 revision
- Eurostat regional yearbook
- Statistics on regional typologies in the EU
- Regions and cities (all articles on regions and cities)
- Territorial typologies
- Territorial typologies for European cities and metropolitan regions
- What is a city?
- Perception survey on quality of life in 79 European cities
- Regional education statistics (ESMS metadata file — reg_educ_esms)
- ICT usage in households and by individuals (ESMS metadata file — isoc_i_esms)
- Regional transport statistics (ESMS metadata file — reg_trans_esms)
- Urban audit (ESMS metadata file — urb_esms)
- Regional statistics by typology (ESMS metadata file — reg_typ_esms)
- European Commission, Directorate-General for Regional and Urban Policy, Urban development
- European Commission, Directorate-General for Regional and Urban Policy, A harmonised definition of cities and rural areas: the new degree of urbanisation
- European Commission, Digital economy and society, Smart cities
- European Commission, EIP on smart cities
- European smart cities
- OECD, Redefining urban — a new way to measure metropolitan areas