Labour market slack - employment supply and demand mismatch
Data extracted in May 2023
Planned article update: June 2024
Highlights

Economic and health crises have highlighted the relevance of looking further than unemployment to better capture the unmet supply of employment. Indeed, to be unemployed according to the criteria of the International Labour Organisation (ILO), a person has to fulfil several specific criteria as regards their job search and availability to work. Due to a significant slowdown in the economic activity, jobless people, who would have looked for a job and been available to work in other circumstances, may leave the labour force without actually fully losing their attachment to the labour market. Furthermore, some employed people working part-time might express their willingness to work more hours, which is another case of unmet supply of employment.
This article focuses on people who have an unmet supply of employment, so all those who are either unemployed (according to ILO criteria), or underemployed (i.e. those working part-time but who wish and are available to work more), or associated to the labour force because of their availability to work or their work search but who are not recorded as part of it (they meet some but not all of the ILO criteria for unemployment). It complements the article on unemployment statistics.
The analyses cover the situation in the European Union (EU) and individual EU Member States as well as two EFTA countries (Norway and Switzerland) and one candidate country (Serbia).
Full article
Labour market slack: what's it all about?
Labour market slack refers to all unmet needs for employment. The labour market slack includes unemployment according to the ILO definition as well as three supplementary indicators. The exact definitions of these three indicators are as follows:
- Underemployed part-time workers are people working part-time who wish to work additional hours and are available to do so. Part-time work is recorded as self-reported by individuals.
- People seeking a job but not immediately available to work are people neither employed nor unemployed who:
- (a) are actively seeking work during the last 4 weeks but not available to work in the next 2 weeks, or
- (b) found a job to start within less than 3 months' time and are not available to work in the next 2 weeks', or
- (c) found a job to start in more than 3 months' time but are not available to work in the next 2 weeks.
- People available to work but not seeking are people neither employed nor unemployed who want to work and
- (a) are available to work in the next 2 weeks but are not seeking work, or
- (b) were passively seeking work during the last 4 weeks and are available to work in the next 2 weeks, or
- (c) found a job that will start in more than 3 months' time and are available to work in the next 2 weeks.
The last two groups are jointly referred to as the potential additional labour force. All three groups together are referred to as supplementary indicators to unemployment. These three groups do not meet the full criteria of the ILO unemployment definition, i.e. being without work, actively seeking work, and being available for work. However, while not being captured through the unemployment rate, these groups might still show an unmet supply of employment.
While underemployed part-time workers are part of the labour force, the two other groups (persons seeking work but not immediately available and persons available to work but not seeking) are part of the population outside the labour force.
These supplementary indicators complement the unemployment data and provide a more complete picture of the labour market. Figure 1 may help us better understand the different categories of labour market slack and the labour market in general.
To allow comparisons between these four groups, which do not all belong to the labour force, the concept of "extended labour force" is used. It includes people:
- in the labour force (unemployed and employed) and
- in the potential additional labour force (the two categories outside the labour force, i.e. those available but not seeking, and those seeking but not available).
The total labour market slack is usually expressed as a percentage of this extended labour force, and the relative size of each component of the labour market slack can be compared by using the extended labour force as denominator.
.PNG)
(in % of the total people aged 15-74 years)
Source: Eurostat (lfsi_sup_a) and (une_rt_a)
Overview of labour market slack in the EU and its Member States
In 2022, slightly more than 1 in 8 people in the EU extended labour force had an unmet supply of employment
In the EU, the labour market slack of people aged 15 to 74 years accounted for 12.3 % of the extended labour force, corresponding to 27.5 million people facing an unmet supply of employment in 2022.
At EU level, from 2009 to 2019, the trend in labour market slack followed and emphasised the unemployment trend, which is one of its components (see Figure 2). The other three components, although also connected to the economic situation, were somewhat more stable overtime. In 2009, 16.3 % of the extended labour force faced a potential unmet supply of employment. In 2013, the slack went up to 19.6 %. Then, it declined steadily to 13.6 % in 2019, increased again when the COVID-19 pandemic hit the labour market in 2020 (14.9 %) and started a downward trend to 12.3 % in 2022.
In contrast to previous years, the change in labour market slack which occurred in 2020 was mainly due not to an increase in unemployment but rather the increase in the number of people available to work but not seeking it. This might be explained by the length and the repetition of the lockdowns as well as other health measures that meant that people looking for a job could not expect positive outcomes. Some people definitely put their job search on hold.
.png)
(in % of extended labour force aged 15-74 years)
Source: Eurostat (lfsi_sla_a)
The components of labour market slack in the EU in 2022 were as follows:
- unemployment 5.9 % of the extended labour force
- people available to work but not seeking 3.0 % of the extended labour force
- underemployed part-time workers 2.6 % of the extended labour force
- people seeking work but not immediately available 0.8 % of the extended labour force.
In 2022, labour market slack was highest in Spain (21.3 % of the extended labour force), followed by Italy (19.5 %), Greece (18.5 %), Sweden (16.1 %) and Finland (15.1 %). By contrast, Czechia (3.0 %), Malta (4.4 %) and Poland (4.9 %) registered the lowest levels of labour market slack (see Figure 3).
.png)
(in % of extended labour force, people aged 15-74 years)
Source: Eurostat (lfsi_sla_a)
The components and country disparities
Less than half the people in the EU with an unmet supply of employment were unemployed
The unmet supply of employment has several different components that are more or less substantial according to the country. As further illustrated, referring only to unemployment to capture the unmet supply of employment is not sufficient in most countries.
The weight of unemployment in the total EU labour market slack was 48.3 % but varies significantly from one country to another. There clearly exists a geographical pattern as shown in Map 1. Eastern and southern countries (except Italy) are characterised by a higher share of unemployment in their labour market slack than western and northern countries.
In Slovakia, Czechia, Malta, Greece, Lithuania, Hungary and Latvia (see Map 1), more than 61 % of people in the labour market slack are unemployed according to the ILO in 2022. This share even reached 77.6 % and 74.7 % in Slovakia and Czechia, followed by Malta (69.2 %), Greece (65.2 %), Lithuania (64.3 %), Hungary (61.8 %) and Latvia (61.3 %). By contrast, less than 39 % of people facing an unmet supply of employment (see Map 1) were unemployed in the Netherlands (30.2 %), Luxembourg (37.5 %), Italy (37.6 %) and Ireland (39.3 %).
In 2022, people who are available to work, but not looking for a job accounted for 24.3 % of the EU slack but more than 27 % in Italy (45.5 %), Bulgaria (35.9 %), Estonia (32.5 %) and 28.4 % in both Germany and Hungary (see Map 2). The lowest shares were reported by Malta (7.7 %), Czechia (8.9 %) but also by Lithuania (10.7 %), Cyprus (11.3 %), Slovakia (12.3 %), Finland (13.4 %) and Greece (14.6 %) (see Map 2). For this category, there is no clear geographical pattern as for the previous and the next category.
Furthermore, underemployed part-time workers explained 20.8 % of the unmet supply of employment in the EU but more than 29% (see Map 3) in the Netherlands (43.8 %), Ireland (35.3 %), Cyprus (30.6 %) and Belgium (29.7 %). This share fell below 14 % in Bulgaria, Slovakia, Hungary, Estonia, Czechia and Latvia. Generally, compared with eastern countries, western countries are characterised by a larger share of underemployed part-time workers in the total of people with an unmet supply of employment.
People seeking but not available accounted for a much smaller part of the slack in the EU (6.6 %) and in most countries in 2022. However, this category of people surpassed 14 % in Finland (21.3 %), Luxembourg (15.0 %) and Austria (14.8 %) that reported the highest shares in 2022. In Romania, Italy, Hungary, Croatia and Greece, it stood below 3 % (see Figure 3).
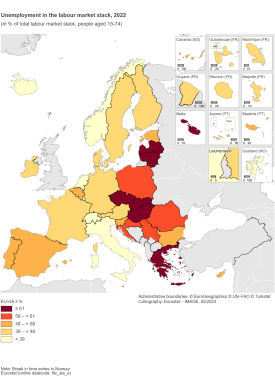
Map 1: Unemployment in the labour market slack, 2022
(in % of total labour market slack, people aged 15-74 years)
Source: Eurostat (lfsi_sla_a)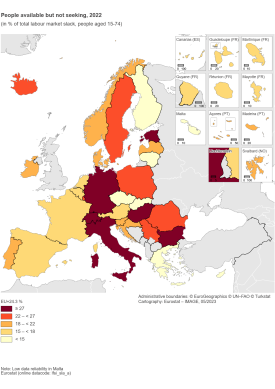
Map 2: People available to work but not seeking, 2022
(in % of total labour market slack, people aged 15-74 years)
Source: Eurostat (lfsi_sla_a)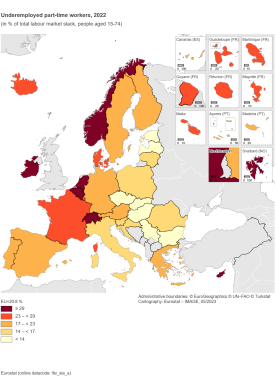
Map 3: Underemployed part-time workers, 2022
(in % of total labour market slack, people aged 15-74 years)
Source: Eurostat (lfsi_sla_a)


2022 compared with 2021 and 2019
In 2022, six EU countries did not fully recover their pre-pandemic slack levels
From 2021 to 2022, the unmet supply of employment decreased at EU level (-1.7 percentage points (pp)), as well as in all EU countries without any exception: it decreased the most in Ireland (-4.8 pp), Greece (-3.7 pp), Italy (-3.3 pp) and Latvia (-3.1 pp) and decreased the least in Romania (-0.3 pp), Poland (-0.8 pp), Estonia (-0.9 pp) and Czechia (-0.9 pp) (see Figure 4).
In 2022, six EU countries did not recover the level of slack recorded before the health crisis in 2019 and were still above the pre-pandemic share but all with a difference of less than 1 pp, namely Sweden (+0.8 pp compared with 2019), Lithuania (+0.7 pp), Estonia and Germany (both with +0.6 pp), Romania and Slovakia (both with +0.1 pp). In comparison, 2022 slack level is more than 3 pp lower than 2019 level in Greece (-6.7 pp), Finland (-4.2 pp) and Ireland (+3.3 pp).
.png)
(in percentage points, people aged 15-74 years)
Source: Eurostat (lfsi_sla_a)
Employment and slack: relationship by country
Figure 5 presents the population aged 15-74 years by country and labour status in 2022. The relationship between the share of employed people and the labour market slack does not clearly appear. It may be expected that the lower the employment rate, the larger the labour market slack. However, there are several exceptions to this statement. For example, the Netherlands and Sweden had a relative high level of employment among people aged 15-74 years in 2022 (66.2 % in the Netherlands and 61.7 % in Sweden) together with a relatively high share of people facing an unmet supply of employment, the labour market slack affecting respectively 8.6 % and 12.8 % of the total people. By contrast, Romania had one of the smallest labour market slack (5.5 %) while its level of employment was also significantly below the EU average.
This figure also highlights the relevance of looking at the category people outside the extended labour force to provide a complete picture of the labour market. This category includes people who are neither employed, nor available to work nor seeking (e.g. not-employed students, fully retired people, care-givers, e.g. for children or elderly people). The COVID-19 pandemic also stressed the need to look at this category. Losses in employment were offset in many countries by an increase in labour market slack but also in the category of people outside the extended labour force. The article Key figures on the changes in the labour market provides further explanations on the changes, taking as a reference the whole population.
Note that in the context of this article the reference age category is 15-74 years which is the reference age category for unemployment.
Looking at the age category 20-64 years, the relationship between labour market slack and employed people both expressed as a percentage of the total population, is closer, showing a correlation coefficient across EU Member States of 0.6 (against 0.2 for the population aged 15-74 years) in 2022 (see the attached excel file for further details). This is explained by, among other things, the lower weight of students or fully retired people in the age category 20-64. However, slack and employment are still not perfectly correlated. This shows strong disparities across EU countries in the significance of the category 'people outside the extended labour force'.
.png)
(in % of the total people aged 15-74 years)
Source: Eurostat (lfsi_sup_a) and (une_rt_a)
Gap between men and women
Labour market slack for women in the EU surpassed that for men by 4 pp in 2022
The 2022 labour market slack by country and sex is displayed in Figure 6.
In the EU, 14.2 % of women in the extended labour force expressed a potential unmet supply of employment, as against 10.6 % of men, producing a gender gap of 3.6 pp (i.e. the difference between the female and the male labour market slack). Women were also more likely to face an unmet supply of employment in most EU countries. Only Latvia, Romania and Lithuania recorded a higher labour market slack for men than women, although with differences lower than 2 pp while there was no difference between male and female labour market slack in Bulgaria and Malta. Among EU countries, Greece (11.1 pp), Spain (9.9 pp) and Italy (8.2 pp) had the widest gender gaps compared with all other EU countries. Luxembourg, Cyprus and Sweden followed at some distance, with a gap between 4 pp and 5 pp.
.png)
(in % of the extended labour force, people aged 15-74 years)
Source: Eurostat (lfsi_sla_a)
Source data for tables and graphs
Methods and definitions
Data sources
All figures in this article are based on the European labour force survey (EU-LFS).
Source: The European Union Labour Force Survey (EU-LFS) is the largest European household sample survey providing quarterly and annual results on labour participation of people aged 15 years and over as well as on persons outside the labour force. It covers residents in private households. Conscripts in military or community service are not included in the results. The EU-LFS is based on the same target populations and uses the same definitions in all countries, which means that the results are comparable between the countries. The EU-LFS is an important source of information about the situation and trends in the national and EU labour markets. Each quarter around 1.8 million interviews are conducted throughout the participating countries to obtain statistical information for some 100 variables. Due to the diversity of information and the large sample size, the EU-LFS is also an important source for other European statistics like Education statistics or Regional statistics.
Reference period: Yearly results are obtained as averages of the four quarters in the year.
Coverage: The results from the EU-LFS currently cover all European Union Member States, the EFTA Member States Iceland, Norway and Switzerland, as well as the candidate countries Montenegro, North Macedonia, Serbia and Turkey. For Cyprus, the survey covers only the areas of Cyprus controlled by the Government of the Republic of Cyprus.
European aggregates: EU and EU-27 refer to the sum of the 27 EU Member States. If data are unavailable for a country, the calculation of the corresponding aggregates takes into account the data for the same country for the most recent period available. Such cases are indicated.
Country notes
In the Netherlands, the 2022 LFS data remains collected using a rolling reference week instead of a fixed reference week, i.e. interviewed persons are asked about the situation of the week before the interview rather than a pre-selected week.
Spain and France have assessed the attachment to the job and included in employment those who, in their reference week, had an unknown duration of absence but expected to return to the same job once health measures allow it.
Definitions
The concepts and definitions used in the EU-LFS follow the guidelines of the International Labour Organisation (ILO).
- Employed people comprise: (a) persons who during the reference week worked for at least one hour for pay or profit or family gain; (b) persons who were not at work during the reference week but had a job or business from which they were temporarily absent.
- Unemployed people comprise persons who were: (a) not employed according to the definition of employment above; (b) currently available for work, i.e. were available for paid employment or self-employment before the end of the two weeks following the reference week; (c) actively seeking work, i.e. had taken specific steps in the four week period ending with the reference week to seek paid employment or self-employment or who found a job to start later, i.e. within a period of at most three months from the end of the reference week.
- Underemployed part-time workers are persons working part-time who wish to work additional hours and are available to do so. Part-time work is recorded as self-reported by individuals.
- Persons seeking work but not immediately available correspond to the number of persons neither employed nor unemployed who: (a) are actively seeking work during the last 4 weeks but not available to work in the next 2 weeks; or (b) found a job to start within a period of at most 3 months and are not available to work in the next 2 weeks'; or (c) found a job to start in more than 3 months but are not available to work in the next 2 weeks.
- Persons available to work but not seeking correspond to the number of persons neither employed nor unemployed who want to work and (a) are available to work in the next 2 weeks but are not seeking work, or (b) were passively seeking work during the last 4 weeks and are available to work in the next 2 weeks or (c) found a job to start in more than 3 months and are available to work in the next 2 weeks.
Note that until 2020 the EU-LFS did not collect the availability to work for people who already found a job to start in more than 3 months. For this reason, all persons having already found a job to start in more than 3 months were classified as seeking work but not immediately available until 2020.
The last two groups are jointly referred to as the potential additional labour force.
Persons, who fall within the three last categories above, fall outside the bandwidth of unemployment as persons are either employed with insufficient working time, immediately unavailable, or not seeking a job in a very specific time period. However, these persons may have an unmet supply of employment. These three last categories together are referred to as supplementary indicators to the unemployment indicator. While underemployed part-time workers are part of the labour force, the two other groups (persons seeking work but not immediately available and persons available to work but not seeking) are part of the population outside the labour force. These supplementary indicators complement the unemployment and provide a more complete picture of the labour market.
The labour market slack is the total sum of all unmet supply of employment, including unemployment according to the ILO definition as well as the three supplementary indicators. In order to allow comparisons between these four groups, which do not all belong to the labour force, the concept of the extended labour force is used. It includes employed people, unemployed people but also the two categories of people outside the labour force, i.e. those available but not seeking work, and those seeking but not available to work. The total labour market slack is expressed in a percentage of this extended labour force, and the relative size of each component of the labour market slack can be compared by using this denominator.
Time series
Regulation (EU) 2019/1700 came into force on 1 January 2021 and induced a break in the EU-LFS time series for several EU Member States. In order to monitor the evolution of employment and unemployment despite of the break in the time series, EU Member States assessed the impact of the break in their country and computed impact factors or break corrected data for a set of indicators. Break corrected data are published on the Eurostat website for the LFS main indicators.
Additional methodological information
More information on the EU-LFS can be found via the online publication EU Labour Force Survey, which includes eight articles on the technical and methodological aspects of the survey. The EU-LFS methodology in force from the 2021 data collection onwards is described in methodology from 2021 onwards. Detailed information on coding lists, explanatory notes and classifications used over time can be found under documentation.
Context
Employment and unemployment as defined by the International Labour Organisation (ILO) are, in the particular situation of the COVID-19 health crisis, not sufficient to describe the developments taking place in the labour market. In 2020, active measures to contain employment losses led to absences from work rather than dismissals, and individuals could not look for work or were not available due to the containment measures, thus not counting as unemployed.
The three indicators supplementing the unemployment rate presented in this article provide an enhanced and richer picture than the traditional labour status framework, which classifies people as employed, unemployed or outside the labour force, i.e. in only three categories. The indicators create 'halos' around unemployment. This concept is further analysed in a Statistics in Focus publication titled "New measures of labour market attachment", which also explains the rationale of the indicators and provides additional insight as to how they should be interpreted. The supplementary indicators neither alter nor put in question the unemployment statistics standards used by Eurostat. Eurostat publishes unemployment statistics according to the ILO definition, the same definition as used by statistical offices all around the world. Eurostat continues publishing unemployment statistics using the ILO definition and they remain the benchmark and headline indicators.
Direct access to
- New measures of labour market attachment - Statistics in focus 57/2011
- Labour force survey in the EU, EFTA and candidate countries — Main characteristics of national surveys, 2020, 2022 edition
- Quality report of the European Union Labour Force Survey 2020, 2022 edition
- EU labour force survey — online publication
- European Union Labour force survey - selection of articles (Statistics Explained)
- LFS main indicators (lfsi)
- Unemployment - LFS adjusted series (une)
- Supplementary indicators to unemployment - annual data (lfsi_sup_a)
- Supplementary indicators to unemployment - quarterly data (lfsi_sup_q)
- Unemployment - LFS adjusted series (une)
- LFS series - Detailed annual survey results (lfsa)
- Total unemployment - LFS series (lfsa_unemp)
- Supplementary indicators to unemployment by sex and age (lfsa_sup_age)
- Supplementary indicators to unemployment by sex and educational attainment level (lfsa_sup_edu)
- Supplementary indicators to unemployment by sex and citizenship (lfsa_sup_nat)
- Total unemployment - LFS series (lfsa_unemp)
- LFS series - Detailed quarterly survey results (lfsq)
- Total unemployment - LFS series (lfsq_unemp)
- Supplementary indicators to unemployment by sex and age (lfsq_sup_age)
- Supplementary indicators to unemployment by sex and educational attainment level (lfsq_sup_edu)
- Total unemployment - LFS series (lfsq_unemp)
Publications
- EU labour force survey — online publication
- Labour force survey (LFS) – Main concepts
- New measures of labour market attachment - Statistics in focus 57/2011
- Labour force survey in the EU, EFTA and candidate countries — Main characteristics of national surveys, 2020, 2022 edition
- Quality report of the European Union Labour Force Survey 2020, 2022 edition
- Statistical working papers / Manuals and guidelines
ESMS metadata files and EU-LFS methodology
- Employment and unemployment (Labour Force Survey) (ESMS metadata file — employ_esms)
- LFS main indicators (ESMS metadata file — lfsi_esms)
- LFS series - detailed annual survey results (ESMS metadata file — lfsa_esms)
- LFS series - detailed quarterly survey results (from 1998 onwards) (ESMS metadata file — lfsq_esms)
- LFS ad-hoc modules (ESMS metadata file — lfso_esms)