Tutorial:Guidelines for notes and footnotes
Tutorial updated in April 2019.
Highlights
This tutorial provides information on the rules to be followed when creating notes and footnotes attached to graphs and tables in Statistics Explained articles and other publications.
Full article
Using 'notes' instead of 'footnotes'
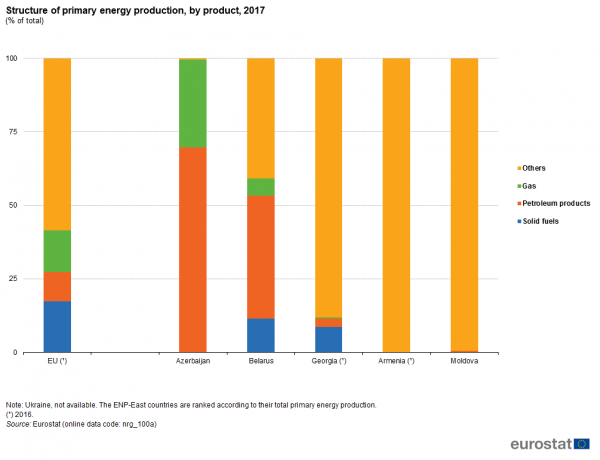
When describing information of a general nature which is applicable to all countries and/or years, it is recommended to use ‘Notes’. These should be placed first, before regular footnotes. This avoids introducing a footnote attached to the title. Ranking order or limitations about data coverage, such as ‘Only values over 50.000 are displayed’, are typical examples. Notes could also include information about countries which are not available. See the two examples below (correct and to be avoided):
Correct example
To be avoided
Order of 'notes', 'footnotes' and 'source'
Information elements published under graphs and tables should be presented in the order of appearance (See correct example below):
- 1. Notes
- 2. Footnotes
- 3. Source
Limited number and restricted size of notes and footnotes
The number and the length of notes and footnotes should be restricted to the maximum extent according to the complexity of the data. Expanding the area used for notes or footnotes reduces the area available for the illustration itself, and could restrict users' confidence in the comparability of the data presented.
Flag countries in the axis rather than years or legends
When footnotes concern countries, it is recommended to flag them in the axis rather than flagging years in the title or legends. See correct example hereafter.
Correct example
Note for missing countries in a graph
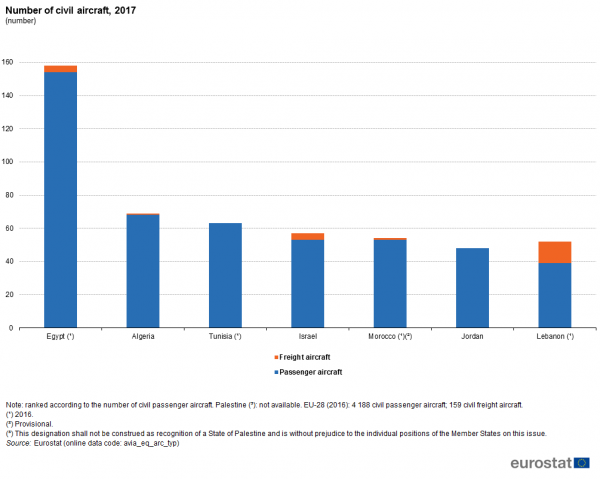
It is recommended to list the countries that are missing for an estimated EU aggregate with a footnote attached to the aggregate (see correct example below). However, the ideal situation would be to have estimates of the EU aggregates based for instance on earlier data for this/these country/countries.
Chart not starting at 0
As a general rule, in order to follow the good practices of transparency and clear communication, every chart axis should start at zero. This is an obligation for all bar charts as the ratios between the bars can get distorted.
In some limited cases, the chart might need to start at another point than zero. Please discuss such cases with SE team in advance to see if another solution can be found. If a chart starts at a value other than zero, it is necessary to add a note about this to inform the user that we are breaking the standard practice.
</sesection>
Maps
The footnotes are normally specifying exceptions to the title and should only be used if needed. If you have exceptions to the main title of the map, you add a "Note:" at the bottom of the map and list all exceptions in simple sentences. The exceptions mentioned can be of different type; exceptions regarding the reference year or the NUTS level are the most common, but there can be other exceptions as well, regarding for example estimated values, confidential data or definitions of statistical content.
When specific countries or regions are mentioned in the footnote; please spell out the country names instead of using the country codes and list them in protocol order. Please note that the names of the countries are written in the language of the publication (German, English and French), but the region names are written as in the NUTS Regulation, which means in the official language of each country and with the NUTS code in brackets immediately after the region name.
Direct access to


