Tourism statistics - occupancy rates in hotels and similar establishments
Data extracted in June 2020.
No planned article update.
Highlights
Net occupancy rates of bed places in hotels and similar establishments, December 2019, EU-27
This article focuses on the short-term evolution of the net occupancy rates of bed places and bedrooms of hotels and similar accommodation establishments in the European Union (EU) and contains the first publication of data for December 2019.
Full article
Occupancy rates of bed places
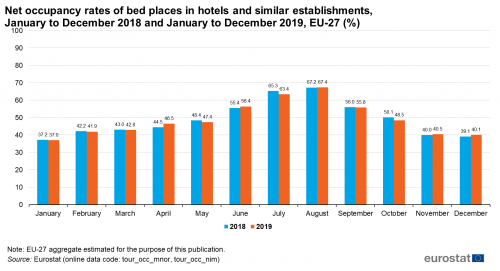
Data on occupancy rates of bed places for December and the fourth quarter of 2019 (the most recent reference month and quarter available) are compared with the same month and quarter of the previous year. In addition, data from January to December 2019 are compared with the same period in 2018 (see Figure 1).

In December 2019 compared with December 2018, net occupancy rates of bed places in the EU increased by 1.0 percentage point (see Table 1). Looking at country level, in December 2019 net occupancy rates of bed places ranged from 22.3 % in Greece to 48.0 % in Spain (see Figure 2).


During the fourth quarter (October to December) 2019, net occupancy rates of bed places in the EU remained stable compared with the same quarter of the year before (see Table 1). During this period, on average more than half of the available bed places in Spain, Cyprus and Malta were occupied.
Looking at the twelve-month period from January to December 2019, net occupancy rates of bed places in the EU remained relatively stable (-0.1 percentage points) compared with the previous year (see Table 1). At national level however, Slovenia reported the highest increase (+12.9 percentage points) followed far behind by Belgium (+3.3 percentage points), while Finland recorded the biggest drop (-17.4 percentage points). During this period, on average more than three out of five available bed places in Spain, Croatia, Cyprus and Malta were occupied.
Occupancy rates of bedrooms
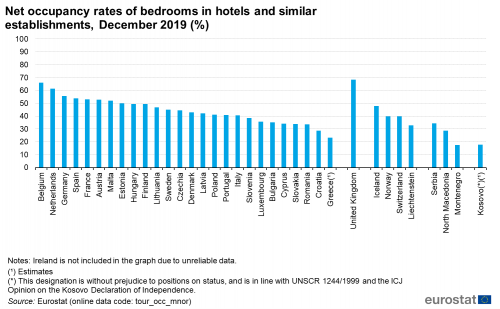
Monthly data on occupancy rates of bedrooms from October to December 2019 are compared with the same months of the previous year (see Table 2). Please note that aggregates for EU-27 and estimates for periods longer than one month cannot be calculated using the available data for bedroom occupancy rates.

In December 2019, occupancy rates of bedrooms in hotels and similar accommodation of the EU Member States where data are available, ranged from 23.3 % in Greece to 65.9 % in Belgium. During this month, on average more than three out of five available bedrooms in Belgium and the Netherlands have been in use, while less than three out of ten available bedrooms in Greece and Croatia were occupied (see Figure 3).
Malta was the Member State with the highest occupancy rate of bedrooms in October 2019, with 84.6 % while in November 2019 the Netherlands recorded the highest occupancy rate (73.4 %) (see table 2).

Source data for tables and graphs
Data sources
Data on arrivals for the same reference period are available in the Eurostat database. For more recent data on nights spent, see Nights spent at tourist accommodation establishments.
Context
The EU is a major tourist destination, with four Member States among the world’s top ten destinations for holidaymakers, according to UNWTO[1] data. Tourism is an important activity in the EU which contributes to employment and economic growth, as well as to the development of rural, peripheral or less-developed areas. These characteristics drive the demand for reliable and harmonised statistics on this activity, as well as within the wider context of regional policy and sustainable development policy areas.
Direct access to
Other articles
Main tables
Dedicated section
Methodology
Legislation
- Regulation (EU) No 692/2011 of 6 July 2011 concerning European statistics on tourism and repealing Council Directive 95/57/EC.
- Summaries of EU Legislation: Tourism statistics
- Regulation (EU) No 1051/2011 of 20 October 2011 implementing Regulation (EU) No 692/2011 concerning European statistics on tourism, as regards the structure of the quality reports and the transmission of the data.
External links
- Agenda for a sustainable and competitive European tourism (Communication from the European Commission, October 2007)
- European Commission - Directorate-General for Internal Market, Industry, Entrepreneurship and SMEs - Tourism