Tourism statistics - characteristics of tourism trips
Data extracted in November 2023
Planned article update: 04 December 2024
Highlights
Trends in number of trips, nights spent and average duration of trips made by EU residents, 2007-2022
This article is part of the Eurostat online publication Tourism trips of Europeans providing statistics on tourism demand in the European Union (EU) and EFTA countries.
The article takes a closer look at trips that EU residents (aged 15 and over) made in 2022, with a focus on the characteristics of these trips. Specific aspects such as top destinations, seasonality and expenditure on tourism trips are dealt with in more detail elsewhere in other articles of this publication. This article concentrates on analysis for the European Union at aggregate level. More detailed information at country level is available in the online database.
Full article
General overview
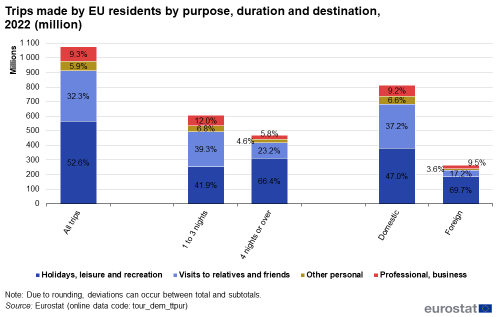
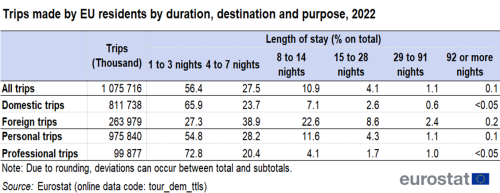
During 2022, EU residents made 1.1 billion trips with overnight stays - regardless of destination and duration (see Table 1). During these trips, 5.4 billion tourism nights were spent. Of these trips, 9.3 % were trips for professional purposes, while the remaining 90.7 % were trips made for personal purposes (see Figure 1). The highest number of trips were made by residents of France (229 million trips), followed by Germany (222 million trips) and Spain (138 million trips). The trips made by the residents of these three countries accounted for more than half (54.8 %) of all EU residents' trips.
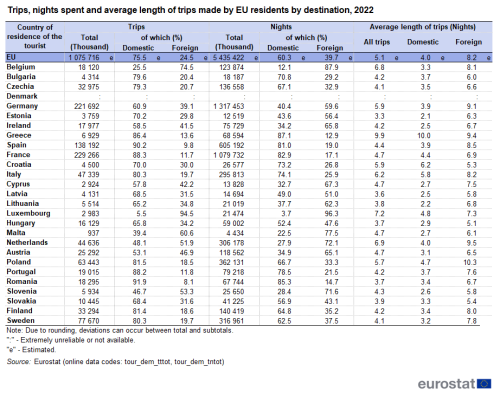
On average for the EU, three out of four (75.5 %) trips were domestic trips. More than nine out of ten trips made by residents of Romania (91.9 %) and Spain (90.2 %) had a main destination inside their own country. In five Member States foreign trips accounted for more than half of all tourism trips: Luxembourg (94.5 %), Belgium (74.5 %), Malta (60.6 %), Slovenia (53.3 %) and the Netherlands (51.9 %).
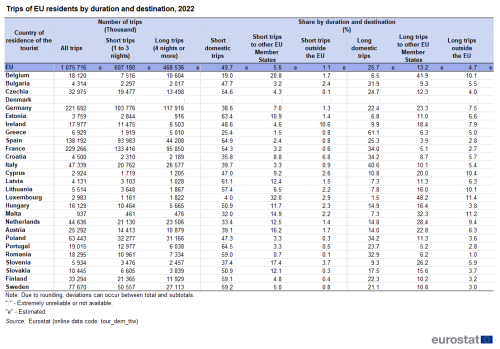
Τourism trips made in the course of 2022 were dominated by short domestic breaks of one to three overnight stays (49.7 % of all tourism trips, see Table 2). Trips of four nights or more accounted for 43.6 % of all tourism trips (25.7 % with a domestic destination and 17.8 % with a destination outside the country of residence).
Europeans prefer trips inside their own country of residence
Although EU residents spent most of their trips inside their own country, nearly two out of three of these domestic trips were short breaks of one to three overnight stays (see Table 3). Given the relatively short duration of domestic trips (on average 4.0 nights, as compared to 8.2 nights for foreign trips, see Table 1), the proportion of nights spent on domestic trips within all tourism nights was - at 60.3 % - lower than the 75.5 % share of domestic trips in all tourism trips. The highest number of domestic trips was in France, with more than 202 million accounting for 24.9 % of all domestic trips made by Europeans. As regards foreign trips, German tourists came on top, with nearly 87 million foreign trips (32.8 % of all foreign trips made by Europeans).
The EU is an attractive destination for its residents
More than three out of four foreign trips had as main destination another EU Member State, accounting for 202 million trips out of a total of 264 million foreign trips. Taking into account the 812 million domestic trips, this means that 94.2 % of all trips with overnight stays that EU residents made in 2022 were within the European Union. Even when restricting the analysis to longer trips of at least four overnight stays – more likely to be further away from home – 89.2 % were spent within the EU. Only in four Member States was the share of trips outside the EU 13 % or more: Ireland (18.5 %), Luxembourg (14.2 %), Malta (13.4 %) and Cyprus (13.0 %) (see Table 2). There is more detailed information on the destinations EU residents chose for their trips in a separate article.
84 % of all trips made in 2022 lasted a maximum of one week
In 2022, 56.4 % of the tourism trips that EU residents made were short, taking a maximum of three overnight stays (see Table 2 and Figure 2). More than two out of three trips made by residents of Estonia, Latvia, Portugal and Spain were short trips. In seven Member States, the number of long trips exceeded the number of short trips: Greece (72.3 %), Luxembourg (61.1 %), Belgium (58.5 %), Italy (56.1 %), Germany (53.2 %), the Netherlands (52.7 %) and Malta (50.8 %).
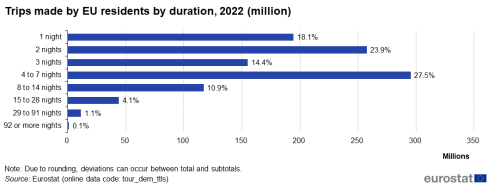
The share of trips that lasted a maximum of one week was obtained by adding the short trips of one to three nights (56.4%) with the trips lasting four to seven nights (27.5 %), resulting in a dominant share of 83.9 % of all trips made in 2022 (if we consider only trips for professional purposes this share was 93.2 %). While only 10 % of the domestic trips were longer than one week, this was the case for 34 % of the trips abroad. Only 5.2 % of all trips were longer than two weeks (see Table 3).
Less than one in ten trips is for professional purposes
More than half of the tourism trips (52.6 %) had holidays, leisure and recreation as the main purpose, and almost one out of every three trips (32.3 %) were to visit relatives and friends. The latter accounted for a big share of short trips and of domestic trips (see Figure 1). In total, – including other purposes such as pilgrimages or health treatment – trips for personal purposes made up 90.7 % of all tourism trips in 2022.
In 2022, EU residents made 100 million trips for professional purposes (e.g. business trips), representing 9.3 % of the total number of tourism trips. Most of these trips were domestic (74.9 %) and had a duration of maximum 3 nights (72.8 %).
Over half of all overnight stays are in rented accommodation
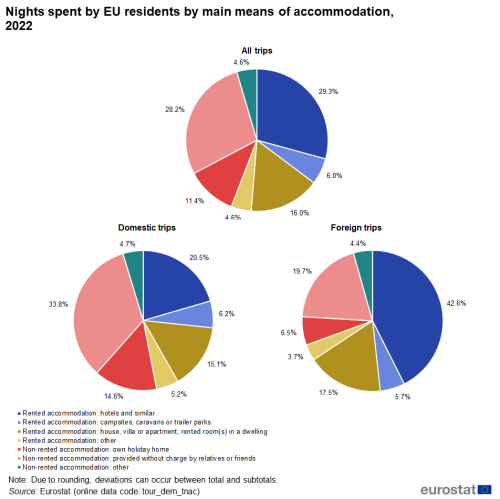
EU residents made a total of 5.4 billion overnight stays during tourism trips in 2022 (see Table 1). More than half of these nights (55.9 %) were spent in rented accommodation, while 44.1 % were spent in non-rented accommodation (see Figure 3). Hotels or similar accommodation providing services such as daily cleaning and bed-making came on top with 29.3 %, followed by accommodation provided without charge by relatives or friends with 28.2 %, while 16.0 % were spent at a rented house, villa, apartment or rented room(s) in a dwelling.
Rented accommodation was more prevalent for foreign trips (69.4 %), while tourists travelling within their own country were more likely to stay at non-rented accommodation (53.1 %), provided mainly for free by friends or relatives (33.8 %).
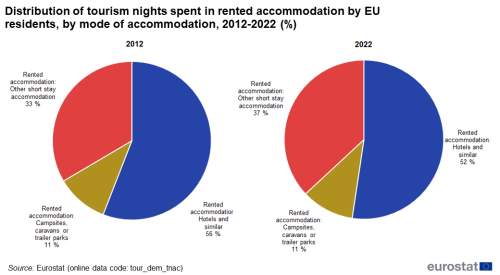
Looking only at nights spent in rented accommodation, in 2022 EU residents spent more than half of these tourism nights (52.4 %) in hotels (or similar), close to 2012 level (55.9 %). More than one out of three nights (36.9 %) were spent in rented accommodation other than hotels or campsites (see Figure 4).
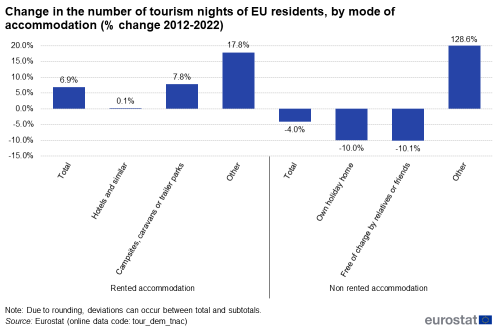
The segment of rented accommodation recorded an increase compared to 2012 (6.9 %), with the highest increase recorded for the category other than hotels or campsites (17.8 %). This latter category includes, among others, holiday dwellings, rented rooms in family houses and short-stay accommodation offered via online collaborative economy platforms. Non-rented accommodation decreased by -4.0 % in all but one category, other (128.6 %), which is a small segment of tourist accommodation (see Figure 5).
In 2022, EU residents spent an estimated EUR 168 billion on tourist accommodation (For more detailed information on tourism expenditure, see separate article).
More than one in eight trips of Europeans are made by train
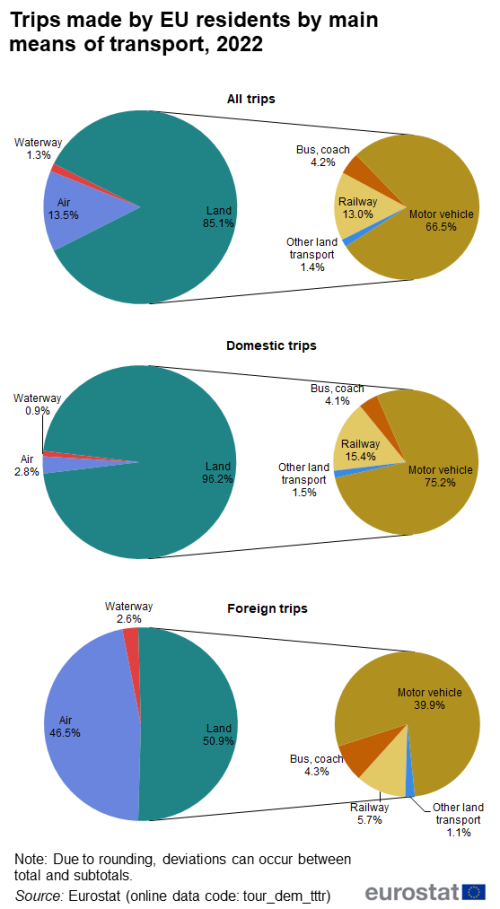
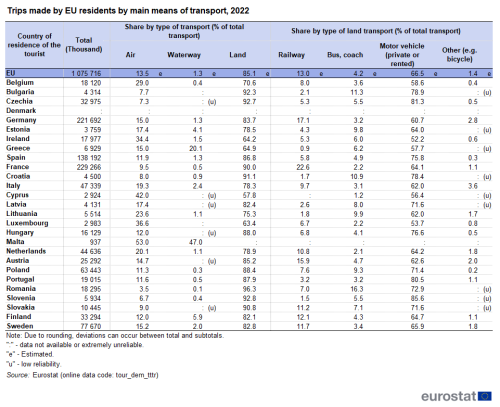
Motor vehicles (private or rented) were the main means of transport for 66.5 % of all trips, followed by air transport and railway (13.5 % and 13.0 %, respectively) (see Figure 6). Other modes of transport were relatively insignificant, though it is important to note that this pattern can be very different at country level. Waterways were the main means of transport for 47.0 % of trips made by residents of Malta and 20.1 % of trips made by Greek residents, while residents of Bulgaria, Estonia, Croatia, Lithuania, Poland and Romania took buses for more than 9 % of their trips (see Table 4).
Motor vehicles were the preferred means of transport for domestic trips (75.2 %), followed by rail (15.4 %) and bus (4.1 %). For foreign trips the preferred means of transport was airplane (46.5 %), followed by motor vehicles (39.9 %) and rail (5.7 %).
In 2022 tourism continued to recover from the Covid-19 crisis
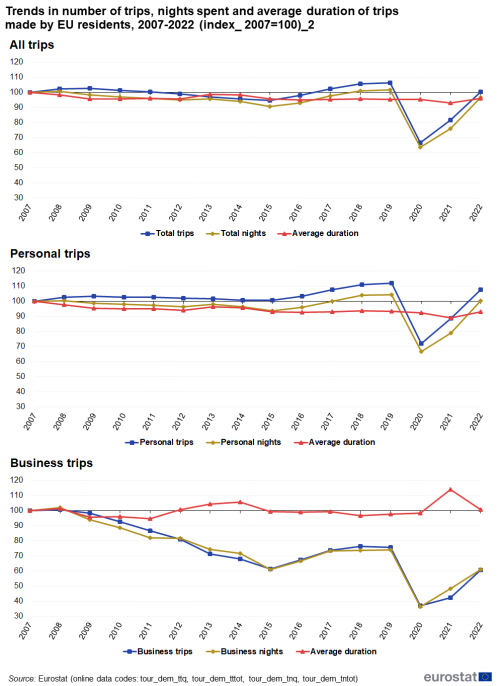
The main trends in tourism by EU residents for the period 2007-2022 are shown in Figure 7. Overall, the 2008-09 global economic crisis did not strongly affect EU residents' tourism. Following slight drops each year between 2009 and 2015, in 2016 the number of trips and nights spent started recovering and regained the levels existing prior to the economic crisis. In 2019 compared with 2007, the number of trips and nights spent increased by 6.4 % and 1.5 % respectively. However, tourism has developed very differently depending on whether the trips were made for personal or professional purposes. The Covid-19 crisis strongly affected EU residents’ tourism in 2020, with drops of 37% in the number or trips and the number of nights and even higher drops for business trips, compared to the previous year. The slow recovery started in 2021, when the number of trips increased by 22.6% compared to 2020, while the number of nights increased by 19.6% during the same period. The recovery continued in 2022, when the number of trips increased by 23.1% compared to 2021 and the number of nights increased by 26.9% during the same period. However, neither the number of trips, nor the number of nights reached pre-pandemic levels of 2019 (-5.5% in number of trips and -4.9% in number of nights). The business trips and nights recorded even slower recovery compared to personal trips and nights.
Source data for tables and graphs
Data sources
Collection of annual data on trips of EU residents
The collection consists of harmonised data collected by the Member States in the frame of the Regulation (EU) No 692/2011 of the European Parliament and of the Council concerning European statistics on tourism.
The scope of observation for data on tourism trips are all tourism trips with at least one overnight stay, made by the resident population aged 15 and over. It includes trips made for private or professional purpose, outside the usual environment.
Context
The EU is a major tourist destination, with four Member States among the world’s top ten destinations for holidaymakers, according to UNWTO[1] data. Tourism is an important activity in the EU which has the potential to contribute towards employment and economic growth, as well as to development in rural, peripheral or less-developed areas. These characteristics drive the demand for reliable and harmonised statistics within this field, as well as within the wider context of regional policy and sustainable development policy areas.
Direct access to
- Tourism trips of Europeans (online publication)
- All articles on tourism statistics
- Tourism (t_tour), see:
- Tourism (tour), see "Trips of EU residents - annual data":
- Tourism trips (tour_dem_tt)
- Tourism nights (tour_dem_tn)
- Trips of EU residents - annual data (ESMS metadata file — tour_dem_esms)
- With 2012 as reference year:
- Regulation (EU) No 692/2011 of 6 July 2011 concerning European statistics on tourism and repealing Council Directive 95/57/EC. (Summary)
- Regulation (EU) No 1051/2011 of 20 October 2011 implementing Regulation (EU) No 692/2011 concerning European statistics on tourism, as regards the structure of the quality reports and the transmission of the data.
- Previous legal acts (concerning reference periods before 2012):
- Directive 95/57/EC of 23 November 1995 on the collection of statistical information in the field of tourism
- Commission Decision 1999/35/CE of 9 December 1998 on the procedures for implementing Council Directive 95/57/EC on the collection of statistical information in the field of tourism.
- Commission Decision 2004/883/CE of 10 December 2004 adjusting the Annex to Council Directive 95/57/EC on the collection of statistical information in the field of tourism as regards country lists.
- Directive 2006/110/EC of 20 November 2006 adapting Directives 95/57/EC and 2001/109/EC in the field of statistics, by reason of the accession of Bulgaria and Romania
- Agenda for a sustainable and competitive European tourism (Communication from the European Commission, October 2007)
- European Commission - Directorate-General for Internal Market, Industry, Entrepreneurship and SMEs - Tourism
Notes