Tourism industries - economic analysis
Data extracted in March 2023
Planned article update: 29 April 2024
Highlights
Number of enterprises: evolution for different sectors of the economy, 2012-2020
This article presents the most recent available statistics on the tourism industries in the European Union (EU). While tourism statistics focus on either the accommodation sector (data collected from accommodation service providers) or the demand side (data collected from households), and relate mainly to physical flows (arrivals or nights spent at tourist accommodation or trips made by residents of a country), the analysis in this article is based on economic data extracted from other areas of official statistics, in particular, structural business statistics (SBS) and short-term business statistics (STS). Thus, a more complete economic analysis of the tourism sector or tourism ecosystem can be drawn, which is an important motor for many countries' economies and labour markets.
"International Recommendations for Tourism Statistics 2008" lists ten internationally comparable activities and two country-specific ones for the tourism sector, also called "tourism industries" or "tourism characteristic activities". This article focuses on a subset of these that has relevance for the EU (the other activities proved to be of limited relevance for European tourism or have limited coverage in SBS).
The reader is strongly encouraged to consult the "Data sources" section before using the presented data, in order to avoid overestimating or underestimating the economic importance of tourism for some industries.
Full article
Key economic indicators
The discussion below refers to four selected indicators: number of enterprises, number of persons employed, turnover and value added at factor cost – firstly at EU level, secondly at country level.
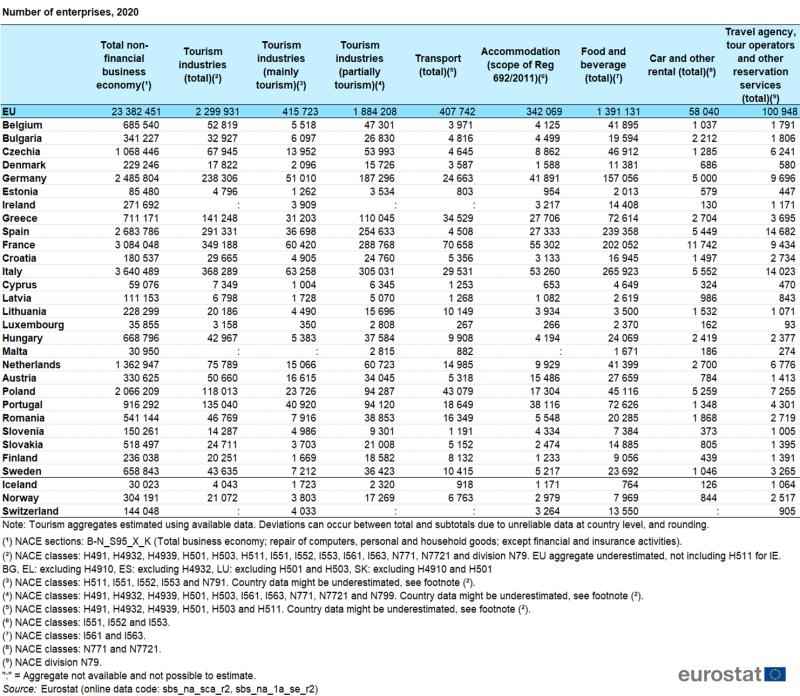
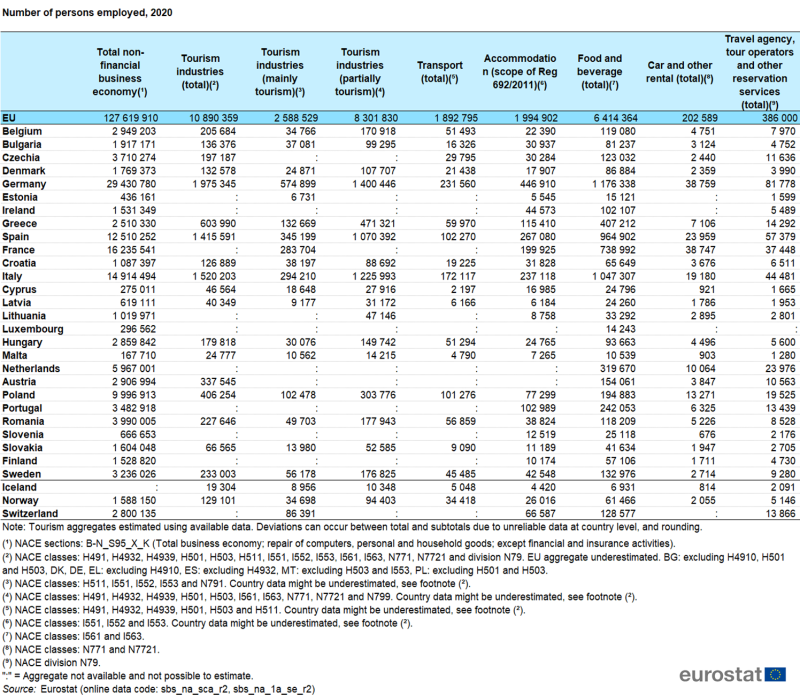
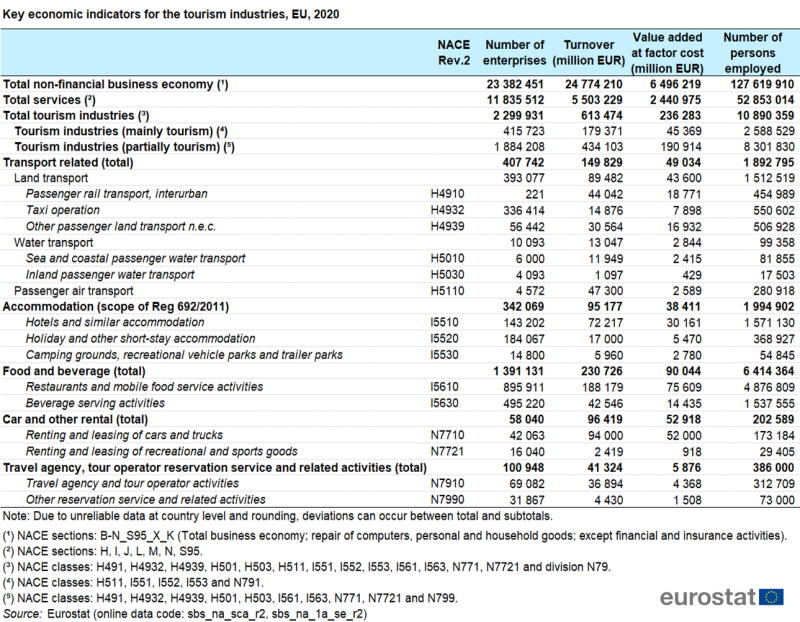
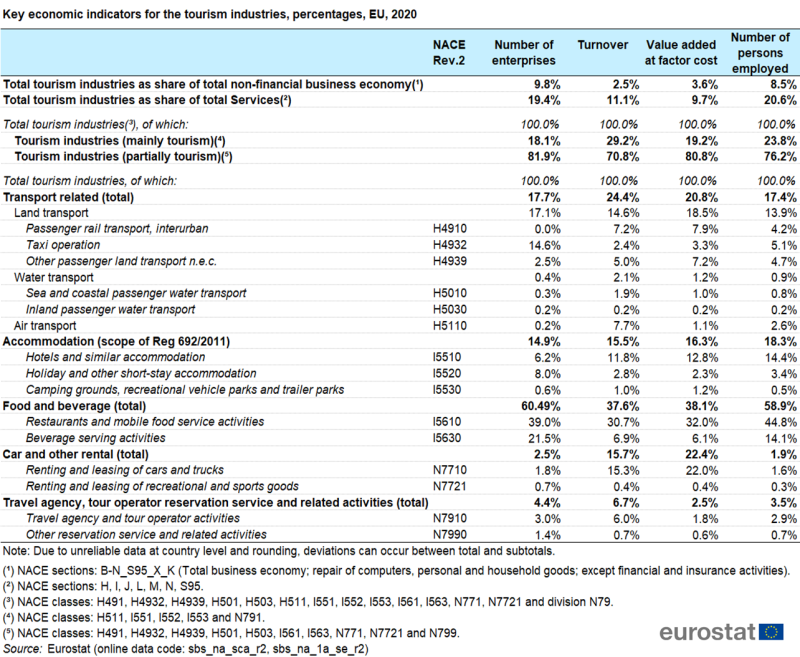
In 2020, almost one in ten enterprises in the EU non-financial business economy belonged to the tourism industries (see Table 1, Table 2). These 2.3 million enterprises employed 10.9 million persons, accounting for 8.5 % of the persons employed in the non-financial business economy and 20.6 % of persons employed in the services sector.
Source: Eurostat (sbs_na_sca_r2), (sbs_na_1a_se_r2)
Source: Eurostat (sbs_na_sca_r2), (sbs_na_1a_se_r2)
The tourism industries' shares of total turnover and value added at factor cost were relatively lower, with the tourism industries accounting for 2.5 % of the turnover and 3.6 % of the value added of the non-financial business economy. These figures very likely reflect - among other explanations - the higher share of micro, small and medium-sized enterprises and the level of part-time employment in many tourism industries.
As explained in the "Data sources" section, tourism industries do not provide services only to tourists. Their employment, turnover, etc., is also related to services provided to non-tourists. In Table 1 and Table 2, the subdivision "mainly tourism" and "partially tourism" takes this into account. For instance, 2.6 million persons are employed in "mainly tourism" industries (passenger air transport, accommodation services and travel agencies and tour operators) that are assumed to serve predominantly tourists, while 8.3 million persons are employed in "partially tourism" industries where the customers are likely to be a mix of tourists and non-tourists (e.g. restaurants).
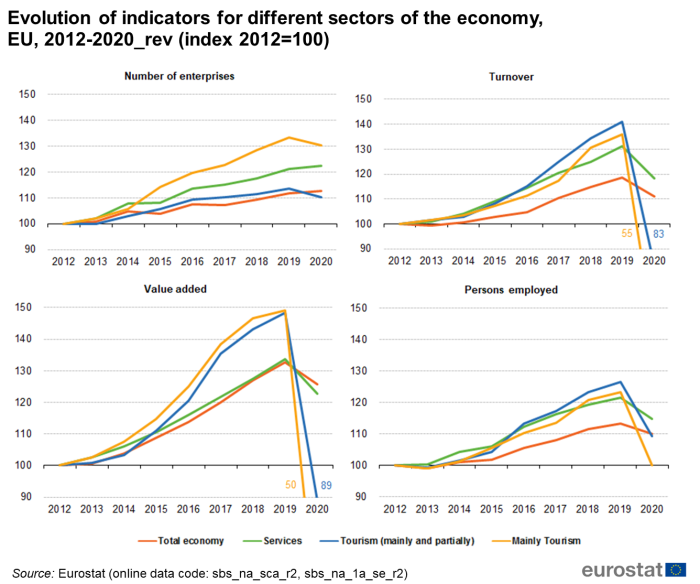
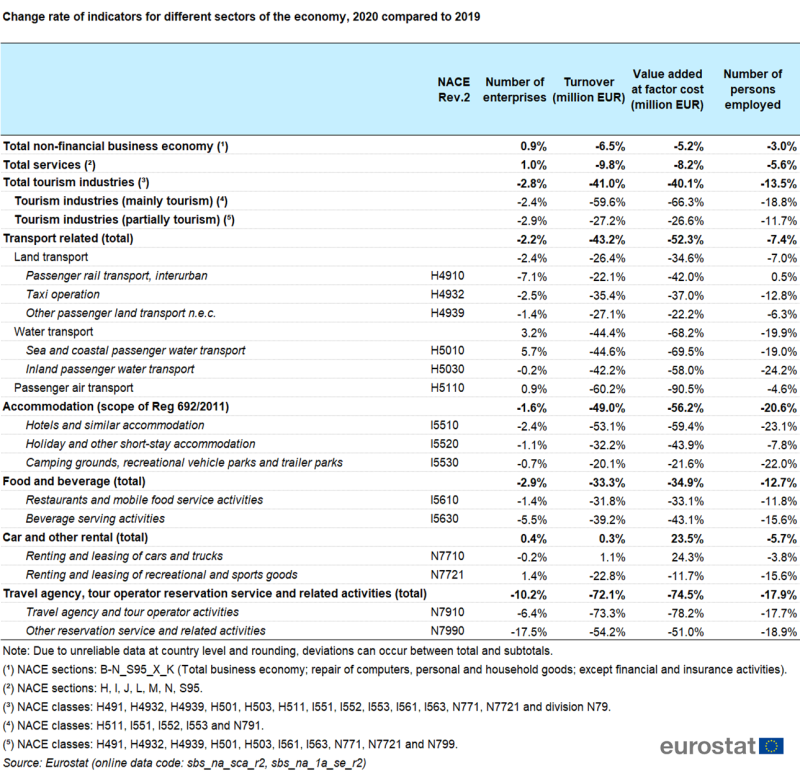
Figure 1 presents the growth of the sectors from 2012 to 2020. In the period up to 2019, tourism industries (mainly and partially) showed a much stronger growth than the total economy for all indicators concerned. But in 2020, the impact of the Covid-19 pandemic caused dramatic drops of the turnover and value added of the tourism industries (-41.0 % and -40.1 % respectively, comparing 2020 with 2019). The number of persons employed in the tourism industries and the number of enterprises dropped less strongly, but still recorded levels that were respectively 2.8 % and 13.5 % lower in 2020 compared with 2019) (see Table 3).
(index 2012=100)
Source: Eurostat (sbs_na_sca_r2), (sbs_na_1a_se_r2)
Source: Eurostat (sbs_na_sca_r2), (sbs_na_1a_se_r2)
Analysis by subsectors
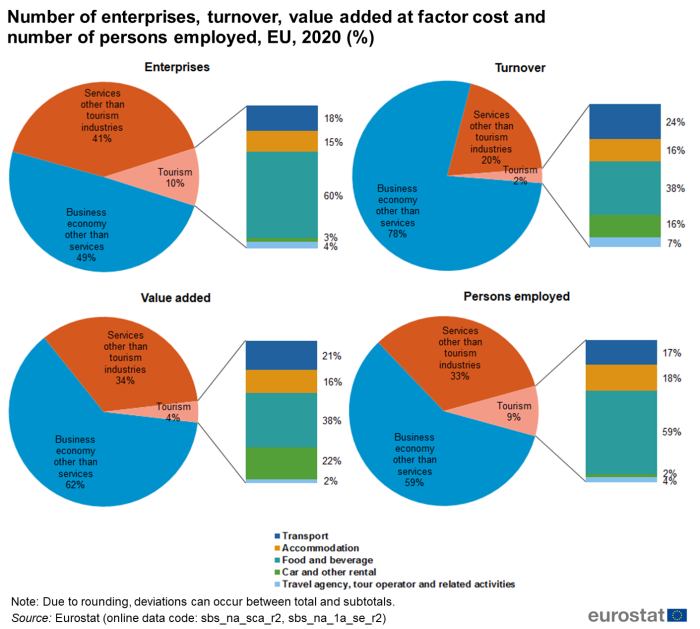
Three out of four enterprises in the tourism industries operated in accommodation (NACE I55) or food and beverage serving activities (NACE I56): 15 % and 60 %, respectively (see Table 1, Table 2, Figure 2). Looking at the number of persons employed, the weight of these activities was 77 % persons employed in the tourism industries. However, in terms of turnover and value added, their share was much lower (53 % and 54 %, respectively).
(%)
Source: Eurostat (sbs_na_sca_r2), (sbs_na_1a_se_r2)
The turnover of passenger transport related industries (parts of NACE H49, H50, H51) represented 24 % of the turnover for all tourism industries: 32 % of this share came from the subsector of passenger air transport (NACE H5110).
Travel agencies and tour operators (NACE N7910) and other related activities (NACE N7990) recorded a turnover of €41 billion in 2020, a decrease by €107 billion (-72 %) compared with 2019. These activities represented 7 % of the turnover in tourism industries, compared with a 4 % share in number of enterprises and employment, and a 2 % share in value added at factor cost.
Geographical analysis
More than half (54 %) of the 2.3 million enterprises in the tourism industries in the EU in 2020, were located in four Member States: 368 000 in Italy, 349 000 in France, 291 000 in Spain (not including taxi operation) and 238 000 in Germany (see Table 4).
Looking at the available EU Member States' data, in terms of employment (see Table 5), Germany (not including passenger inter-urban rail transport) was on top with 2.0 million persons employed in the tourism industries, followed by Italy (1.5 million) and Spain (1.4 million, not including taxi operation) (note that there is no data available for France).
The highest share of employment in the tourism industries was observed in Greece (24 % of the total non-financial business economy of the country), followed by Cyprus (17 %) (note that data on total employment in the tourism industries is missing for a significant number of countries).
The availability of country data on turnover and value added is also fragmented (see Table 6 and Table 7).
Turnover amounted to €117 billion for Germany (not including inter-urban passenger rail transport ), followed by Italy (€76 billion) and Spain (€59 billion, not including taxi operation) (note that there is no data available for France).
In terms of value added the first three countries were the same: Germany, with €56 billion (not including passenger rail transport), followed by Italy (€26 billion) and Spain (€19 billion, not including taxi operation) (note that there is no data available for France). The highest shares of value added in the tourism industries in the total non-financial business economy of the country were observed in Austria, Malta, Croatia, Cyprus and Greece (all above 4 %).
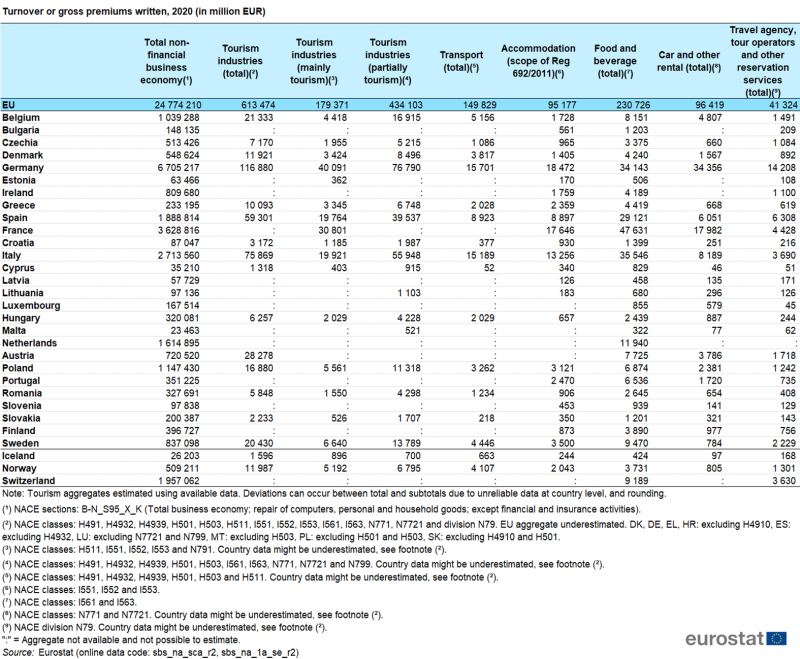
(million EUR)
Source: Eurostat (sbs_na_sca_r2), (sbs_na_1a_se_r2)
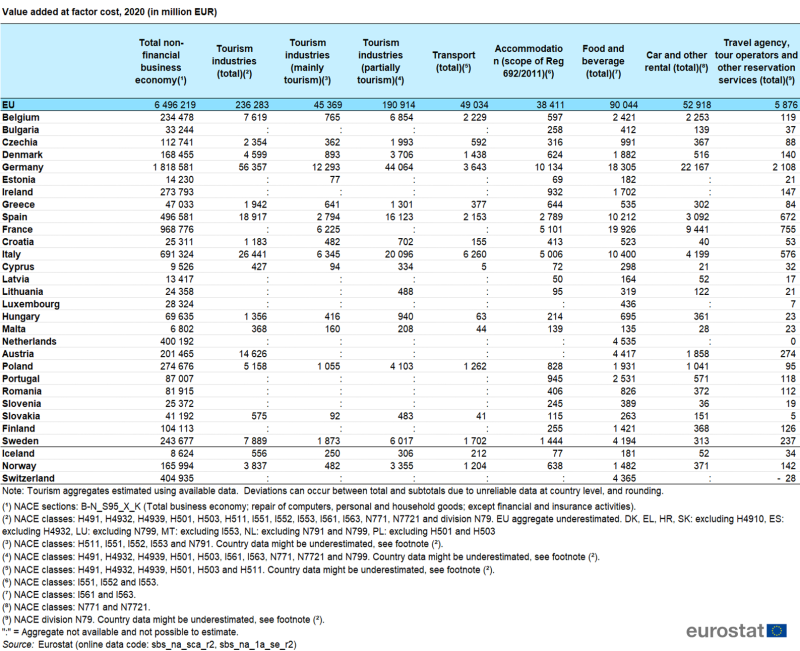
(million EUR)
Source: Eurostat (sbs_na_sca_r2), (sbs_na_1a_se_r2)
Infra-annual analysis
The above analysis was based on structural business statistics (SBS). While SBS is a rich and comprehensive source of information on European businesses, these statistics are only provided annually. Compared with other sectors of the economy, the tourism sector has a relatively strong seasonal component, hence the need to look at infra-annual data to complete the analysis. Short-term business statistics provide monthly and quarterly indices for a subset of tourism industries. For the analysis in this article, an aggregate was created including NACE divisions H51 (Air travel), I55 (Accommodation) and N79 (Travel agency, tour operator and other reservation service and related activities).
Figure 3 shows for the EU above mentioned tourism industries, the quarterly evolution of the turnover, seasonally adjusted or working days adjusted, for the years 2007 to 2022 (index: average 2015 = 100). The graph shows a positive trend that was interrupted from the fourth quarter of 2008 (global financial crisis) until mid-2010 when the turnover started to increase again. The upwards trend continued until spring 2020. After the travel restrictions implemented in March and April 2020 in response to the Covid-19 outbreak, the turnover of tourism industries dropped sharply in the second quarter of 2020. In spring and summer 2021 many restrictions were raised and travelling became easier. In 2022 the turnover shows clear signs of recovery, reaching and even surpassing the pre-pandemic levels.
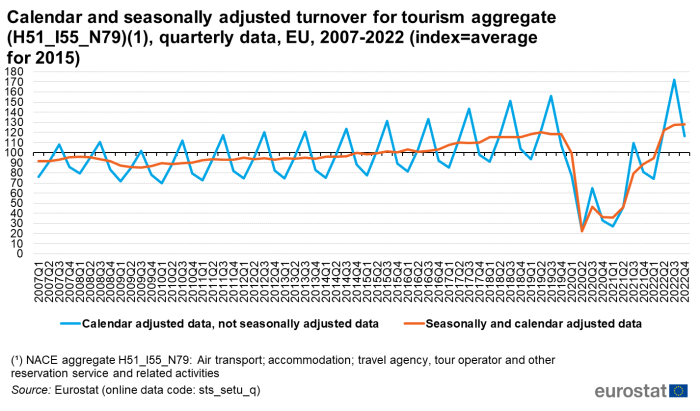
(index=average for 2015)
Source: Eurostat (sts_setu_q)
The overall situation at EU level shown in Figure 3 aggregates data from countries with a very different seasonal profile. Figure 4 shows, for the years 2015 to 2022, the quarterly working days adjusted turnover for the above mentioned group of tourism industries for the countries which present the highest (Cyprus and Greece) and the lowest (Belgium and Luxembourg) seasonality in terms of turnover, as well as for the EU as a whole. Note that the atypical pattern for Luxembourg, with continued growth in 2020-2022, was mainly driven by the growth in the non-tourism related activity "freight air transport and space transport" (unpublished data).
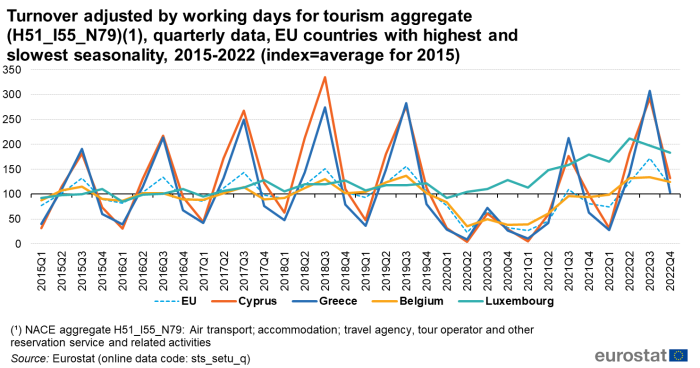
(index=average for 2015)
Source: Eurostat (sts_setu_q)
Figure 5a focuses on 2022 and shows a clear recovery in the turnover in these tourism industries. At EU level, the highest increases compared with the same periods of 2021 were recorded in the first quarter, when the turnover increased by 175 % compared with the first quarter of 2021. The turnover increased also in the next quarters: +167 % in the second quarter, +57 % in the third quarter and +44 % in the fourth quarter. The big increases in the first two quarters of 2022 reflect the relatively low activity levels in the first two quarters of 2021. The lower increases in the second half of the year can be explained by the recovery starting already in 2021 (see Figure 5b). The highest increases in the second half of 2021 were Cyprus, Spain and Greece.
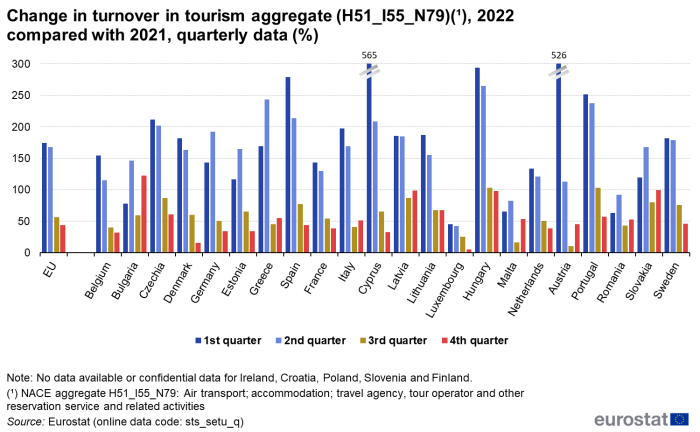
(%)
Source: Eurostat (sts_setu_q)
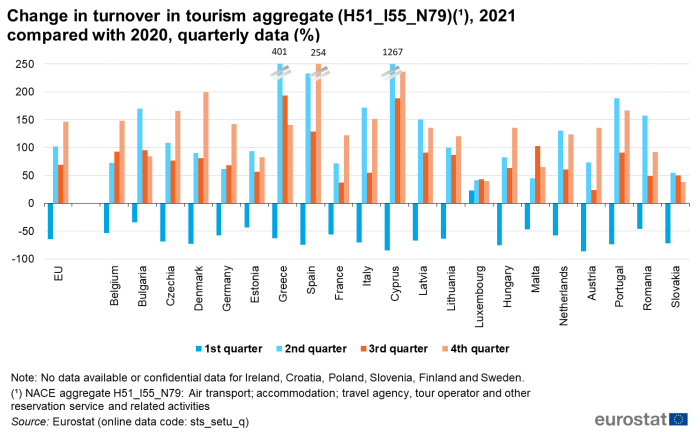
(%)
Source: Eurostat (sts_setu_q)
Figure 6 shows for the period January 2015 to December 2022, the monthly evolution of the working days adjusted turnover in EU accommodation, and the nights spent in tourist accommodation establishments (index: average 2015 = 100). As expected, the two series follow a similar pattern in terms of peak and trough periods; however, the variability appears to be more pronounced for the physical flows (nights spent) as compared with the monetary flows (turnover). This graph clearly shows the sharp drop in March and April 2020 when many hotels were closed. Despite the partial recovery during the summer months of 2020, the turnover and the nights spent in tourist accommodation remained at very low levels compared with the previous years. The first signs of recovery appeared in May 2021, while in April 2022 the turnover reached the pre-pandemic levels.
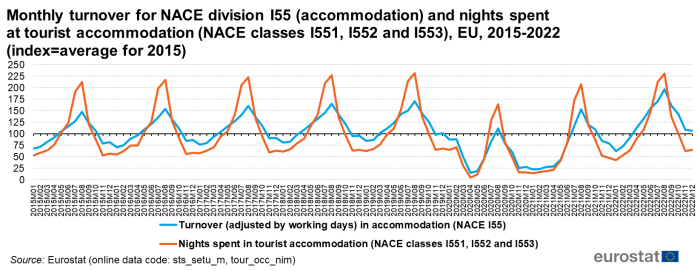
(index=average for 2015)
Source: Eurostat (sts_setu_m), (tour_occ_nim)
Data sources
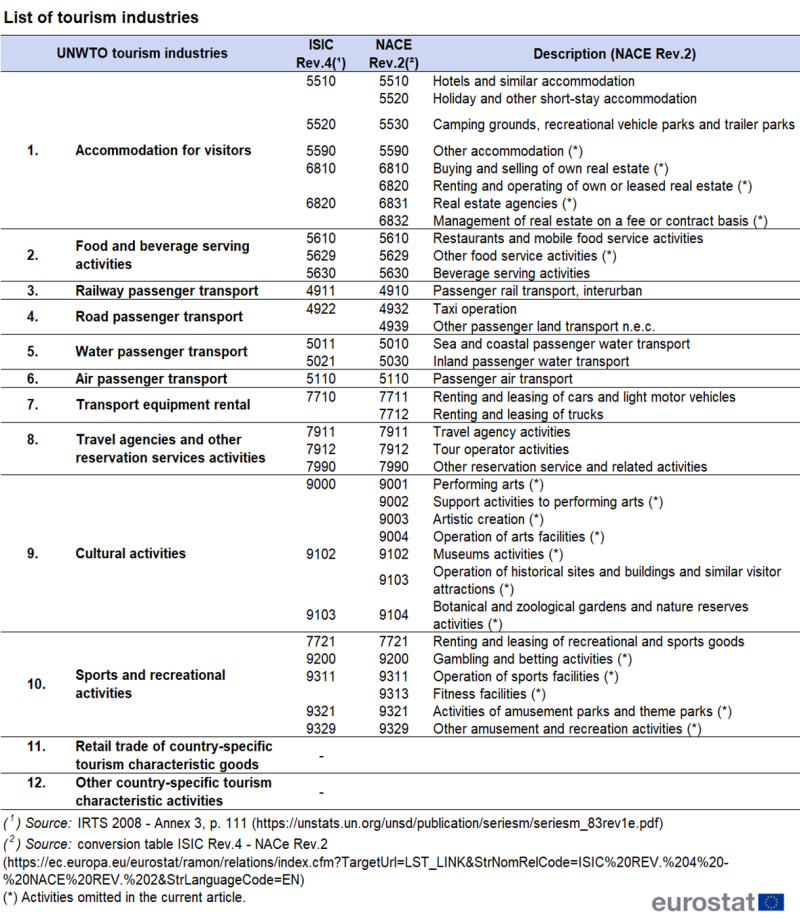
Structural business statistics (SBS) are a main component of business statistics in the European Statistical System (ESS) and describe the structure, main characteristics and performance of economic activities across the European Union. Data is available at a detailed level of economic activities, which allow for the identification and selection of industries that are part of the tourism sector. According to the International Recommendations for Tourism Statistics 2008 the tourism sector (also: 'tourism industries' or 'tourism characteristic activities') includes ten internationally comparable activities and two country-specific activities – this article focuses on the former. An overview of these activities (and the corresponding codes in the international classifications ISIC and NACE) is given in Table 8. All these activities are covered by SBS, except for culture, sports and recreation.
This article uses a fine-tuned list of the tourism industries, better adapted to the European setting and avoiding overestimations of the economic variables. Activities omitted include "other accommodation" (NACE 5590), "other food service activities" (NACE 5629) and "real estate activities" (NACE 68), these activities are not sufficiently related to tourism to justify their inclusion in the current analysis.
Existing business statistics (SBS, STS) cannot distinguish between services provided to tourists and to non-tourists – typical examples include restaurants catering to tourists but also to locals and railway passenger transport used by tourists as well as by commuters. For this reason, this analysis considers these industries in their totality. Considering the total turnover or employment overestimates the true economic importance of tourism for these industries, but on the other hand, tourism also contributes to other industries not listed in Table 8. The approach used in this article should not be confused with the methodological framework to compile tourism satellite accounts (TSA); the most recent Eurostat statistical report on TSA in Europe is available from the Eurostat website.
Notwithstanding these shortcomings, SBS data allow for an economic analysis of the sector which is not possible using only tourism statistics. A second relevant source within existing business statistics is short-term business statistics (STS). STS can fill the gap of information on turnover or prices where monthly accommodation statistics are limited to evolutions in flows of tourists. As a trade-off with its strong timeliness, STS is available with a lower granularity of activities for services; as a consequence the further analysis of monthly economic indicators focuses on air transport (NACE H51), accommodation (NACE I55) and travel agency, tour operator reservation service and related activities (NACE N79).
Source data for tables and graphs
Context
Following its communication "A new industrial strategy for Europe" (March 2020), the Commission will systematically analyse the risks and needs of different industrial ecosystems. The notion of ecosystem captures the complex set of interlinkages among sectors and firms spreading across countries in the Single Market. Ecosystems encompass all players operating in a value chain: from the smallest start-ups to the largest companies, from academia to research, together with the forces that shape the market environment in which they operate.
Tourism is one of the 14 ecosystems identified, each with its own set of sectors that should cover the entire economic industrial landscape. The tourism ecosystem is a network of globalised and interconnected value chains of both online and offline tourism services providers, where small companies operate along with large multinational corporations.
The green transformation of industry supported by the Strategy will reduce the environmental footprint of our industrial activities and empower industry to provide effective solutions for the societal challenges of the future such as sustainable tourism.
Tourism statistics focus on the accommodation sector on the one hand and the demand side (from households) on the other hand. ESS tourism statistics relate mainly to physical flows: arrivals or nights spent at tourist accommodation establishments or trips made by residents of a country.
This article presents economic data extracted from other areas of official business statistics, in particular structural business statistics (SBS) and short-term business statistics (STS), in order to provide users with a better economic analysis of this sector, which is an important motor for many countries' economies and labour market.
Direct access to
- Tourism (t_tour), see:
- Monthly data on tourism industries (t_tour_indm)
- Annual data on tourism industries (t_tour_inda)
- Tourism (tour), see:
- Monthly data on tourism industries (tour_indm)
- Annual data on tourism industries (tour_inda)
- Annual enterprise statistics for special aggregates of activities (NACE Rev. 2) (sbs_na_sca_r2)
- Annual detailed enterprise statistics for services (NACE Rev. 2 H-N and S95) (sbs_na_1a_se_r2)
- Trade and services (sts_ts)
- Services (sts_os)
- Commission Implementing Regulation (EU) No 1051/2011 of 20 October 2011 implementing Regulation (EU) No 692/2011 concerning European statistics on tourism, as regards the structure of the quality reports and the transmission of the data.
- Summaries of EU legislation: Tourism statistics
- Regulation (EU) No 692/2011 of the European Parliament and of the Council of 6 July 2011 concerning European statistics on tourism and repealing Council Directive 95/57/EC.
- Delegated Regulation (EU) 2019/1681 of 1 August 2019 amending Regulation (EU) No 692/2011 of the European Parliament and of the Council concerning European statistics on tourism, as regards the transmission deadlines and adaptation of Annexes I and II.
