Tertiary education statistics
Data extracted in July 2023.
Planned article update: September 2024.
Highlights
In the EU there were 18.5 million tertiary education students in 2021, of which 59 % were studying for bachelor's degrees.
In 2021, 22 % of tertiary education students in the EU were studying business, administration or law.
Within the EU, close to three-fifths (57.2 %) of all tertiary education graduates in 2021 were women. In all EU Member States, more women graduated from tertiary education than men.
In 2021, the most frequently awarded degree in the EU was for management and administration.
Tertiary education graduates in science, mathematics, computing, engineering, manufacturing and construction (STEM), 2021
This article presents statistics on tertiary education (levels 5–8 of the international standard classification of education – ISCED) in the European Union (EU) and forms part of an online publication on education and training in the EU.
Tertiary education – provided by universities and other tertiary educational institutions – follows secondary schooling. It is seen to play an essential role in society, by fostering innovation, increasing economic development and growth, and improving more generally the well-being of citizens. Some European universities are among the most prestigious in the world.
Many commentators predict that in the coming years there will be increased demand for highly skilled people. Driven by digital technology, jobs are becoming more flexible and complex. This has resulted in a growing number of employers seeking staff with the necessary capacities to manage complex information, think autonomously, be creative, use resources in a smart and efficient manner, as well as communicate effectively.
A relatively large number of students in tertiary education are internationally mobile and study abroad: an analysis of this phenomenon is available in a separate article.
Full article
Participation by level
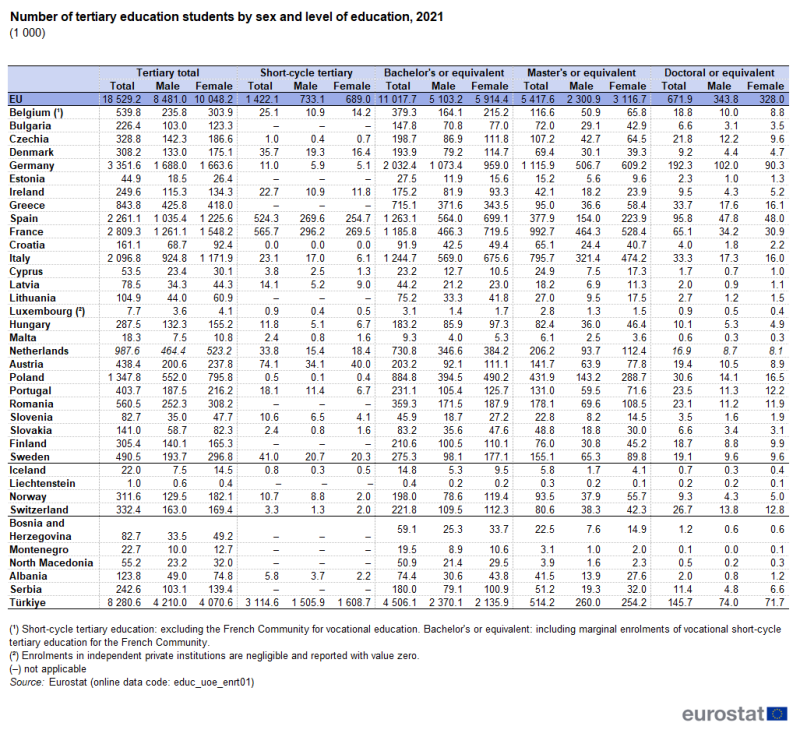
(1 000)
Source: Eurostat (educ_uoe_enrt01)
Table 1 presents data on the number of students in each of four levels of tertiary education. Bachelor's, master's and doctoral levels of tertiary education are found in all EU Member States, while short-cycle tertiary education, which is typically vocational (occupationally specific) and designed to prepare students for the labour market, is not part of the education system in Bulgaria, Estonia, Greece, Lithuania, Romania or Finland, nor in Liechtenstein, Bosnia and Herzegovina, Montenegro, North Macedonia or Serbia. It is also quite uncommon – accounting for 1.0 % or less of the total number of tertiary students – in several other EU Member States, namely Czechia, Germany, Croatia and Poland.
In the EU there were 18.5 million tertiary education students in 2021 (see Table 1). Germany – the most populous EU Member State – had 3.4 million tertiary education students, which was the highest number in the EU and equivalent to 18.1 % of the EU total. France (15.2 % of the total), Spain (12.2 %) and Italy (11.3 %) had the next largest tertiary student populations.
Among the 18.5 million tertiary education students in the EU:
- 7.7 % were following short-cycle tertiary courses;
- 59.5 % were studying for bachelor's degrees;
- 29.2 % were studying for master's degrees; and
- 3.6 % were studying for doctoral degrees.
Students of bachelor's and master's degrees accounted for 88.7 % of the total number of tertiary students in the EU in 2021. Notably higher shares for these two levels were reported for Poland (97.7 %), Croatia (97.5 %), Lithuania (97.4 %), Italy (97.3 %) and Bulgaria (97.1 %). Notably lower shares were recorded for Latvia (79.4 %), Austria (78.7 %), France (77.5 %), Luxembourg (76.4 %) and Spain (72.6 %).
Short-cycle tertiary courses were most common in Spain and France where they accounted for more than one-fifth of all tertiary students (23.2 % and 20.1 %, respectively); they were also relatively common in Latvia and Austria. In Türkiye, short-cycle tertiary courses were even more common as more than one-third (37.6 %) of all tertiary students were enrolled in such courses.
Luxembourg, France, Cyprus and Austria were the only EU Member States where fewer than 50 % of all tertiary students were studying for bachelor's degrees. By contrast, in the Netherlands the share of tertiary students who were studying for bachelor's degrees was 74.0 % and this share peaked at 84.8 % in Greece.
Greece had the lowest share of tertiary students studying for master's degrees in 2021, around one-tenth (11.3 %) of all tertiary students. This share was also below one-fifth in Spain and Ireland. By contrast, the highest shares (around two-fifths) were recorded in Croatia (40.4 %) and Cyprus (46.4 %).
Germany had a relatively high share of tertiary students studying for doctoral degrees in 2021 (5.7 % compared with the EU average of 3.6 %). In line with the fact that Germany had the highest total number of tertiary students among the EU Member States, it also had, by far, the highest number of students studying for doctoral degrees (192 300) – see Table 1. This was about twice the number of students studying for a doctoral degree in any of the other EU Member States; the next highest counts were recorded in Spain (95 800) and France (65 100). Although France had the second highest total number of tertiary students among the Member States, at 2.3 % the share of students studying for doctoral degrees in France was below the EU average. By far, the highest share of tertiary students studying for doctoral degrees in 2021 among the EU Member States was in Luxembourg (12.2 %) as the next highest share was in Czechia (6.6 %). The lowest shares of doctoral students in the total number of tertiary education students were observed in the Netherlands (1.7 %) and Italy (1.6 %).
Participation in tertiary education by sex
In 2021, women accounted for 54.2 % of all tertiary students in the EU. The share of women among tertiary students was:
- 48.4 % for those following short-cycle tertiary courses,
- 53.7 % for those studying for bachelor's degrees,
- 57.5 % for those studying for master's degrees, and
- 48.8 % for those studying for doctoral degrees.
As such, the majority of short-cycle tertiary students and doctoral students were men, while the majority of bachelor's and master's students were women.
In 2021, three-fifths (60.5 %) of all tertiary students in Sweden were women, while the share was close to this level in Malta, Poland and Estonia. Women were also in a majority among tertiary students in all of the other EU Member States except for Germany (49.6 %) and Greece (49.5 %). In Türkiye and Liechtenstein, female tertiary students were also in a minority, 49.2 % and 40.0 %, respectively.
- For short-cycle courses, 11 out of 21 EU Member States in which such courses exist had more male than female students in 2021.
- For bachelor's degrees, Cyprus, Germany and Greece were the only EU Member States where there were more men than women studying at this educational level in 2021. The highest share of female students among those studying for bachelor's degrees was recorded in Sweden (64.3 %).
- Among students studying for master's degrees, women were in the majority in 2021 in all of the EU Member States. The highest female share was recorded in Cyprus, where women accounted for more than two-thirds (69.7 %) of the total number of students, as was also the case in Poland (66.8 %).
- Women were in a majority among doctoral level students in 16 of the EU Member States, despite the fact that men made up the majority of doctoral students in the EU as a whole (the EU average share for men was 51.2 %). The highest share for women was in Cyprus (58.9 %) while the highest share for men was in Luxembourg (56.8 %).
Participation in tertiary education by field of education
(%)
Source: Eurostat (educ_uoe_enrt03)
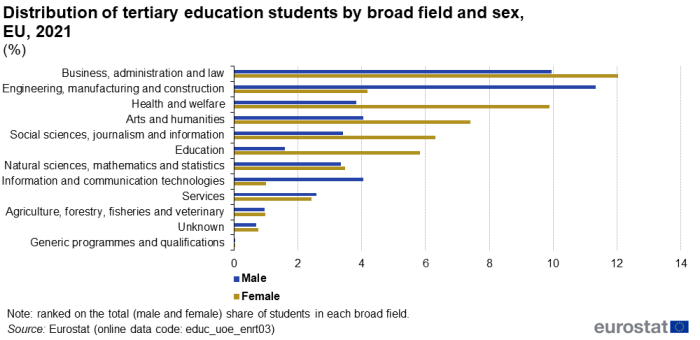
Across the EU, more than one-fifth (22.0 %) of all students in tertiary education in 2021 were studying business, administration or law. Women accounted for a majority of the total number of students within this field of education – see Figure 1. The second most common field of education was engineering, manufacturing and construction which accounted for 15.5 % of all tertiary education students. In this field, almost three-quarters (73.1 %) of all students were male. Some 24.8 % of all male tertiary education students were studying engineering, manufacturing or construction. The third largest field of study was health and welfare, with a 13.7 % share of all tertiary education students. Women accounted for a large majority (72.1 %) of the total number of tertiary students in this field. The only other field of study to account for a double-digit share (11.4 %) of tertiary education students was arts and humanities, where women also accounted for a large majority (64.7 %) of the total number of tertiary students in this field.
Among the remaining fields of study shown in Figure 1, there was a relatively high share of female students among those studying education or social sciences, journalism and information. By contrast, there was a relatively high share of men studying information and communication technologies.
Participation in tertiary education by type of institution
(%)
Source: Eurostat (educ_uoe_enrt01)
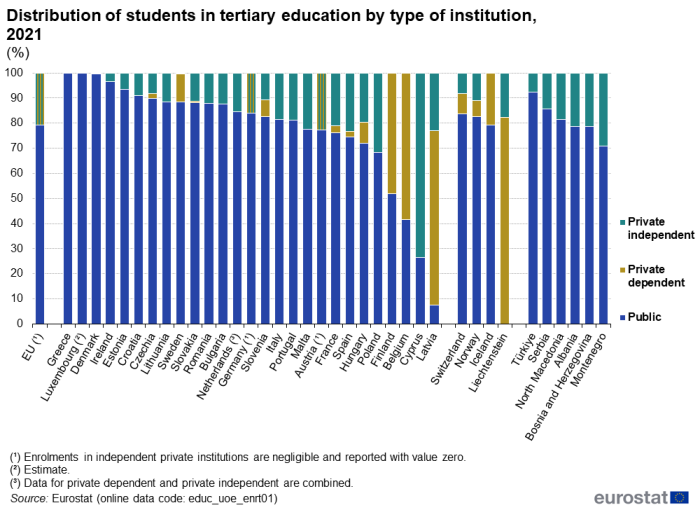
In the EU, the vast majority (79.2 %) of tertiary education students in 2021 were taught in public institutions [1] – see Figure 2.
- In 2021, all tertiary education students were studying in public institutions in Greece and Luxembourg.
- In 23 EU Member States (including Greece and Luxembourg), at least two-thirds of tertiary education students were studying in public institutions in 2021.
- A somewhat lower majority of tertiary education students were studying in public institutions in 2021 in Finland (51.8 %).
- In three Member States, a minority of tertiary education students were studying in public institutions in 2021:
- in Belgium, the share was just over two-fifths, with students in private institutions almost exclusively in government-dependent private institutions;
- in Cyprus, the share was around one-quarter, with students in private institutions exclusively in independent private institutions;
- in Latvia, the share was less than one-tenth, with students in private institutions mainly in government-dependent private institutions, although independent private institutions did account for nearly one-quarter of all tertiary students.
Graduates
(number per 100 men)
Source: Eurostat (educ_uoe_grad09)
In 2021, approximately 4.3 million students graduated from tertiary education in the EU. France (884 000) had the largest number of tertiary graduates, some way ahead of Germany (646 800) which had the next largest number. The relatively high number of graduates in France may, at least to some extent, reflect a shorter average course length.
As noted above, the majority of short-cycle tertiary students and doctoral students in 2021 in the EU were men, while the majority of bachelor's and master'’s students were women. The gender difference among tertiary students is reflected to some extent in the data for tertiary graduates.
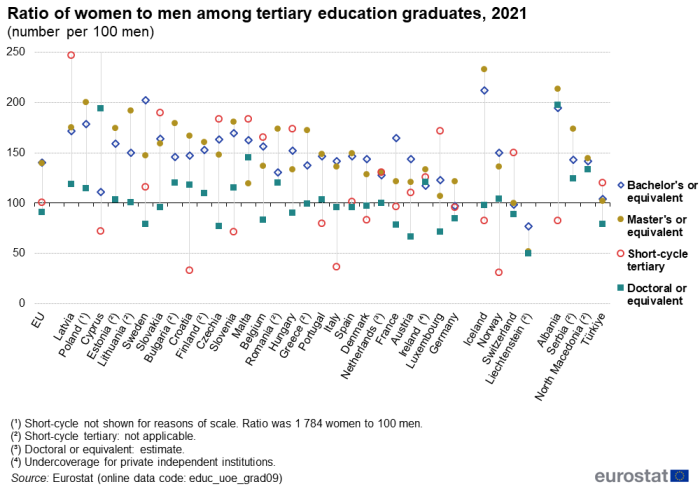
- Despite men being in the majority among the short-cycle tertiary student population, there were slightly more women than men graduating, with a ratio across the EU of 101 women for every 100 men.
- The ratio of women to men among graduates was highest for graduates of bachelor's and master's levels: there were 140 women who were graduates from bachelor's or equivalent courses for every 100 men; for master's or equivalent courses the ratio was also 140 women for every 100 men.
- The majority of doctoral or equivalent students were men and this was reinforced in terms of the number of graduates. There were 91 women among doctoral or equivalent graduates for every 100 men.
Among the EU Member States, the highest ratios of women to men among tertiary graduates in 2021 were observed in Latvia and Poland (both 185 women for every 100 men) and Cyprus (178 women for every 100 men). In all Member States, there were more women who graduated from tertiary education than men: the lowest ratio was in Germany (104 women for every 100 men). Among the non-EU countries included in Figure 3, there were marginally fewer women who graduated from tertiary education than men in Switzerland (99 women for every 100 men), while in Liechtenstein, men were in a clear majority (66 women for every 100 men).
(%)
Source: Eurostat (educ_uoe_grad02)
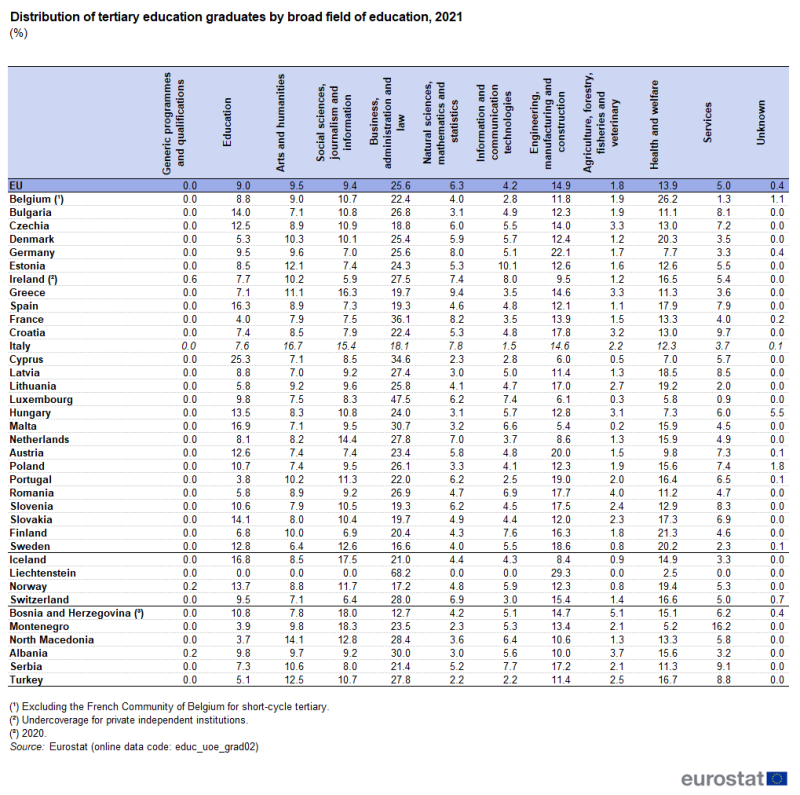
In 2021, an analysis of the number of graduates in the EU by field of education shows that one-quarter (25.6 %) of all tertiary students had graduated in business, administration or law. The next two largest fields were engineering, manufacturing and construction (14.9 %) and health and welfare (13.9 %), followed by arts and humanities, social sciences, journalism and information, and education, all of which had shares just under 10.0 %.
For several fields of education, there was a remarkable variability in the distribution of tertiary graduates in 2021 across the EU Member States.
- The proportion of graduates in business, administration and law ranged from 16.6 % in Sweden to 47.5 % in Luxembourg.
- For engineering, manufacturing and construction studies, the share of all graduates was below 10.0 % in five Member States, with Malta recording the lowest share (5.4 %). By contrast, Austria (20.0 %) and Germany (22.1 %) reported the highest shares.
- A similar situation was observed for graduates in health and welfare. The share of all graduates was below 10.0 % in five Member States, with Luxembourg recording the lowest share (5.8 %). By contrast, Sweden (20.2 %), Denmark (20.3 %), Finland (21.3 %) and Belgium (26.2 %) reported shares of more than one-fifth.
- The share of tertiary graduates from the education field was below 5.0 % in Portugal (3.8 %) and France (4.0 %), while a share of 25.3 % was recorded for Cyprus.
- Larger gaps (in relative terms) between the highest and lowest shares were observed for some of the smaller fields, most notably for agriculture, forestry, fisheries and veterinary where the 4.0 % share in Romania was 17.1 times as high as the 0.2 % share in Malta.
(%)
Source: Eurostat (educ_uoe_grad02)
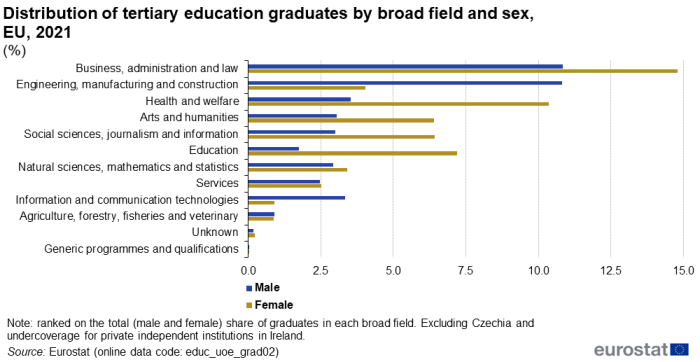
Figure 4 extends the analysis of Table 2 by presenting not only an analysis by broad field of education, but also by the sex of the graduates. An analysis by sex of tertiary education graduates (as shown in Figure 4) is, unsurprisingly, quite similar to that for tertiary education students (as shown in Figure 1).
Within the EU, close to three-fifths (57.2 %) of all tertiary education graduates in 2021 were women.
- Some 14.8 % of all tertiary graduates were women graduating from business, administration and law, while 10.8 % were men from the same field. Equally, around one-tenth of graduates were men from engineering, manufacturing and construction (10.8 %) and another tenth were women graduating from health and welfare (10.4 %).
- Women outnumbered men among graduates from all fields except for i) engineering, manufacturing and construction, ii) information and communication technologies and iii) agriculture, forestry, fisheries and veterinary.
- Women outnumbered men among graduates from all fields where they also outnumbered men among students, with the exception of agriculture, forestry, fisheries and veterinary.
- Men outnumbered women among graduates from all fields where they also outnumbered women among students, with the exception of services.
Leaving aside the very small field of 'generic programmes and qualifications', the analysis by sex of students and graduates from different fields varied most for social sciences, journalism and information as well as for arts and humanities – compare Figure 1 with Figure 4. In these two fields, there were 1.8 times as many female as male students, but 2.1 times as many women as men among the graduates. In nearly all fields, the ratio of women to men was higher among graduates than among students: agriculture, forestry, fisheries and veterinary was the only exception.
(1 000)
Source: Eurostat (educ_uoe_grad02)
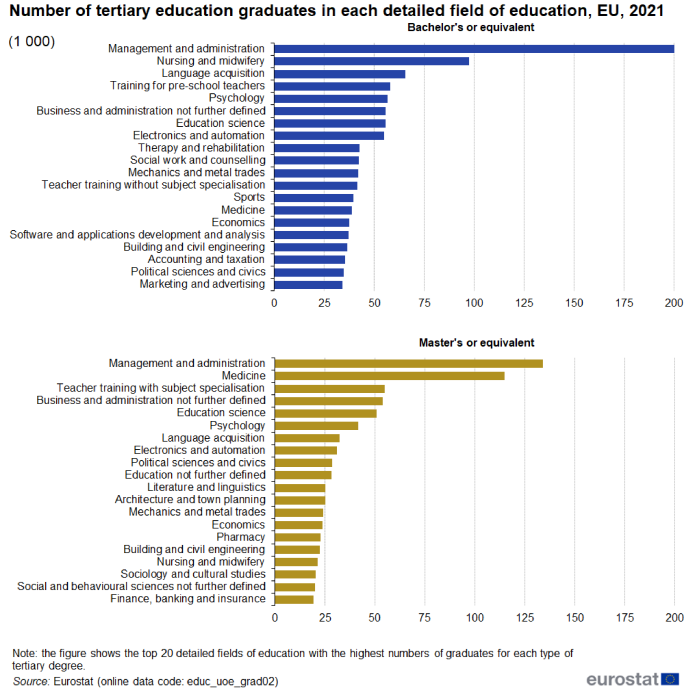
A more detailed analysis of field of study is presented in Figure 5, which shows the number of graduates with a bachelor's or a master's degree. While many subjects are offered at both bachelor's and master's levels, it is important to note that courses in some fields, for example medicine and law, may be offered in some EU Member States principally or exclusively as master's courses. In these cases, the number of graduates at the bachelor's level may be small or even zero.
In 2021, the most frequently awarded degree – based on detailed fields of education – was for management and administration; across the EU, some 208 000 people in this field graduated with a bachelor's degree and 134 200 with a master's degree. Nursing and midwifery was the second most common field for those graduating with a bachelor's degree (97 500), followed by language acquisition (65 500) and training for pre-school teachers (57 900). By contrast, medicine was the second most frequently awarded degree among those graduating with a master's degree (115 100).
(number per 1 000 inhabitants aged 20–29 years)
Source: Eurostat (educ_uoe_grad04)
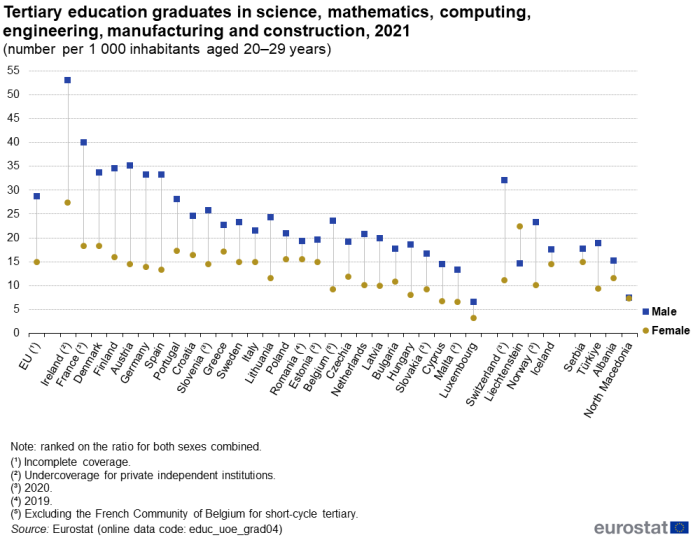
Relative to the size of the population aged 20–29 years, the number of tertiary graduates in science, mathematics, computing, engineering, manufacturing and construction (referred to hereafter as STEM) in the EU increased in recent years. In 2014, the ratio was 18.5 per 1 000 people aged 20–29 years while in 2021 it was 21.9 per 1 000.
Figure 6 shows this ratio for male and female graduates in 2021. There were almost twice as many male as female STEM graduates in the EU: 28.7 males per 1 000 male inhabitants aged 20–29 years and 14.8 females per 1 000 female inhabitants aged 20–29 years. In relative terms, the gender gap for this field of education was most marked in Belgium (excluding the French Community of Belgium for short-cycle tertiary) and Spain, where the ratios of male graduates to men aged 20–29 years were 2.7 and 2.6 times, respectively, as high as the equivalent ratio for female graduates. The narrowest gender gap for this indicator was observed in Romania (2019 data), where the ratio for male graduates was 1.2 times as high as the ratio for female graduates.
Teaching staff
(%)
Source: Eurostat (educ_uoe_perp01)
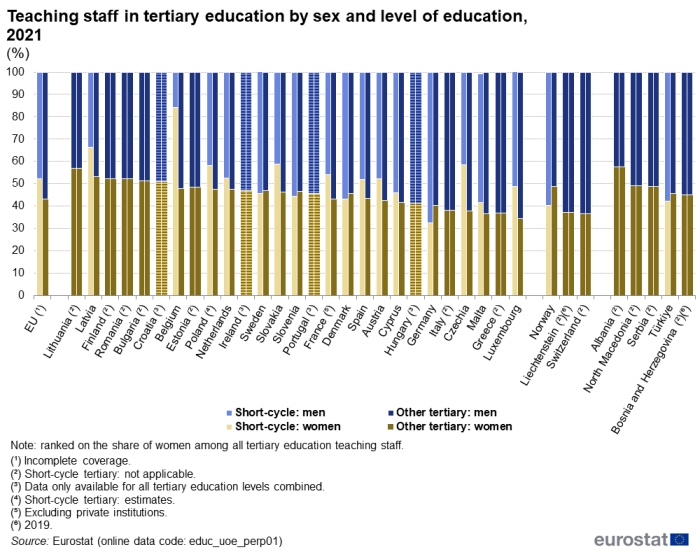
There were 1.45 million people teaching in tertiary education across the EU in 2021. Close to one-third (32.6 %) of the tertiary education teaching staff in the EU were teaching in Germany, with more than one-tenth in Spain (12.4 %).
In contrast to the teaching staff in schools, where women were in the majority, in 2021 a higher proportion of tertiary education teaching staff in the EU were men (56.1 %). Note that the countries in Figure 7 are ranked on the share of women among the teaching staff for the whole of tertiary education.
- The share of men among tertiary education teaching staff neared two-thirds in Luxembourg (64.5 %) and was also at least 60.0 % in Greece, Malta, Czechia and Italy.
- Women accounted for a majority of the tertiary education teaching staff in Croatia, Bulgaria, Romania, Finland and Latvia, with the share peaking at 56.9 % in Lithuania.
Figure 7 provides information on the relative shares of men and women within tertiary education teaching staff in 2021. An analysis by level of education provides data for short-cycle tertiary education separate from the rest of tertiary education.
- For the EU (excluding Ireland, Croatia, Hungary and Portugal), the share of women within the teaching staff was higher for short-cycle tertiary education (52.3 %) than for the rest of tertiary education (43.1 %).
- Particularly high shares of women within the teaching staff for short-cycle tertiary education were observed in Belgium (84.1 %) and Latvia (66.3 %).
- Among the EU Member States for which the analysis by level of education is available (see Figure 7), Germany, Denmark, Slovenia and Sweden were the only ones where the share of women within the teaching staff for short-cycle tertiary education was lower than the equivalent share for the rest of tertiary education.
Source data for tables and graphs
Data sources
Source
The standards for international statistics on education are set by three international organisations:
- the United Nations Educational, Scientific, and Cultural Organisation (UNESCO) institute for statistics (UIS);
- the Organisation for Economic Co-operation and Development (OECD);
- Eurostat, the statistical office of the EU.
The source of data used in this article is a joint UNESCO/OECD/Eurostat (UOE) data collection on education statistics and this is the basis for the core components of Eurostat’s database on education statistics; in combination with the joint data collection Eurostat also collects data on regional enrolments, foreign language learning and tertiary graduates with credit mobility.
More information about the joint data collection is available in an article on the UOE methodology.
Classification
The international standard classification of education (ISCED) is the basis for international education statistics, describing nine different levels of education.
Eurostat data by fields of education are classified according to the ISCED-F 2013 classification. The fields of education – as classified by ISCED-F 2013 – are broad domains, branches or areas of content covered by an education programme or qualification. The classification has a three-level hierarchy based on broad fields (the highest level), narrow fields (the second level) and detailed fields (the third level) of education.
Tables in this article use the following notation:
| Value in italics | estimate or provisional data; |
| Value is – | not relevant or not applicable; |
| Value is : | not available. |
Context
Tertiary education builds on secondary education, providing learning activities in specialised fields of education. Tertiary education includes not only what is commonly understood as 'academic' education, but also includes advanced vocational or professional education. The content of programmes at tertiary level is more complex and advanced than at lower ISCED levels. One prerequisite of tertiary education is the successful completion of ISCED level 3 programmes that give direct access to first stage tertiary education programmes (access may also be possible from ISCED level 4 programmes). In addition to qualification requirements, entry into education programmes at these levels may depend on subject choice and/or grades achieved. Furthermore, it may be necessary to take and succeed in entrance examinations.
There is usually a clear hierarchy between qualifications granted by tertiary education programmes. The transition between programmes at tertiary level is, however, not always clearly distinguished and it may be possible to combine programmes and transfer credits from one programme to another. In certain cases, credits received from previously completed education programmes may also be counted towards the completion of a programme at a higher ISCED level. Nevertheless, the successful completion of a master's or equivalent level programme (ISCED level 7) is usually required for entry into a doctoral or equivalent level programme (ISCED level 8).
Bologna process and the renewed agenda for higher education
Since the introduction of the Bologna process (see the article on Education and training statistics introduced) a major expansion in higher education systems [2] has taken place, accompanied by significant reforms in degree structures and quality assurance systems.
While the Bologna process put in motion a series of reforms to make European higher education more compatible, comparable, competitive and attractive for students, it is only one strand of a broader effort concerning higher education. To establish synergies between the Bologna process and the Copenhagen process (for enhanced European cooperation in vocational education and training), the European Commission and EU Member States have established a European qualifications framework for lifelong learning (EQF).
In May 2017, the European Commission adopted a Communication on a renewed EU agenda for higher education (COM(2017) 247 final), focusing on four priority activities:
- tackling future skills mismatches and promoting excellence in skills development;
- building inclusive and connected higher education systems;
- ensuring higher education institutions contribute to innovation;
- supporting effective and efficient higher education systems.
More information on the Communication as well as on other higher education initiatives is available in the article on Education and training statistics introduced.
European Education Area
A Council Resolution on a strategic framework for European cooperation in education and training towards the European Education Area and beyond, was adopted by the Council in February 2021. Seven EU-level targets have been introduced for monitoring progress. They define benchmarks against which performance across education and training may be judged and refer to levels of EU average performance. These include:
- the share of 25–34 year-olds with tertiary educational attainment should be at least 45 %, by 2030;
- at least 47 % of people aged 25–64 should have participated in adult learning during the previous 12 months, by 2025.
More information on the European Education Area is available in the article on Education and training statistics introduced.
Erasmus+
In 2014, the Erasmus programme was superseded by the EU's programme for education, training, youth and sport, referred to as 'Erasmus+'. The programme currently covers the period 2021–2027 and has an overall budget of €26.2 billion. This is nearly double the funding compared with its predecessor programme (2014–2020).
Direct access to
Notes
- ↑ According to the UOE classification, the distinction between public and private is made according to whether a public agency or a private entity has the overall control of the institution and not according to which sector provides the majority of the funding. If a private institution receives the majority of funding from a public agency it is considered to be dependent; if not it is independent.
- ↑ In UOE statistics, the term tertiary education is used, and this refers to ISCED levels 5–8. The term higher education is not used in UOE statistics and does not have a comparable international definition in terms of indicating a specific grouping of ISCED levels. A number of countries do not consider institutions delivering ISCED level 5 programmes to be part of what is nationally defined as 'higher education'.
- Participation in education and training (educ_part)
- Education personnel (educ_uoe_per)
- Education and training outcomes (educ_outc)
Metadata
- Pupils and students - enrolments (ESMS metadata file – educ_uoe_enr_esms)
Manuals and other methodological information
- Classification of learning activities – Manual – 2016 edition
- International Standard Classification of Education (ISCED) 2011
- ISCED 2011 Operational Manual – Guidelines for classifying national education programmes and related qualifications
- UOE data collection on formal education – Manual on concepts, definitions and classifications – 2022 edition
- UNESCO OECD Eurostat (UOE) joint data collection – methodology
- Regulation (EC) No 452/2008 of 23 April 2008 concerning the production and development of statistics on education and lifelong learning
- Commission Regulation (EU) No 912/2013 of 23 September 2013 as regards statistics on education and training systems
- Summaries of EU Legislation: statistics on education and lifelong learning
- European Education and Culture Executive Agency (EACEA)
- European Commission – European Education Area – Strategic framework for European cooperation in education and training towards the European Education Area and beyond (2021–2030)
- European Commission – Erasmus+ – EU programme for education, training, youth and sport
- European Commission – European Education Area, see:
- Council of Europe – The European Higher Education area at 20: new publication
- OECD – Education, see:
- UNESCO – Education transforms lives