Archive:Statistics on employment characteristics of households
Data extracted in May 2022.
Planned article update: June 2023.
Highlights

This article uses European Union Labour Force Survey (EU-LFS) data to give insight into the employment characteristics of households. It presents results for the EU as a whole, for all EU Member States individually, and for one candidate country (Serbia).
More statistics on this topic can be found in the Eurostat database under the households statistics section (see LFS series - specific topics). This article is complemented by three related articles Employment - annual statistics, Unemployment statistics and beyond and Household composition statistics.
Full article
Overview of employment in EU households
In 2021, slightly more than half of EU households (excluding those composed solely of students or solely of people outside the labour force aged 65 and over) were households in which all adults were employed, whether part-time or full-time (54.2 % of all private households, Figure 1). In 38.4 % of EU households all adults were working full-time, and in 15.8 % of households at least one adult was working part-time while all other adults (if there were any) were working full-time. By contrast, in 29.9 % of EU households, at least one adult was not working and at least one adult was working (whether part-time or full-time). In 15.9 % of EU households, no adults were working.
.png)
(% of total households excluding those composed solely of people outside the labour force aged 65+ or students)
Source: Eurostat (lfst_hhnhwhtc)
This picture changes when the presence or absence of children in a household is considered. All adults were employed in 57.9 % of households with economically dependent children in 2021 but only in 52.4 % of households without children.
These shares can be broken down as follows:
- All adults were working full-time in 36.5 % of households with children and in 39.3 % of households without children.
- At least one adult was working part-time and all other adults (if any) were working full-time in 21.5 % of households with children, which is significantly more than the percentages for households without children (13.1 %)
- At least one adult was working and one adult was not working in more than one third of EU households with children (34.2 %) and only in 27.9 % of EU households without children.
- Finally, 7.9 % of households with children did not encompass any employed adults against 19.7 % of households without children (no adults working).
Figure 1 compares the situation in 2009 and 2021. This figure clearly shows that the share of households in which all adults work increased over the last 12 years (+7.0 percentage point (pp.)) regardless of the presence of children:
- The share of households with children in which all adults were working recorded a 6.6 pp. increase. This was mostly due to the increase in the share of households in which all adults were working full-time (+ 6.0 pp.).
- The share of households without children in which all adults were working increased by 7.4 pp. This increase was due to the increase in the share of households in which all adults were working full-time (+ 5.2 pp.) but also to the increase in the share of households in which at least one adult was working part-time and the other adult was working full-time (+ 2.2 pp.).
At national level, Sweden, the Netherlands, Denmark and Estonia had the highest shares of households in which all adults were working: all adults were working in more than two thirds of the households (see Figure 2).
Focusing only on households in which all adults were working full-time, Lithuania ranked first with 55.2 % of its households, followed by Estonia (54.3 %) and Czechia (52.2 %).
Households in which at least one person was working part-time while the other adults were working full-time were more common in the Netherlands (39.3 %), Germany (28.3 %) and Austria (26.7 %).
Croatia (51.6 %), Portugal (47.1 %), Greece (45.8 %) and Slovakia (45.1 %) had the highest shares of households with at least one person working and at least another one not working.
By contrast, in 2021, Belgium (20.1 %), Italy (20.0 %) and Greece (19.2 %) had the highest percentages of households in which no adults were working.
.png)
(% of total households excluding those composed solely of people outside the labour force aged 65+ or students)
Source: Eurostat (lfst_hhnhwhtc)
Employment and presence of children broken down by sex and educational attainment
Children: fewer employed women, more employed men
It is usually assumed that whether or not a person has children present in the household affects the way he or she participates in the labour market.
In 2021, the employment rate of women aged 25-54 with children was 72.4 %, which is 4.6 pp. below the employment rate of women without children (77.0 %). For men aged 25-54, it is the opposite: more men with children were employed than men without children (90.0 % of men with children were employed against 80.9 % of men without children). In the EU, 20 in 27 countries followed this pattern in 2021. In 7 countries (Slovenia, Portugal, Sweden, Denmark, the Netherlands, Croatia and Greece), the employment rate of women with children surpassed or was equal to the employment rate of women without children in 2021.
.png)
(in % of the total population aged 25-54)
Source: Eurostat (lfst_hheredty)
Figure 4A shows the employment gap between women aged 25-54 with children and without children in 2021. It clearly appears that in central and eastern countries in particular, the presence of children significantly and adversely affects the employment rate of women. The largest gaps between the employment rate of women with children and the employment rate of women without children are reported by Czechia (-19.6 pp.), Malta (-16.6 pp.), Romania (-10.8 pp.), Germany and Estonia (both -8.8 pp.).
Looking at the same map for men (see Figure 4B), Malta, Romania and Czechia recorded the lowest gaps between the employment rates of men with children and without children, while these three countries recorded the largest gaps for women as mentioned in the previous paragraph. In southern and northern countries, the employment rate of men with children was much higher than the employment rate of men without children. Greece (+15.9 pp.), Croatia (+14.1 pp.), Finland (+13.3 pp.), Italy and Portugal (both, +13.0 pp.) had the largest gaps.
The employment rate by the presence of children should also be complemented by the effect on part-time employment. As it is explained in the next section, in some countries, women with children are similarly employed or even more employed than women without children but major differences may exist in terms of part-time employment.
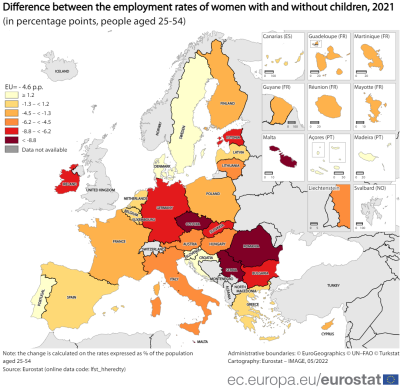
Figure 4A: Employment gap between women with and without children, 2021
(in percentage points)
Source: Eurostat (lfst_hheredty)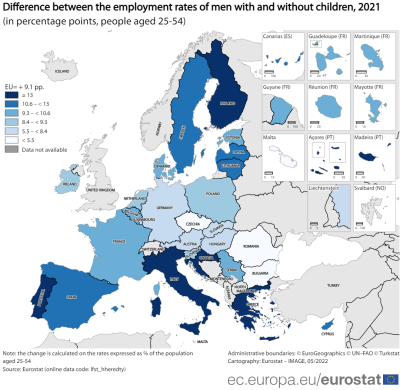
Figure 4B: Employment gap between men with and without children, 2021
(in percentage points)
Source: Eurostat (lfst_hheredty)


The lower the level of education, the more affected the employment rate
Looking at the level of education of people aged 25-54 is also highly relevant for the differences in terms of employment, sex and presence of children.
In the EU, in 2021, the share of employed women aged between 25-54 with a low level of education was 53.8 % among women without children and 45.5 % among women with children (difference of 8.3 pp.). In addition, the greater the number of children, the lower the female employment rate: the employment rate for women with a low educational level was 51.9 % for those with 1 child, 45.4 % for those with 2 children and 30.0 % for those with 3 children or more. Moreover, only slightly more than one third of women with a low level of education and whose youngest child is under 6 years were employed in 2021.
Among women with a medium level of education, 78.0 % of those without children were employed in 2021 against 72.0% of those with children (difference of 6.0 pp.). Although the employment rate for women with a medium level of education was higher than the one for women with a low level of education in each configuration, they followed the same pattern as regards the employment rate according to the presence and number of children.
The picture significantly changes for women with a high level of education. First, 89.1 % of women with a high educational level living alone (as single adults) were employed in 2021. This is 2.4 pp. above the employment rate of those living in a couple and 6.4 pp. above the employment rate of those living in another type of household. These gaps were more pronounced for women with a high level of education than for women with a lower level of education. Furthermore, slightly more women without children were employed than women with children, but the difference is minor (only 1 pp.) in comparison with women with a lower level of education. In addition, women with 1 child (86.2 %) or 2 children (86.7 %) recorded similar employment rates as women without children did (86.6 %). However, significantly fewer of those with 3 children or whose youngest child is under 6 years were employed (79.6 % and 81.5 %) than those without children or those with 1 or 2 children. Here again, it is relevant considering the level of part-time employment to get a better overview on the relationship between employment and children in particular for women with a high level of education.
The results for men aged 25-54 changed considerably in comparison with women in the same age group. First, men who lived in a couple in 2021 had a higher employment rate (91.2 %) than those who lived alone (as single adult) (82.7 %) as well as than those who lived in another type of household (77.9 %) regardless the level of education.
Around two thirds of men with a low level of education without children (66.8 %) were employed while this share reached 79.2 % for those with children (difference of 12.4 pp.). Men with 1 or 2 children had however a higher employment rate (80.2 % and 81.1 %) than men with 3 children or more in their households (72.3 %) or whose youngest child is under 6 years (77.1 %).
The share of employed men with a medium level of education with children was 92.1 % against 83.2 % for those without children. Over the same period, 95.7 % of men with a high level of education with children were in employment against 87.9 % for those without children. Men with a medium and a high level of education exactly follow the same pattern as men with a low level of education although their employment rate in 2021 was higher for each category.
.png)
(in % of the population aged 25 to 54)
Source: Eurostat (lfst_hheredty) and (lfst_hheredch)
Part-time employment and children
Figure 6 presents the share of part-time employment in total employment for men and women aged 25-54. In 2021, almost one third of employed women aged 25-54 years with children worked on a part-time basis in the EU (32.3 %) against 20.9 % among employed women without children. For men, it is the opposite: 5.0 % of employed men with children worked part-time which was lower than the share of men without children (7.4 %).
Figure 6 shows that the share of part-timers differs greatly between men and women and that the gender gap becomes even wider when people have children. The proportion of employed women with children working part-time was higher than the proportion of women without children working part-time in all countries except Denmark, Portugal and Latvia. In addition, the share of part-timers among the employed women with children was higher than the share of part-timers among the employed men with or without children in all countries but Romania.
In 2021, the gender gap in part-time employment rates between men with children and women with children was 27.3 pp. in the EU. For men and women without children, the gap was narrower and amounted to less than half of the gap observed for people with children (13.5 pp.).
In Latvia, Hungary, Poland, Croatia, Lithuania, Portugal, Slovakia, and Romania, the proportion of part-time workers was relatively low regardless of the presence of children: the share of part-time employment in the total employment was lower than 10 % of employed men or employed women, with or without children. Moreover, the share of men working part-time with or without children does not fluctuate as much as the share of women employed part-time across EU countries. The male share was contained between 13.5 % (for men without children in the Netherlands) and 1.0 % (for men without children in Bulgaria).
.png)
(in % of employed people aged 25-54)
Source: Eurostat (lfst_hhptety)
The two maps (Figure 6A and Figure 6B) focus on the gap between women with children and without children and between men with children and without children. This overview by country complements the outcome of the previous section on employment. The maps suggest that in most eastern countries, the impact on part-time employment was less visible than in other parts of the EU.
In 2021, the share of part-time employment among employed women with children surpassed by 10 pp. or more the share of part-time employment among employed women without children in Germany (34.0 pp.), Austria (32.3 pp.), the Netherlands (27.3 pp.), Luxembourg (17.8 pp.), Ireland (16.9 pp.), Malta (15.0 pp.), Belgium (14.1 pp.) and Italy (10.6 pp.) (see map 6A):
- In the Netherlands, Luxembourg and Belgium, the gap between the employment rate of women with children and the employment rate of women without children was smaller than 5 pp. while the presence of children clearly impacts the share of part-time employment.
- In Germany, Austria, Ireland, Malta and Italy, the employment rate as well as the share of part-time employment in the total employment show large differences between women with children and without children.
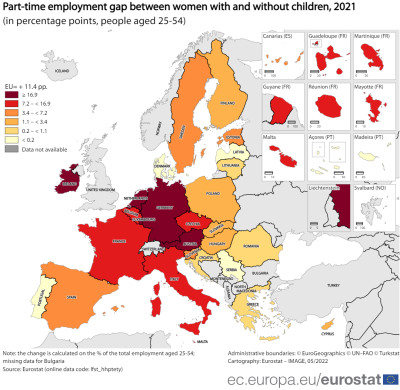
Figure 6A: Part-time employment gap between women with and without children, 2021
(in percentage points)
Source: Eurostat (lfst_hhptety)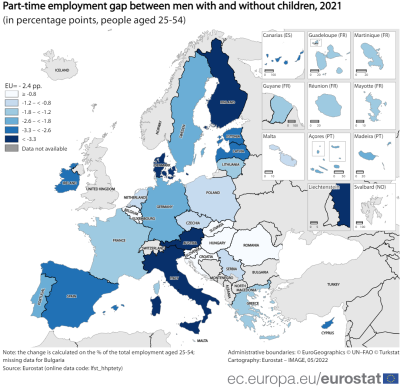
Figure 6B: Part-time employment gap between men with and without children, 2021
(in percentage points)
Source: Eurostat (lfst_hhptety)


The higher the level of education, the higher the level of part-time employment in presence of children
The share of female part-time employment in the female population was the highest for women with children with a medium level of education (26.2 %) followed by women with children with a high level of education (22.7 %)(see Figure 7). By contrast, it was the lowest for women without children with a high level of education (13.1 %).
The gap between the share of part-time employment for women with and without children was consequently the largest for women with a high level of education (+9.6 pp.). The corresponding gap for women with a medium level of education was a bit smaller (+8.1 pp.) whereas the one for women with a low level of education was nearly non-existent (+0.5 pp.).
For men, the picture is different. The share of male part-time employment in the male population was the highest for men with children with a high or low level of education (both, 6.4 %) in 2021. The lowest share was recorded for men with children with a medium level of education (3.7 %). The gap between the share of part-time employment for men with and without children by level of education was not at all the same as for women. The gap for men with a high level of education was +1.6 pp. whereas the gap for men with a medium and low level of education was -1.8 pp. and -0.6 pp respectively.
.png)
Children and adults in jobless households
In 2021, 8.7 % of children aged 0-17 and 9.3 % of people aged 18-59 in the EU were living in jobless households. In 2013, these shares reached 10.5 % for children aged 0-17 and 11.3 % for people aged 18-59, which were the highest shares recorded in the overall period 2009-2021.
Both categories steadily decreased during the period 2014-2019. In 2019, 8.7 % of children aged 0-17 and 8.8 % of people aged 18-59 were living in households where nobody worked. However, both categories increased in 2020 by 0.5 pp. (see Figure 8), most probably due to the COVID-19 pandemic.
.png)
Source: Eurostat (lfsi_jhh_a)
As shown in Figure 9, in 2021 more than 10 % of children lived in workless households in Romania (12.3 %), France (11.0 %), Belgium (10.8 %) and Italy (10.7 %) while it concerned less than 5 % of the children aged 0-17 in Hungary (4.8 %), Luxembourg (4.7 %), Croatia (4.2 %), Portugal (3.5 %) and Slovenia (1.9 %).
In Italy, Greece, Belgium, Spain, France and Romania more than 10 % of people aged 18-59 lived in households where no one was employed, while less than 5 % of people lived in such households in Hungary, Slovenia, Malta, Portugal and Czechia.
In 9 EU countries, the share of men living in workless households was higher than that of women. Among these countries, the most pronounced differences were found in Estonia (3.6 pp.) and Lithuania (2.3 pp.). The opposite situation - a share of women living in workless households being higher than that of men - was visible in 16 EU countries, with the largest gender gap among these countries recorded in Greece (1.9 pp.), followed by Italy, Belgium and Malta (gap of 1.5 pp. for all three). In Slovenia and Portugal, the shares of men and women living in workless households were the same.
.png)
Source: Eurostat (lfsi_jhh_a)
Source data for tables and graphs
Methods and definitions
Data sources
All statistics presented in this article are derived from the European Union Labour Force Survey (EU-LFS). The EU-LFS is the largest European household sample survey providing quarterly and annual results on labour participation of people aged 15 and over. It covers residents in private households and excludes those in collective households. Conscripts in military or community service are not included in the results. The EU-LFS is based on the same target populations and uses the same definitions in all countries, which means that the results are comparable between the countries.
Under the specific topic 'Households statistics', the EU-LFS currently covers statistics on household composition and number and size of households.
Reference period: Yearly results are obtained as averages of the four quarters in the year.
Coverage: The results from the EU-LFS currently cover all European Union Member States, the EFTA Member States of Iceland, Norway, Switzerland, as well as the candidate countries Montenegro, North Macedonia, Serbia and Turkey. For Cyprus, the survey covers only the areas of Cyprus controlled by the Government of the Republic of Cyprus. Nevertheless, EU-LFS household data are not available for Iceland, Norway, Switzerland.
European aggregates: EU refers to the sum of EU Member States. If data are unavailable for a country, the calculation of the corresponding aggregates takes into account the data for the same country for the most recent period available. Such cases are indicated.
Country notes
In Germany, from the first quarter of 2020 onwards, the Labour Force Survey (LFS) is part of a new system of integrated household surveys. Technical issues and the COVID-19 crisis has had a large impact on data collection processes in 2020, resulting in low response rates and a biased sample. For more information, see here.
In the Netherlands, the 2021 LFS data remains collected using a rolling reference week instead of a fixed reference week, i.e. interviewed persons are asked about the situation of the week before the interview rather than a pre-selected week.
Spain and France have assessed the attachment to the job and included in employment those who, in their reference week, had an unknown duration of absence but expected to return to the same job once health measures allow it.
Definitions
The concepts and definitions used in the EU-LFS follow the guidelines of the International Labour Organisation.
• Employment covers persons aged 15 years and over (16 and over in Spain and Italy, 15-74 years in Estonia, Latvia, Hungary, Finland, Sweden, Norway and Denmark, and 16-74 years in Iceland), living in private households, who during the reference week performed work, even for just one hour, for pay, profit or family gain, or were not at work but had a job or business from which they were temporarily absent, for example because of illness, holidays, industrial dispute or education and training. The LFS employment concept differs from national accounts domestic employment, as the latter sets no limit on age or type of household, and also includes the non-resident population contributing to GDP and conscripts in military or community service.
• The distinction between full-time and part-time work is generally based on a spontaneous response by the respondent. The main exceptions are the Netherlands and Iceland where a 35 hours threshold is applied, Sweden where a threshold is applied to the self-employed, and Norway where persons working between 32 and 36 hours are asked whether this is a full- or part-time position;
• Unemployment covers persons aged 15-74 (16-74 in Italy, Spain and Iceland) who were not employed during the reference week, were currently available for work and had either been actively seeking work in the past four weeks or had already found a job starting within the next three months.
• The level of education refers to the educational attainment level, i.e. the highest level of education successfully completed. Low level of education refers to ISCED levels 0-2 (less than primary, primary and lower secondary education), medium level refers to ISCD levels 3 and 4 (upper secondary and post-secondary non-tertiary education) and high level of education refers to ISCED levels 5-8 (tertiary education).
• A child is defined as a household member aged less than 18 years.
Time series
Regulation Regulation (EU) 2019/1700 came into force on 1 January 2021 and induced a break in the EU-LFS time series for several EU Member States.
Additional methodological information
More information on the EU-LFS can be found via the online publication EU Labour Force Survey, which includes eight articles on the technical and methodological aspects of the survey. The EU-LFS methodology in force from the 2021 data collection onwards is described in methodology from 2021 onwards. Detailed information on coding lists, explanatory notes and classifications used over time can be found under documentation.
Context
Employment statistics are at the heart of many EU policies. The European Pillar of Social Rights has been jointly signed by the European Parliament, the Council and the Commission on 17 November 2017. Employment and social policies are the main fields of interest of the European Pillar of Social Rights, which is about delivering new and more effective rights for citizens. It has 3 main categories: (1) Equal opportunities and access to the labour market, (2) Fair working conditions and (3) Social protection and inclusion. In particular, today's more flexible working arrangements provide new job opportunities especially for the young but can potentially give rise to new precariousness and inequalities. Building a fairer Europe and strengthening its social dimension is a key priority for the Commission. The European Pillar of Social Rights is accompanied by a ‘Social scoreboard’ which will monitor the implementation of the Pillar by tracking trends and performances across EU countries in 12 areas and will feed into the European Semester of economic policy coordination. The scoreboard will also serve to assess progress towards a social ‘triple A’ for the EU as a whole.
There are concerns about households where no one is working or has very limited access to work. There is indeed a need to address the issue of household joblessness for a number of reasons: for the households themselves, especially for the future of their children; to reduce poverty; for the productive capacity of the economy; and for the common good and societal well-being.
Direct access to
- All articles on employment
- Household composition statistics
- Employment - annual statistics
- Unemployment statistics and beyond
- Labour market slack – annual statistics on unmet needs for employment
- People outside the labour force
- Youth unemployment
- Unemployment statistics at regional level
- Labour market statistics at regional level
- EU labour force survey
- The life of women and men in Europe - 2021 interactive edition
- The life of women and men in Europe. A statistical portrait - 2020 edition
- Report on the impact of demographic change
- Being young in Europe today - family and society
- Being young in Europe today — online publication
- EU labour force survey — online publication
- Labour force survey in the EU, EFTA and candidate countries — Main characteristics of national surveys, 2020, 2022 edition
- Quality report of the European Union Labour Force Survey 2020, 2022 edition
- European Union Labour force survey - selection of articles (Statistics Explained)
- LFS series - specific topic(t_lfst)
- Number of persons in households (tsdpc510)
- LFS main indicators (t_lfsi)
- LFS series - Detailed annual survey results (t_lfsa)
- LFS series - Specific topics (lfst)
- Households statistics - LFS series (lfst_hh)
- LFS main indicators (lfsi)
- LFS series - Detailed annual survey results (lfsa)
- LFS series - Detailed quarterly survey results (from 1998 onwards) (lfsq)
- LFS ad-hoc modules (lfso)
Publications
- EU labour force survey — online publication
- Labour force survey (LFS) – Main concepts
- Labour force survey in the EU, EFTA and candidate countries — Main characteristics of national surveys, 2020, 2022 edition
- Quality report of the European Union Labour Force Survey 2020, 2022 edition
- Statistical working papers / Manuals and guidelines
ESMS metadata files and EU-LFS methodology
- Households statistics - LFS series (ESMS metadata file — lfst_hh_esms)
- Employment and unemployment (Labour Force Survey) (ESMS metadata file — employ_esms)
- LFS main indicators (ESMS metadata file — lfsi_esms)
- LFS series - detailed annual survey results (ESMS metadata file — lfsa_esms)
- LFS series - detailed quarterly survey results (from 1998 onwards) (ESMS metadata file — lfsq_esms)
- LFS ad-hoc modules (ESMS metadata file — lfso_esms)