Tutorials
Log in
Statistics Explained
menu
search
search
Navigation
Main page
Statistical themes
Glossary
Categories
Statistics 4 beginners
Tutorials
Help
Eurostat home
Education corner
Online publications
Regional yearbook
Sustainable development
Full list
Tools
User contributions
Logs
View user groups
Special pages
search
Navigation
Main page
Statistical themes
Glossary
Categories
Statistics 4 beginners
Tutorials
Help
Eurostat home
Education corner
Online publications
Regional yearbook
Sustainable development
Full list
Tools
User contributions
Logs
View user groups
Special pages
Navigation
Main page
Statistical themes
Glossary
Categories
Statistics 4 beginners
Tutorials
Help
Eurostat home
Education corner
Online publications
Regional yearbook
Sustainable development
Full list
Tools
User contributions
Logs
View user groups
Special pages
Uploads by Nhametma
This special page shows all uploaded files.
File list
Items per page:
20
50
100
250
500
Search for media name:
Username:
Include old versions of files
Go
First page
Previous page
Next page
Last page
Date
Name
Thumbnail
Size
Description
Versions
15:20, 22 May 2023
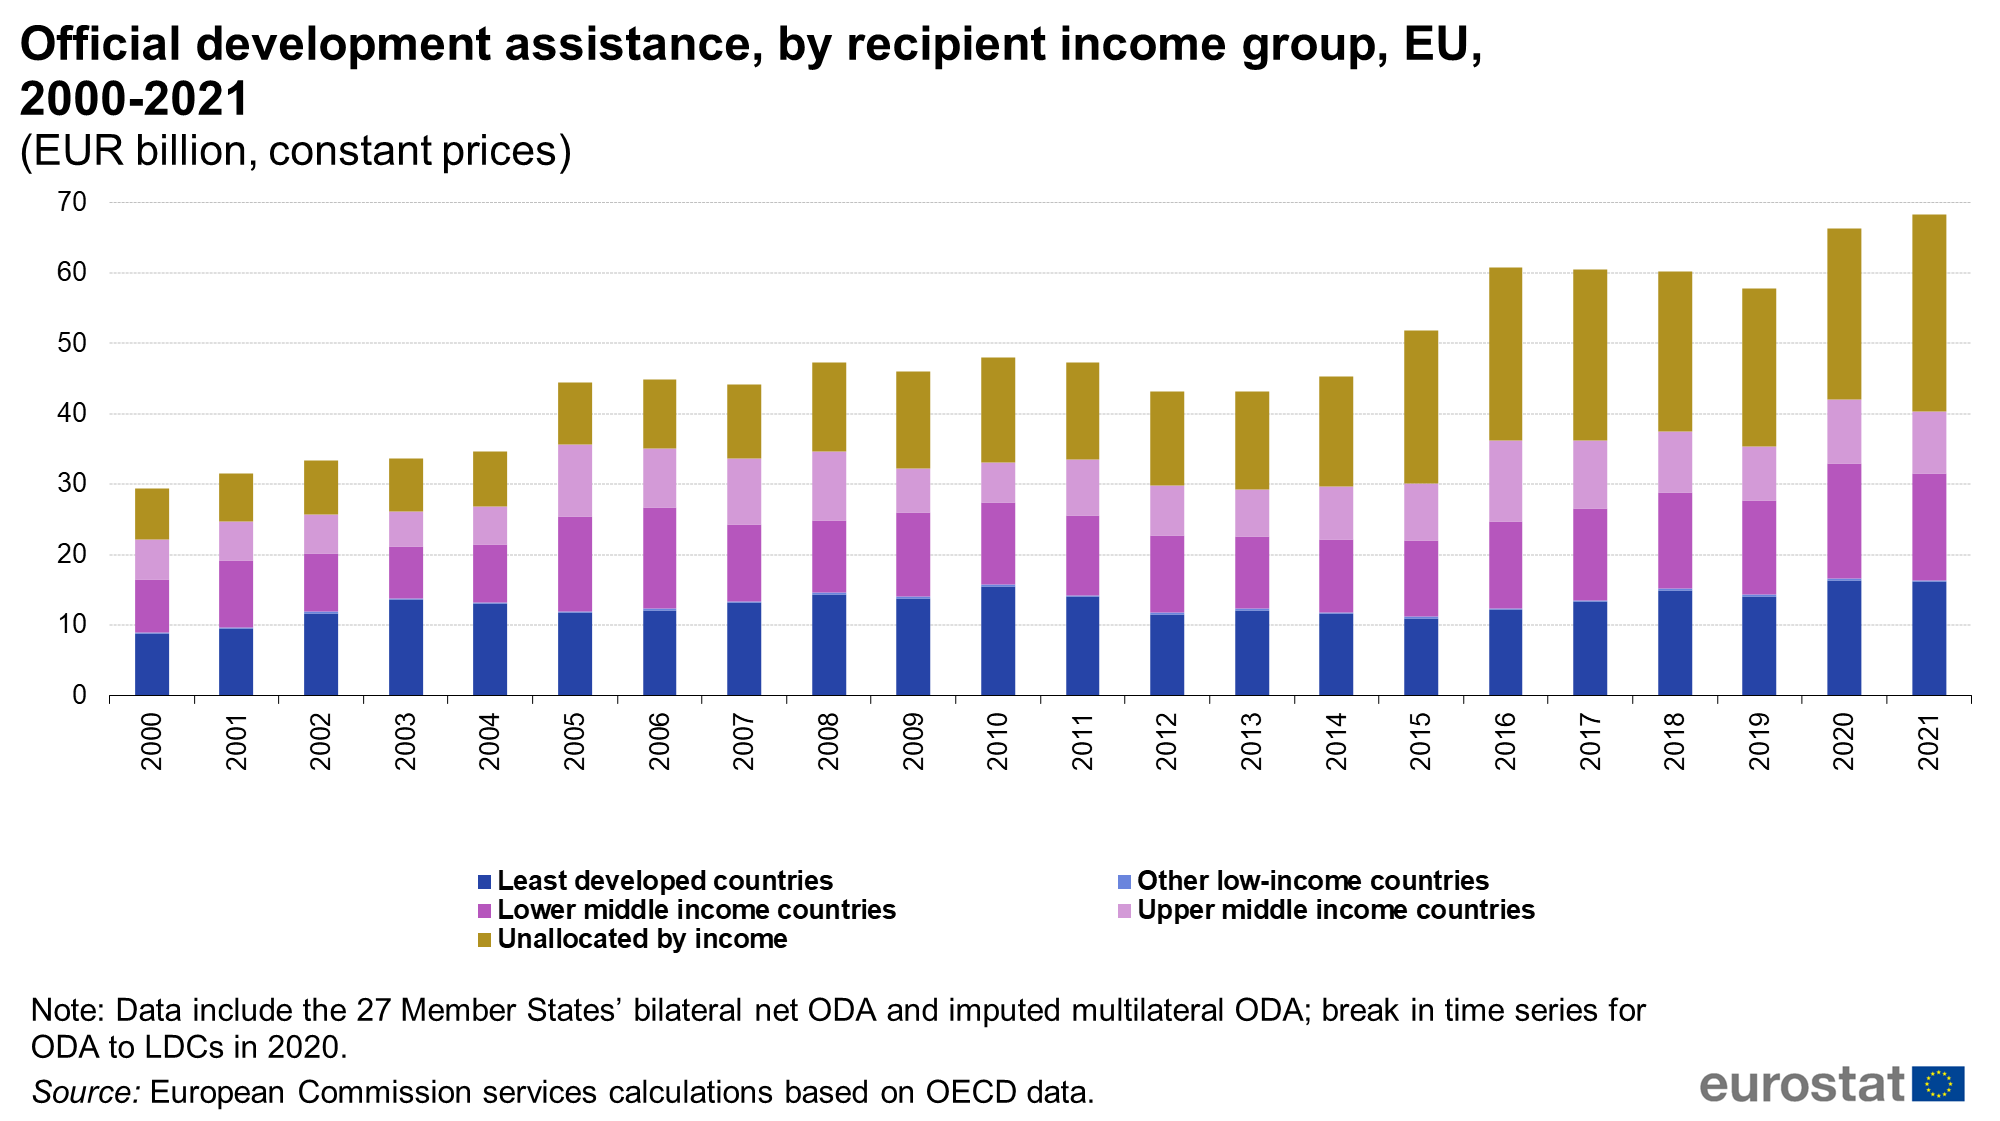
Official development assistance, by recipient income group, EU, 2000-2021 (EUR billion, constant prices).png
(
file
)
145 KB
2
15:18, 22 May 2023
Official development assistance as share of gross national income, EU, 2000-2021 (% of GNI).png
(
file
)
161 KB
2
15:12, 22 May 2023
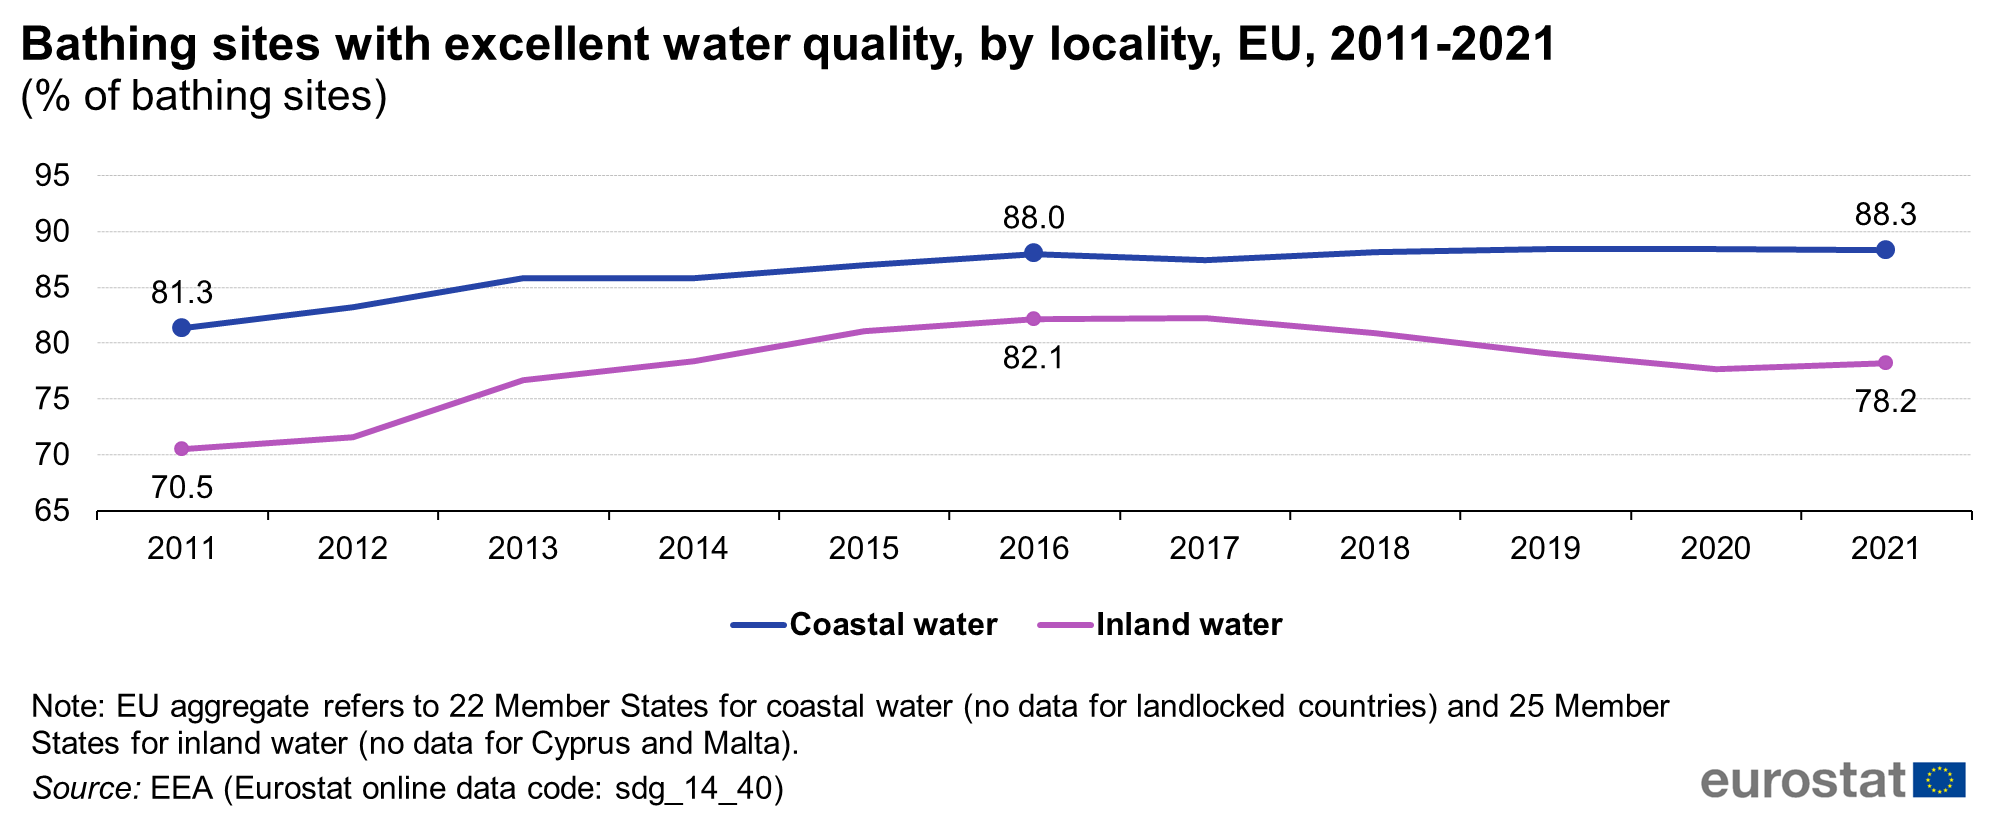
Bathing sites with excellent water quality, by locality, EU, 2011-2021 (% of bathing sites).png
(
file
)
116 KB
2
15:08, 22 May 2023
Contribution to the international USD 100bn commitment on climate-related expenditure, EU, 2014-2021 (EUR billion, current prices).png
(
file
)
124 KB
2
14:57, 22 May 2023
Share of zero emissions vehicles, by country, 2016 and 2021 (% of newly registered passenger cars).png
(
file
)
134 KB
2
14:55, 22 May 2023
Population living in households considering that they suffer from noise, by degree of urbanisation, EU, 2010-2020 (% of population) new.png
(
file
)
134 KB
2
15:55, 17 May 2023
General government gross debt, EU, 2000-2022 (% of GDP).png
(
file
)
91 KB
1
13:44, 17 May 2023
People at risk of monetary poverty after social transfers, by citizenship, EU, 2010-2021 (% of population aged 18 years or more).png
(
file
)
109 KB
1
16:10, 16 May 2023
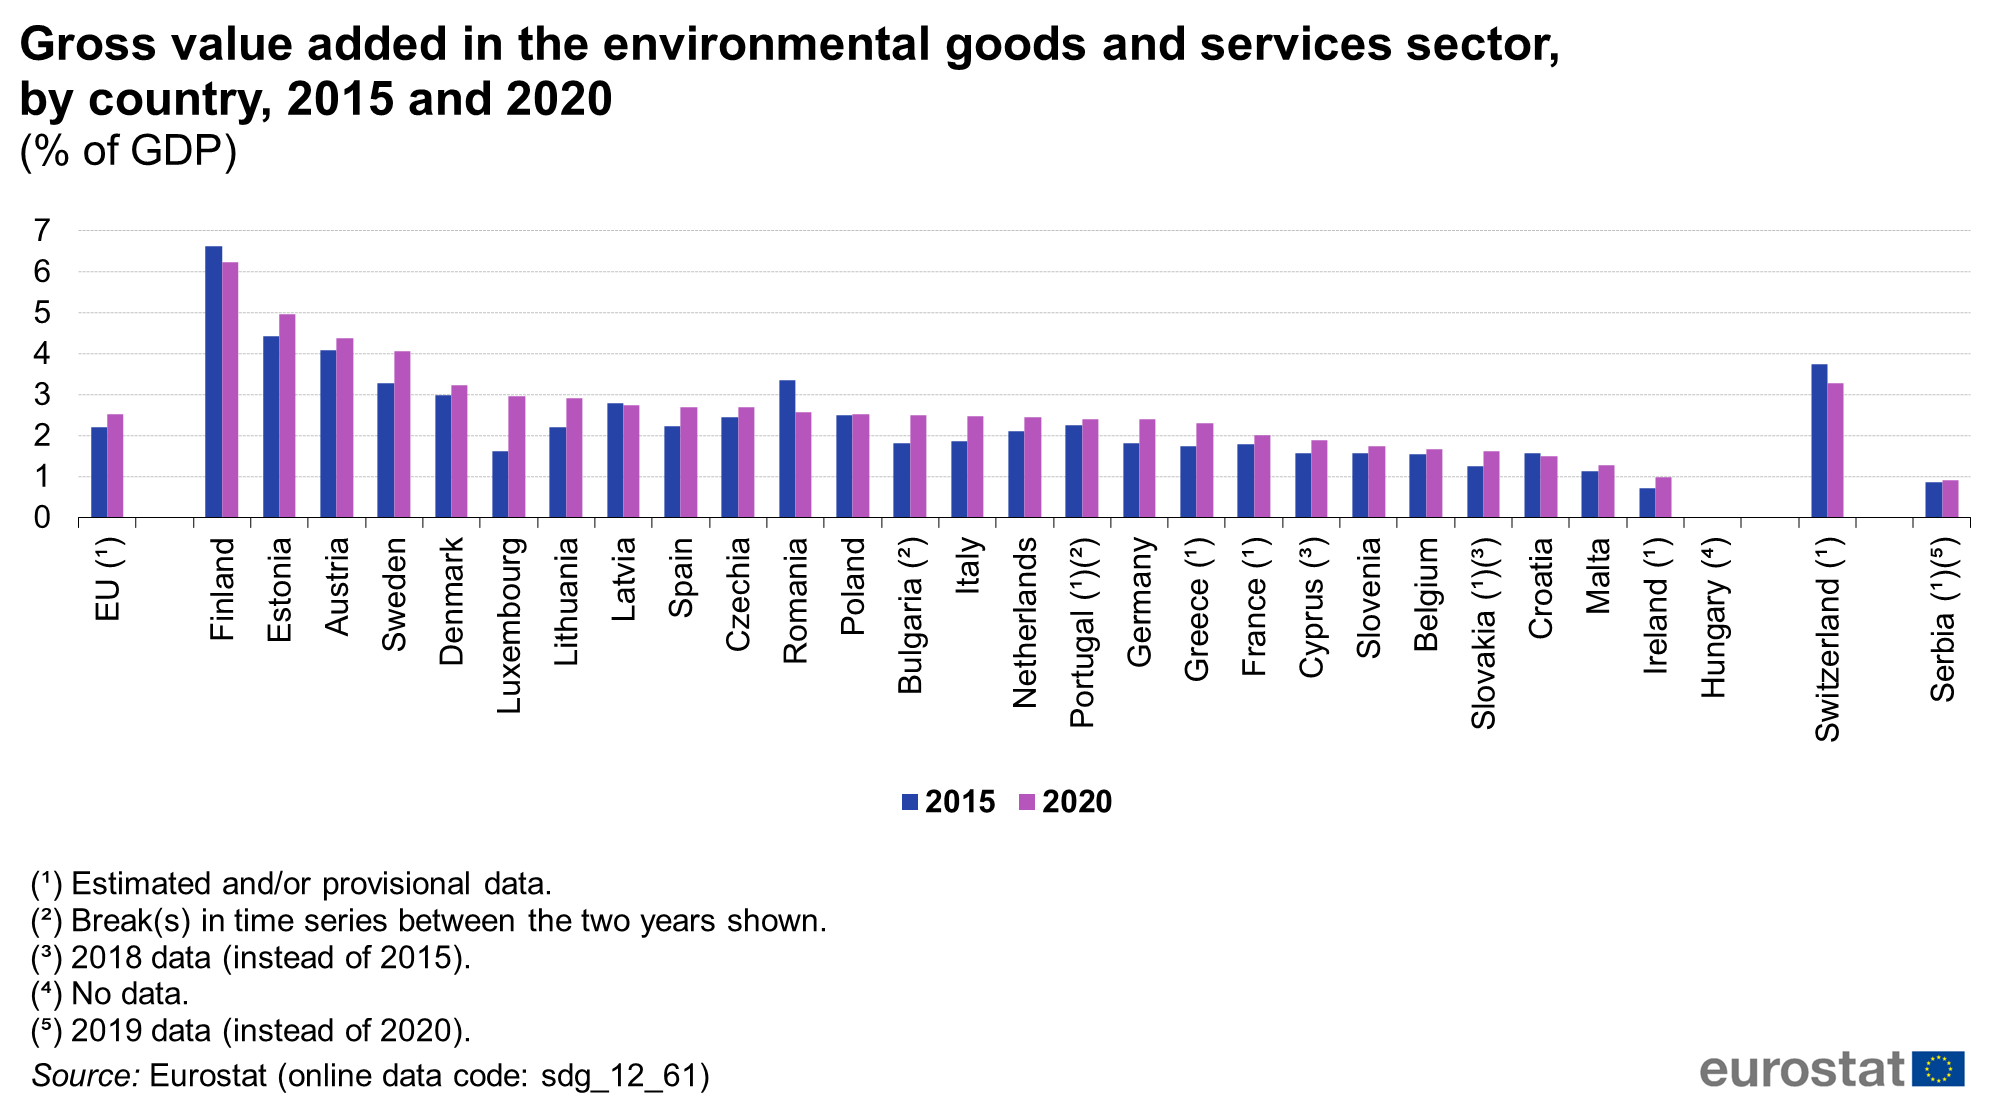
Gross value added in the environmental goods and services sector, by country, 2015 and 2020 (% of GDP).png
(
file
)
161 KB
2
13:21, 16 May 2023
Income distribution, by country, 2016 and 2021 (income quintile share ratio).png
(
file
)
197 KB
1
12:58, 16 May 2023
Population having neither a bath, nor a shower, nor indoor flushing toilet in their household, by country, 2015 and 2020 (% of population).png
(
file
)
183 KB
2
23:09, 15 May 2023
Figure 18.7 - DE 2023.png
(
file
)
43 KB
1
23:09, 15 May 2023
Figure 18.6 - DK 2023.png
(
file
)
44 KB
null
1
23:09, 15 May 2023
Figure 18.5 - CZ 2023.png
(
file
)
42 KB
null
1
23:09, 15 May 2023
Figure 18.4 - BG 2023.png
(
file
)
44 KB
null
1
23:09, 15 May 2023
Figure 18.3 - BE 2023.png
(
file
)
46 KB
null
1
23:09, 15 May 2023
Figure 18.29 - SE 2023.png
(
file
)
44 KB
null
1
23:09, 15 May 2023
Figure 18.28 - FI 2023.png
(
file
)
44 KB
null
1
23:09, 15 May 2023
Figure 18.27 - SK 2023.png
(
file
)
42 KB
null
1
23:09, 15 May 2023
Figure 18.26 - SI 2023.png
(
file
)
42 KB
null
1
23:09, 15 May 2023
Figure 18.25 - RO 2023.png
(
file
)
43 KB
null
1
23:09, 15 May 2023
Figure 18.24 - PT 2023.png
(
file
)
44 KB
null
1
23:09, 15 May 2023
Figure 18.23 - PL 2023.png
(
file
)
45 KB
null
1
23:08, 15 May 2023
Figure 18.22 - AT 2023.png
(
file
)
43 KB
null
1
23:08, 15 May 2023
Figure 18.21 - NL 2023.png
(
file
)
44 KB
null
1
23:08, 15 May 2023
Figure 18.20 - MT 2023.png
(
file
)
43 KB
null
1
23:08, 15 May 2023
Figure 18.19 - HU 2023.png
(
file
)
42 KB
null
1
23:08, 15 May 2023
Figure 18.18 - LU 2023.png
(
file
)
41 KB
null
1
23:08, 15 May 2023
Figure 18.17 - LT 2023.png
(
file
)
44 KB
null
1
23:08, 15 May 2023
Figure 18.16 - LV 2023.png
(
file
)
45 KB
null
1
23:08, 15 May 2023
Figure 18.15 - CY 2023.png
(
file
)
45 KB
null
1
23:08, 15 May 2023
Figure 18.14 - IT 2023.png
(
file
)
42 KB
null
1
23:08, 15 May 2023
Figure 18.13 - HR 2023.png
(
file
)
44 KB
null
1
23:08, 15 May 2023
Figure 18.12 - FR 2023.png
(
file
)
43 KB
null
1
23:08, 15 May 2023
Figure 18.11 - ES 2023.png
(
file
)
44 KB
null
1
23:08, 15 May 2023
Figure 18.10 - EL 2023.png
(
file
)
41 KB
null
1
23:08, 15 May 2023
Figure 18.9 - IE 2023.png
(
file
)
46 KB
null
1
23:08, 15 May 2023
Figure 18.8 - EE 2023.png
(
file
)
43 KB
null
1
15:56, 15 May 2023
Share of people with good or very good perceived health, by country, 2016 and 2021 (% of population aged 16 or over) 2023.png
(
file
)
226 KB
2
17:00, 10 May 2023
Population with confidence in EU institutions, by institution, by country, 2023 (% of population).png
(
file
)
172 KB
2
11:11, 18 April 2023
People at risk of poverty or social exclusion, EU, 2015-2021 (million people).png
(
file
)
105 KB
1
09:49, 13 March 2023
2022-SDG-progress-arrow.png
(
file
)
340 KB
3
10:29, 2 June 2022
Official development assistance as share of gross national income, EU, 2000-2020 (% of GNI).png
(
file
)
128 KB
2
13:33, 23 May 2022
Early leavers from education and training, by citizenship, EU, 2006-2021 (% of population aged 18 to 24).png
(
file
)
108 KB
1
12:52, 20 May 2022
Share of renewable energy in gross final energy consumption, by country, 2015 and 2020 (%).png
(
file
)
184 KB
2
12:49, 20 May 2022
Final energy consumption, by sector, EU, 2005, 2015 and 2020 (%).png
(
file
)
123 KB
1
20:19, 19 May 2022
Map C.1 - NEET.png
(
file
)
655 KB
1
17:44, 18 May 2022
Raw material consumption, by material, EU, 2000-2019 (billion tonnes).png
(
file
)
56 KB
2
17:37, 18 May 2022
Global mean surface seawater acidity, 1985-2020 (pH value).png
(
file
)
50 KB
2
17:33, 18 May 2022
Raw material consumption, by country, 2014 and 2019 (tonnes per inhabitant).png
(
file
)
66 KB
3
First page
Previous page
Next page
Last page
Special page
ISSN 2443-8219
.png)
.png)
.png)
.png)
.png)
_new.png)
.png)
.png)
.png)
.png)
.png)


_2023.png)
.png)
.png)
.png)
.png)
.png)
.png)

.png)
.png)
.png)