SDG 9 - Industry, innovation and infrastructure
Build resilient infrastructure, promote inclusive and sustainable industrialisation and foster innovation
Data extracted in April 2023.
Planned article update: June 2024.
Highlights

This article is a part of a set of statistical articles, which are based on the Eurostat publication ’Sustainable development in the European Union — Monitoring report on progress towards the SDGs in an EU context — 2023 edition’. This report is the seventh edition of Eurostat’s series of monitoring reports on sustainable development, which provide a quantitative assessment of progress of the EU towards the SDGs in an EU context.
SDG 9 calls for building resilient and sustainable infrastructure and promotes inclusive and sustainable industrialisation. It also recognises the importance of research and innovation for finding solutions to social, economic and environmental challenges.
Full article
Industry, innovation and infrastructure in the EU: overview and key trends
Research and development (R&D), innovations, sustainable industries and infrastructures are key to achieving the SDGs. Monitoring SDG 9 in an EU context focuses on elements such as R&D intensity and personnel, patent applications, the air emissions intensity of industry, and modal splits in passenger and freight transport. Over the five-year period assessed in this report, the EU has experienced strong progress in many of these indicators. However, there have also been recent unfavourable trends, especially regarding the use of environmentally friendly modes in freight and passenger transport.
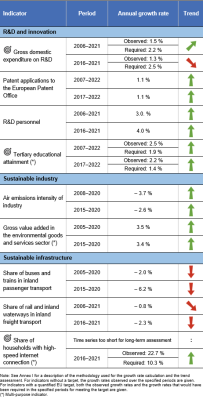
Table 1: Indicators measuring progress towards SDG 9, EU
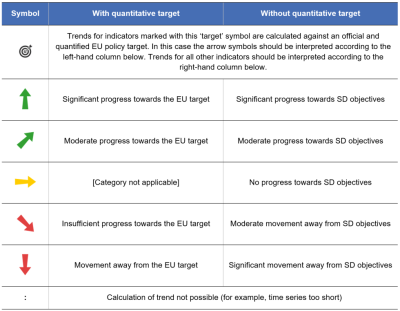
Table 2: Explanation of symbols for indicating progress towards SD objectives and targets


R&D and innovation
R&D expenditure is a key enabling factor for smart, sustainable and inclusive growth. Introducing new ideas to the market promotes job creation, labour productivity and efficient use of resources. Highly skilled human resources are imperative for keeping the EU’s research and innovation capacity and competitiveness up to date and for supporting the digital and green transitions. Innovative products and services, often as a result of R&D activities, contribute to smart growth and sustainable industrialisation. R&D and innovation are also essential for finding solutions to societal and environmental challenges such as climate change and clean energy, public security or health protection and promotion.
EU expenditure on R&D has shown only modest growth
The EU economy is facing increasing global competition and can only remain competitive with other countries and regions in the world by strengthening its scientific and technological base. Therefore, one of the key aims of EU policies over recent decades has been to encourage greater investment in R&D. This is monitored here by looking at gross domestic expenditure on R&D in relation to GDP, referred to as R&D intensity. R&D intensity thus reflects both growth in spending on R&D and growth in GDP.
Despite the EU’s long-standing 3 % target, the EU’s R&D intensity has grown only modestly over the past 20 years. After prolonged stagnation between 2000 and 2007, the EU’s R&D intensity has increased slowly, reaching 2.30 % in 2020. Most recently however, the R&D intensity has declined again, to 2.26 % in 2021. This corresponded to an R&D expenditure of about EUR 328 billion. In absolute terms, expenditure in 2021 was therefore higher than in 2020 (EUR 310 billion) and 2011 (EUR 228 billion) [1]. With a gap of 0.74 percentage points, the EU remains at some distance from its ambition of raising R&D intensity to 3 % by 2030.
Private expenditure accounts for two-thirds of total R&D expenditure
An analysis of gross domestic expenditure on R&D by sector of performance shows that the two biggest spenders in 2021 remained the business enterprise sector (66.0 % of total R&D expenditure) and the higher education sector (21.6 %). The share of the government sector was 11.8 %, while the private non-profit sector accounted for less than 1 % of total R&D expenditure [2].
The business enterprise sector accounts for the lion’s share of total R&D expenditure and has increased its R&D intensity by 0.4 percentage points over the past 15 years, from 1.13 % of GDP in 2005 to 1.49 % in 2021. Simultaneously the higher education sector increased its R&D intensity from 0.39 % (2005) to 0.49 % of GDP in 2021. In contrast, the R&D intensities of the government and private non-profit sectors have more or less stagnated at lower levels.
The number of patent applications to the European Patent Office has grown
Patent applications provide a valuable measure of the creative and innovative capacity of countries, regions and companies and of the economic exploitation of research results. In 2021, 67 500 patent applications from within the EU were submitted to the European Patent Office. This figure was reached after an almost continuous period of growth since 2007, when 57 255 applications were submitted. The only year to record a strong year-on-year drop in applications was 2009 as a result of the economic crisis [3].
The availability of human capital for a knowledge-based society is growing, but gender disparities remain
The growing knowledge orientation of the EU’s economy and society, together with developments in the labour market and demographic trends, make human capital increasingly important. Achieving the SDGs will require ambitious investments in research and development (R&D) and significant innovation, including further investment in skills development and in lifelong learning [4].
R&D personnel consists of researchers engaged directly in R&D as well as those persons providing direct services for the R&D activities (such as R&D managers, administrators, technicians and clerical staff) [5]. The share of R&D personnel in the labour force has increased steadily since 2006, from 0.97 % to 1.50 % in 2021 (full-time equivalent). This trend was mainly driven by the business enterprise sector, which employed about 60 % of the R&D workforce in 2021.
An analysis by sex, however, reveals that women remain considerably underrepresented among researchers based on head count in the EU, accounting for only 32.9 % in 2019. There has been no considerable progress since 2005, when the share stood at 30.2 %. This underrepresentation is particularly strong in the business enterprise sector, where women only made up 21.3 % of researchers in 2019. In contrast, women accounted for more than 40 % of researchers in the other three sectors (government, higher education and non-profit sector), with the private non-profit sector being the closest to achieving parity at 48.4 % in 2019. Compared with the other sectors, the higher education sector recorded the largest increase in female researchers: between 2005 and 2019, it increased by 6.5 percentage points, from 36.5 % to 43.0 % [6].
Data on tertiary educational attainment show a general long-term increase in the EU population’s skill levels. Between 2007 and 2022, the share of 25- to 34-year olds with a university degree or similar increased from 28.9 % to 42.0 %. The EU is therefore well on track to reaching its target of raising this share to at least 45 % by 2030, as set out in the Council Resolution from 2021 on the European Education Area. However, differences between the sexes remain considerable, and when compared with the situation for R&D personnel, the gender imbalance is reversed. While 47.6 % of women aged 25 to 34 years had accomplished tertiary education in 2022, only 36.5 % of men in this age group had done so. This gender gap has been widening almost continuously since 2007.For further details on tertiary education and the gender gap, see the articles on SDG 4 ‘Quality education’ and SDG 5 ‘Gender equality’.
Sustainable industry
Mobilising industry for a clean and circular economy is one of the key priorities of the European Green Deal, which seeks to support and accelerate the EU’s industry transition to a sustainable model of inclusive growth. This requires a massive reduction in harmful air emissions emitted through industrial production alongside increased use of greener products and services.
The air emissions intensity of EU industry has improved in recent years
Industry is vital for Europe’s prosperity and future development. The EU industrial sector accounts for more than 20 % of the EU economy and employs about 35 million people [7]. However, industry is also a source of many environmental pressures such as material consumption and the emission of greenhouse gases and other air pollutants. This analysis focuses on air pollutants emitted by industry, using particulate matter emissions from manufacturing as a proxy. For an analysis of greenhouse gas emissions from industry, see the article on SDG 13 ‘Climate action’.
Poor air quality causes premature deaths, impacts quality of life and damages ecosystems [8]. Particulate matter, especially fine particulate matter (PM2.5), is one of the most harmful components of air pollution for human health [9]. Exposure to air pollution by PM2.5 caused 237 810 premature deaths in the EU in 2020 (see articles on SDG 3 ‘Good health and well-being’ and on SDG 11 ‘Sustainable cities’). In 2020, the EU’s manufacturing sector was responsible for about a fifth (21.7 %) of total PM2.5 emissions. In comparison, in the same year, about a third (33.0 %) of total PM2.5 emissions could be attributed to transportation and storage, and almost a quarter (24.2 %) to agriculture, forestry and fishing [10].
Data on emissions intensity monitor a sector’s air emissions relative to its economic output in terms of gross value added (GVA). Between 2008 and 2020, the air emissions intensity of fine particulate matter (PM2.5) of the EU’s manufacturing sector dropped by 36.4 %, from 0.11 grams per euro to 0.07 grams per euro. This improvement is a result of the sector’s PM2.5 emissions falling by 30.3 % between 2008 and 2020 while its GVA grew almost continuously until the onset of the COVID-19 pandemic. In 2019 – the year before the pandemic – the sector’s GVA was 13.5 % higher than in 2008. In 2020, GVA was still higher than in 2008, albeit only by 5.3 %. From 2019 to 2020, the sector thus experienced a stronger fall in its GVA (by 7.2 %) than in its PM2.5 emissions (by 5.4 %).
Between 2015 and 2020, PM2.5 emissions from manufacturing decreased by 6.6 %, alongside a 1.9 % increase in the sector’s GVA [11]. This resulted in a 12.5 % improvement in the sector’s emissions intensity over this most recent five-year period. The manufacturing sector’s emissions intensity for the broader group of fine and coarse particulate matter (PM10) experienced a similar improvement, decreasing by 33.3 % between 2008 and 2020 and by 9.1 % between 2015 and 2020.
Gross value added of environmental goods and services has grown strongly
The EU’s updated New Industrial Strategy for Europe strives for a greener industry. Products and services that, for instance, prevent or limit environmental pollution, repair and correct resource depletion or protect biodiversity may contribute to a so-called green economy. These kinds of environmental goods and services (EGSS) are gaining in importance. In 2020, they accounted for a gross value added of EUR 300.1 billion. This is a 68.6 % increase compared with 2005, when the EU’s GVA of environmental goods and services amounted to EUR 178.0 billion. In relation to the whole economy, the environmental goods and services sector grew from 1.7 % of GDP in 2005 to 2.5 % in 2020. This indicates the sector grew — in gross value added terms — disproportionally faster than other economic sectors. Notably, the sector's GVA continued to grow in 2020 (by 1.9 %) when the EU’s GDP fell by 5.6 % as a result of the COVID-19 pandemic.
Employment (in full-time equivalent) in the sector has also increased since 2005, by 47.5 %. In 2020, the sector employed slightly more than 5 million people in the EU [12]. The development is related to multiple factors, which, among other things, include growth in private investments in environmental goods and services, encouraged by increasing government interventions in this area [13].
Sustainable infrastructure
The European Green Deal aims to transform the EU into a fair and prosperous society, with a modern, resource-efficient and competitive economy. To achieve this vision, the EU needs to address the twin challenge of the green and the digital transition. In this context, the Green Deal calls for an acceleration in the shift to sustainable and smart mobility as well as for investment in digitalisation to support the green transition. Multimodal and energy efficient freight transport as well as automated and connected multimodal mobility will consequently need to play an increasing role, together with smart traffic management systems enabled by digitalisation.
Use of public transport dropped considerably during the pandemic
Well-functioning and efficient transport and mobility systems are key elements for a competitive economy. Growth in transport activities puts increasing pressure on natural resources and on societies. Emissions of greenhouse gases, air pollutants and noise from transport affect the climate, the environment and human health. As the transport sector is responsible for nearly one-quarter of greenhouse gas (GHG) emissions in the EU (see the article on SDG 13 ‘Climate action’), sustainable transport is an essential ingredient in sustainable development strategies. Rethinking future mobility includes optimising the use of all means of transport, promoting car sharing and the integration between different modes of collective transport such as trains and buses.
In 2020 the modal share of buses and trains in inland passenger transport in the EU fell significantly compared with previous years [14]. While their share in terms of passenger-km has stagnated between 16.9 % and 18.0 % since 2000, and accounted for 17.5 % in 2019, it dropped to 12.8 % in 2020. This corresponds to a 4.7 percentage point decrease within one year. Conversely, the share of passenger-km covered by cars — which remain by far the dominant mode for inland passenger transport — increased to 87.2 % in 2020 [15]. This drastic development can be essentially attributed to the effects of the COVID-19 pandemic. A study published by the European Parliament shows that measures such as restrictions on domestic and international travels, teleworking policies as well as changed mobility habits as a consequence of the pandemic led to a significant decline in public transport use in 2020. According to an EU-wide survey on passenger mobility carried out in 2021, 64 % of the respondents reported that their travel behaviour was impacted by the COVID-19 pandemic.
The EU’s freight transport system still relies on road transport
Despite the EU policy objective of shifting freight from road to rail and inland waterways, road continues to have by far the largest share in EU freight transport among the three inland transport modes analysed in this report (road, rail and inland waterways). Since 2012, the share of rail and inland waterways in total freight transport in the EU has declined almost continuously. It accounted for 22.7 % in 2021, which corresponds to a 3.8 percentage point decrease compared with the peak of 26.5 % in 2012.
Considerable differences do exist at country level though. In 2021, three countries (Lithuania, Latvia and Romania) had higher shares for rail and inland waterways than for road in inland freight transport. Particularly high shares of rail transport were reported from the Baltic countries Lithuania (62.5 %), Latvia (53.4 %) and Estonia (40.1 %). In the Netherlands, freight transport via inland waterways still plays an important role, with a modal split of 41.9 % in 2021.
Considerable progress has been made in rolling out fixed very high capacity network connections across the EU
Digital connections are crucial for today’s economies and societies. Instant communication between individuals, bank transfers, office work, public dissemination of information, or data analysis are only some of the activities that depend on the internet. Especially in rural and remote areas, fast internet connection can significantly improve access to various services such as health care and education. Regions without fast internet connections have serious social and economic disadvantages in a digitalised world. The 2030 Digital Compass thus proposed the target that by 2030 all European households should be covered by a gigabit network, with all populated areas covered by 5G.
Data collected by the European Commission services for the key dimensions of the European information society [16] show that the uptake of fixed very high capacity network (VHCN) connectivity — referring to fibre connections or other networks offering similar bandwidth [17] — has improved considerably in the EU over the past few years. While only 25.2 % of EU households had access to such connectivity in 2016, this share has risen considerably, reaching 70.2 % of households in 2021. If VHCN roll-out continues at this pace, the EU will reach 100 % coverage well ahead of 2030. VHCN connectivity has also improved in rural areas [18]. Between 2016 and 2021, the share of rural households with fixed VCHN connection increased from 7.7 % to 37.1 % across the EU. Despite this positive development, VCHN connectivity in rural areas remains at some distance from the 2030 target. In addition, basic digital skills for all citizens (see the article on SDG 4 ‘Quality education’ are a general prerequisite for ensuring they benefit from digital developments [19].
Presentation of the main indicators
Gross domestic expenditure on R&D

This indicator measures gross domestic expenditure on R&D (GERD) as a percentage of the gross domestic product (GDP) — also called R&D intensity. The OECD’s Frascati Manual on collecting R&D data defines research and experimental development (R&D) as creative and systematic work undertaken in order to increase the stock of knowledge — including knowledge of humankind, culture and society — and to devise new applications of available knowledge.
.png)
.png)
Source: Eurostat (online data codes: (sdg_09_10) and (rd_e_gerdtot)

Source: Eurostat (online data code: (rd_e_gerdreg)
Patent applications to the European Patent Office
_evaluation_2023.PNG)
This indicator measures requests for the protection of an invention filed with the European Patent Office (EPO) regardless of whether they are granted or not. Applications are allocated according to the country of residence of the first applicant listed on the application form (first-named applicant principle) as well as according to the country of residence of the inventor.
,_by_country_of_applicant,_EU,_2004-2022_(number).png)
Source: EPO, Eurostat (sdg_09_40)
,_by_country_of_applicant,_2017_and_2022_(per_million_inhabitants).png)
Source: EPO, Eurostat (sdg_09_40)
,_by_country_of_inventor,_2017_and_2022_(per_million_inhabitants).png)
Source: EPO, Eurostat (sdg_09_40)
R&D personnel

This indicator measures the share of R&D personnel in the following institutional sectors: business enterprise, government, higher education and private non-profit. Data are presented in full-time equivalents as a share of the labour force. R&D personnel consists of persons engaged directly in R&D, which refers to the creative and systematic work undertaken to increase the stock of knowledge, including knowledge of humankind, culture and society, and to devise new applications of available knowledge. In addition, R&D personnel also includes those providing direct services for the R&D activities, such as R&D managers, administrators, technicians and clerical staff.
.png)
Source: Eurostat (sdg_09_30)
.png)
Source: Eurostat (sdg_09_30)
Air emissions intensity of industry
_evaluation_2023.PNG)
This indicator measures the emissions intensity of particulate matter (PM10 and PM2.5) from the manufacturing sector (NACE Rev. 2 sector ‘C’). Air emissions are defined as flows of gaseous and particulate materials emitted into the atmosphere. Fine and coarse particulates (PM10) are less than 10 micrometres in diameter and can be carried deep into the lungs, where they can cause inflammation and exacerbate the condition of people suffering from heart and lung diseases. Fine particulates (PM2.5) are less than 2.5 micrometres in diameter and are therefore a subset of the PM10 particles. Their negative health impacts are more serious than PM10 because they can be drawn further into the lungs and may be more toxic. Emission intensity is calculated by dividing the sector’s PM emissions by its gross value added (GVA), which is defined as output (at basic prices) minus intermediate consumption (at purchaser prices).
.png)
Source: Eurostat (sdg_09_70)
,_by_country,_2015_and_2020_(grams_per_euro,_chain-linked_volumes,_2010).png)
Source: Eurostat (sdg_09_70)

This indicator measures the share of buses, including coaches and trolley-buses, and trains in inland passenger transport, expressed in passenger-kilometres (pkm). (pkm). Passenger transport here includes transport by passenger cars, buses and coaches, and trains, but excludes inland waterways, air and sea transport. All data are based on movements within national territories, regardless of the vehicle’s nationality. Road data stem from a voluntary collection and are not fully harmonised at the EU level. Tram and metro systems are not included because the data collection methodology for these means of transport is not sufficiently harmonised between Member States.
.png)
Source: Eurostat (sdg_09_50)
.png)
Source: Eurostat (sdg_09_50)

This indicator measures the share of rail and inland waterways in inland freight transport, expressed in tonne-kilometres (tkm). Inland freight transport includes road, rail and inland waterways. All data are based on movements on national territory; rail and inland waterways transport are collected based on movements on national territory, regardless of the nationality of the train or vessel. Road transport activity is collected according to the country of registration of the vehicle, regardless of the territory where the activity is performed. The activity is redistributed to the territory where the activity is actually performed by modelling the likely journey itinerary on the European road network. Neither sea nor air freight transport are included.
.png)
Source: Eurostat (sdg_09_60)
.png)
Source: Eurostat (sdg_09_60)
Direct access to
More detailed information on EU SDG indicators for monitoring of progress towards the UN Sustainable Development Goals (SDGs), such as indicator relevance, definitions, methodological notes, background and potential linkages, can be found in the introduction of the publication ’Sustainable development in the European Union — Monitoring report on progress towards the SDGs in an EU context — 2023 edition’.
Further reading on industry, innovation and infrastructure
- European Court of Auditors (2023), Intermodal freight transport: EU still far from getting freight off the road, Publications Office of the European Union, Luxembourg.
- European Commission (2011), White Paper — Roadmap to a Single European Transport Area — Towards a competitive and resource efficient transport system, Brussels
- OECD (2023), OECD Science, Technology and Innovation Outlook 2023: Times of Crisis and Opportunity, OECD Publishing, Paris.
Further data sources on industry, innovation and infrastructure
- European Commission (2021), European Innovation Scoreboard 2021.
- European Commission (2021), The 2021 EU industrial R&D investment scoreboard.
- OECD (2022), OECD Science, Technology and Industry Scoreboard.
- OECD (2019), Measuring the Digital Transformation. A Roadmap for the Future.
- UNIDO (2021), Statistical Indicators of Inclusive and Sustainable Industrialization, United Nations Industrial Development Organization, Vienna.
Notes
- ↑ Eurostat (online data code: (rd_e_gerdtot)).
- ↑ Ibid.
- ↑ European Patent Office (2009), Annual Report 2009, p. 13.
- ↑ International Labour Organization (2021), World Employment and Social Outlook — Trends 2021, p. 114.
- ↑ Eurostat (2022), Research and development (R&D) — Reference Metadata.
- ↑ Eurostat (online data code: (rd_p_femres)).
- ↑ European Commission (2020), A New Industrial Strategy for Europe, p. 2.
- ↑ European Commission (2022), Clean air.
- ↑ World Health Organization (2021), Ambient (outdoor) air pollution, (Factsheet, 21 September 2021).
- ↑ Eurostat (online data code: (env_ac_ainah_r2)).
- ↑ Eurostat (online data code: (env_ac_ainah_r2) and (nama_10_a10)).
- ↑ Eurostat (online data code: (env_ac_egss1)).
- ↑ European Environmental Agency (2019): Environmental Goods and Services Sector: employment and value added.
- ↑ Tram and metro systems are not included because the data collection methodology for these means of transport is not sufficiently harmonised between Member States.
- ↑ Eurostat (online data code: (tran_hv_psmod)).
- ↑ See European Commission, Key Indicators.
- ↑ Data until 2018 refer to FTTP (fiber to the premises) only, while data from 2019 onwards refer to both FTTP and DOCSIS 3.1 (Data Over Cable Service Interface Specification). DOCSIS allows adding high-bandwidth data transfer to existing cable television systems.
- ↑ In the context of the EU’s digital agenda scoreboard indicators, rural areas are defined as those with fewer than 100 people per km2.
- ↑ European Commission 2021: 2030 Digital Compass: the European way for the Digital Decade, p. 6.