SDG 13 - Climate action
Take urgent action to combat climate change and its impacts
Data extracted in April 2023.
Planned article update: June 2024.
Highlights

This article is a part of a set of statistical articles, which are based on the Eurostat publication ’Sustainable development in the European Union — Monitoring report on progress towards the SDGs in an EU context — 2023 edition’. This report is the seventh edition of Eurostat’s series of monitoring reports on sustainable development, which provide a quantitative assessment of progress of the EU towards the SDGs in an EU context.
SDG 13 seeks to achieve a climate-neutral world by mid-century and to limit global warming to well below 2°C — with an aim of 1.5°C — compared with pre-industrial times. It aims to strengthen countries’ climate resilience and adaptive capacity, with a special focus on supporting least-developed countries.
Full article
Climate action in the EU: overview and key trends
Climate change increases global air and ocean temperatures, changes precipitation patterns, raises the global average sea level, provokes extreme weather events, harms biodiversity and increases ocean acidity. Its impacts threaten the viability of social, environmental and economic systems and may make some regions less habitable due to food and water scarcity. Monitoring SDG 13 in an EU context focuses on climate mitigation, climate impacts and initiatives to support climate action. As surface temperatures rise, the EU faces intensifying climate impacts and economic losses from climate-related events which have increased in recent years. Though net greenhouse gas (GHG) emissions partly bounced back in 2021 after falling during the peak of the COVID-19 pandemic in 2020, they remained below their 2019 levels. However, more effort will still be needed to reach the ambitious target of reducing net GHG emissions by 55 % by 2030. These additional efforts are already foreseen in the Fit for 55 package with a revision of the EU emissions trading system (ETS) and the effort-sharing regulation that sets binding annual GHG emissions targets for Member States. The 2030 target includes net GHG removals from land use, land use change and forestry, which declined further and thus contributed less to reaching the net GHG target. The share of renewables has kept rising in the EU, but stronger progress will be needed to meet the new, more ambitious 2030 target. More local and regional governments have joined the Covenant of Mayors for Climate and Energy initiative for implementing mitigation and adaptation actions. Financial support is significantly progressing, with climate-related expenditure for developing countries being topped up.
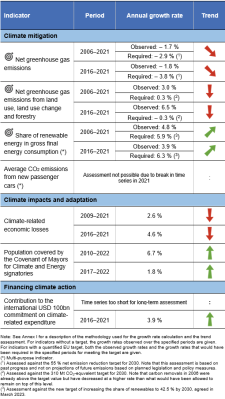
Table 1: Indicators measuring progress towards SDG 13, EU
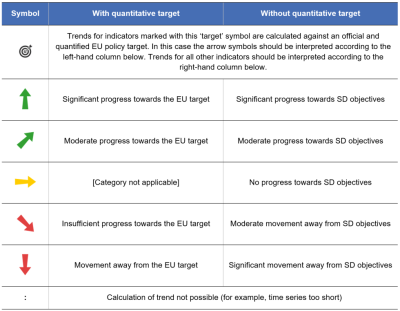
Table 2: Explanation of symbols for indicating progress towards SD objectives and targets


Climate mitigation
Climate mitigation aims to reduce emissions of climate-harming greenhouse gases (GHG) that originate from human activity through measures such as promoting low-carbon technologies and practices or encouraging sustainable forest management and land use that enhance carbon removals. The EU has set into law the target to reach climate neutrality with no net GHG emissions by 2050. This means reducing GHG emissions as much as possible while offsetting the residual emissions by removing carbon dioxide (CO2), for example through natural carbon sinks and using carbon-removal technologies. On its way, the EU has committed itself to reducing net GHG emissions by at least 55 % by 2030 compared with 1990 levels.
GHG emissions continue to fall compared with pre-pandemic levels, with more to be done to meet the 2030 target
Estimates for net GHG emissions, which include net removals from land use and forestry, suggest that the EU achieved close to a 30 % reduction between 1990 and 2021 [1]. This means that over the next nine years, emissions will need to fall much quicker if the EU wants to reach its net GHG emission reduction target of 55 % by 2030.
A large proportion of the EU’s emission reductions since 1990 have occurred between 2006 and 2021, with net emissions falling by 23.0 % during this period. The short-term trend has been less clear-cut, experiencing both ups and downs. Net GHG emissions increased slightly between 2014 and 2017, but fell again between 2017 and 2020. A remarkable 10.6 % drop occurred in 2020, which can mainly be attributed to the measures taken in response to the COVID-19 pandemic and the related reduction in energy consumption. However, net GHG emissions have partly bounced back in 2021, with an increase of 6.0 % compared with 2020. Overall, EU net emissions have fallen by 8.9 % between 2016 and 2021. GHG emission estimates for the first three quarters of 2022 suggest that GHG emissions have remained below pre-pandemic levels [2]. However, there is still uncertainty around the impacts of Russia’s invasion of Ukraine and the resulting energy crisis on the EU’s GHG emissions (see the article on SDG 7 ‘Affordable and clean energy’).
Per capita emissions have fallen in line with the overall reduction in net GHG emissions
Across the EU, net GHG emissions per capita ranged from 0.9 to 16.9 tonnes of CO2-equivalent in 2021. Luxembourg by far exceeded the per capita emissions of other Member States, which can be partly attributed to a considerably higher number of commuters and transit traffic [3]. Compared with 2016, net GHG emissions per capita have fallen in all but seven Member States. Latvia reported the strongest increase in net emissions per capita, of 41.7 %, mainly as a result of reduced carbon removal by forest land. Finland and Lithuania also saw a rise in net emissions of more than 10 % between 2016 and 2021. Sweden reported the strongest reduction among Member States, of 50.0 %, followed by Slovenia with 28.9 % [4].
The average carbon footprint, which refers to CO2 emissions from consumption, significantly differs according to income. Data from the World Inequality Database [5] show that in 2020 the carbon footprint of the richest 10 % of the EU population was five times higher than for the poorest 50 %. This inequality was lowest in Malta (3.9 times) and the Netherlands (4.0) and highest in Luxembourg (7.1), Romania (6.5) and Austria (6.3).
Carbon removals remain on a downward trend
Net GHG removals come from land use and forestry, which is also referred to as the ‘land use, land use change and forestry (LULUCF)’ sector according to the IPCC classification. Within this sector, forests remove CO2 from the air (as trees capture CO2 through photosynthesis), which usually overcompensates for emissions from land use (for example, from the use of fertilisers) and land use change (for example, when grassland is converted to cropland).
In the EU, GHG net removals from land use and forestry fell by 0.6 % between 1990 and 2021. While carbon removals from forest land increased in the first half of the period, the trend reversed between 2006 and 2021, with net removals from all land types falling by 36.4 %. The largest decrease happened over the last five years of this period, when net removals fell by 28.7 %. Due to the large drop in total GHG emissions, net removals still compensated for 6.0 % of emissions in 2021, even though this is a lower share compared with previous years. In absolute numbers, the net removals amounted to 211.8 Mt of CO2-equivalent in 2021. This is well below the EU’s net carbon removal target for land use and forestry of at least 310 Mt of CO2-equivalent by 2030.
Emissions associated with energy consumption have fallen thanks to reduced energy consumption and increased use of renewables
A sectoral breakdown of the years 1990 and 2021 shows that all sectors of the economy reduced their GHG emissions over this period, except transport [6]. Fuel combustion in energy industries — which covers electricity and central heat generation — showed the strongest reduction, due to a general drop in energy consumption and an increasing share of renewable energy sources, which reached 37.5 % of electricity consumption in 2021. As a result of these developments, fuel combustion by energy users (excluding transport) replaced energy industries as the largest emission source in 2020 and remained the top emitting sector with 27.4 % of total GHG emissions in 2021. This is because fossil fuel consumption in buildings increased by 2.3 % between 2016 and 2021, even though the share of renewables in heating and cooling grew by 2.5 percentage points over the same period, reaching 22.9 % in 2021. Transport emissions dropped by 8.9 % between 2016 and 2021, following a reduction in fossil fuel use alongside an increase in consumption of renewable fuels [7]. In total, renewable energy contributed 21.8 % of the EU’s gross final energy consumption in 2021. While this was an increase of 3.8 percentage points between 2016 and 2021, stronger progress seems necessary to reach a 42.5 % share of renewable sources in energy consumption by 2030.
Average CO2 emissions per km from new car fleets have fallen over the past decade
Passenger cars are responsible for a considerable share of the EU’s total GHG emissions. To reduce those emissions, the EU has set targets for the fleet-wide average emissions of new passenger cars. For each manufacturer’s new car fleet, a binding specific emission target has been set based on the average mass of its new vehicles so that the overall target for the EU’s average fleet emissions will be met.
Between 2007 and 2020, data on the average CO2 emissions per km from new passenger cars were collected based on the New European Driving Cycle (NEDC) procedure. In 2021, the data collection method was changed to the World Harmonised Light-vehicle Test Procedure (WLTP), which is more representative of a vehicle’s on-road emissions and leads to higher emission values than the NEDC. To ensure manufacturers’ targets are as equally stringent, these have also been converted to values based on the WLTP.
Data collected according to NEDC show that the average CO2 emissions per km from new passenger cars registered in the EU fell almost continuously between 2007 and 2020, reaching 107.9 g/km in 2020, which is a 9.4 % reduction since 2015. The new data collected according to WLTP show average CO2 emissions per km from new passenger cars were 116.3 g/km in 2021.
Climate impacts and adaptation
Rising concentrations of CO2 emissions and other GHGs lead to global warming and increased ocean acidity. As a consequence of global anthropogenic GHG emissions, the decade 2012 to 2021 was the warmest on record, with a global mean near-surface temperature increase of 1.11–1.14 °C compared with the pre-industrial level. This means that more than half of the warming towards the global 2 °C limit stipulated in the Paris Agreement has already occurred. The average annual temperature over the European continent has increased even more, by 1.94–1.99 °C during this decade [8].
Climate impacts are a consequence of rising temperatures and the related intensity and quantity of extreme events which affect environmental, social and economic systems. The EU’s SDG monitoring focuses on the economic costs that arise from weather- and climate-related extreme events. To minimise the impacts, countries are taking action to adapt to climate change by introducing measures such as flood protection, adapted agricultural practices and forest management, and sustainable urban drainage systems. Climate adaptation is also fully integrated into the Covenant of Mayors initiative, which covers thousands of cities in Europe and worldwide with the aim of mobilising local governments and regions to make voluntary but ambitious climate mitigation and adaptation commitments.
Economic losses from weather- and climate-related extreme events have been considerable in recent decades
Studies have shown that various weather- and climate-related extreme events in Europe and beyond have become more severe and frequent as a result of global climate change [9]. The resulting impact on human systems and ecosystems has led to measurable losses to economies and people’s livelihoods [10]. Reported economic losses generally reflect monetised direct damages to certain assets and as such are only partial estimates of the full damages. They do not consider losses related to mortality and health, cultural heritage or ecosystems services, which would considerably raise the estimate [11].
Over the period 1980 to 2021, weather- and climate-related losses accounted for a total of EUR 559.8 billion. 2021 marked a new negative record, with climate-related economic losses amounting to EUR 56.6 billion in that year, most of which (EUR 43.2 billion) was caused by hydrological events. However, recorded losses vary substantially over time: about 57 % of the total losses have been caused by just 5 % of unique extreme events [12]. This variability makes the analysis of historical trends difficult. However, a closer look at a 30-year moving average shows an almost steady increase in annual climate-related economic losses, from EUR 11.1 billion in 2009 to EUR 15.2 billion in 2021 [13], which corresponds to a 36.5 % increase. The most expensive climate extreme events during the period from 1980 to 2021 included the 1999 storm Lothar and the 2000 flood in France and Italy, the 2002 flood in central Europe and the severe floods in Germany, Netherlands, Belgium and Luxembourg in July 2021.
A growing number of local governments are committed to act on climate protection and adaptation
Communities play a vital role in implementing climate mitigation and adaptation actions on the grounds. In this context, the EU supports the Covenant of Mayors for Climate and Energy, which was established in 2008 and is one of the EU’s flagship climate initiatives. The Covenant of Mayors mobilises local governments and regions to make voluntary but ambitious climate commitments that help achieve emission reductions in and outside the EU and increase resilience to climate impacts. While initially focusing on mitigation measures only, from 2015 onwards the Covenant of Mayors for Climate and Energy has explicitly concentrated on mitigation and adaptation measures [14].
In 2022, Covenant of Mayors (CoM) signatories covered 196 million people in the EU, representing about 44 % of the EU population. Since 2010, the population covered by CoM signatories has grown almost steadily. In 13 EU Member States, CoM signatories represented more than half of the population in 2022. The highest share was reported by Belgium, with almost 95 % of the population, followed by Spain and Italy with slightly above 75 % each.
In parallel, by 7 March 2023, 284 regions and local authorities from EU countries (301 with Horizon partner countries also included) have signed up to participate in the Horizon Europe Mission on Adaptation to Climate Change. The Mission will help these regions and local authorities to better understand, prepare for and manage climate risks, as well as to develop innovative solutions to build resilience.
Financing climate action
As part of the transition towards climate neutrality, the EU is endeavouring to redirect public and private investments to areas where they will support this objective. For this reason, the EU has adopted the EU taxonomy as a classification system for sustainable economic activities and a European green bond standard intended as a voluntary ’gold’ standard for the green bond market. At EU level, climate change mitigation and adaptation has been integrated into all major spending programmes [15] and the EU has also committed to support international climate action.
The EU’s contribution to climate finance for developing countries has been increasing since 2014
In addition to investing in climate action within its borders, the EU and its Member States have also committed to raising money to combat climate change and for adapting to climate impacts in developing countries. They take part in a commitment made by the world’s developed countries to jointly mobilise USD 100 billion per year by 2025, from a wide variety of sources, instruments and channels [16].
Total EU public finance contributions (including all 27 Member States as well as the EU institutions) increased from about EUR 12.9 billion in 2014 to EUR 23.4 billion in 2020. In 2021, the contribution amounted to EUR 23.0 billion. The two largest contributors in the period were Germany and France. The European Investment Bank (EIB) and the European Commission were the third and fourth largest donors in 2021, respectively. In 2020, the EU, its Member States and the EIB together were the biggest contributors of public climate finance to developing countries worldwide [17]. It is important to note that due to a methodological change, data since 2020 are not directly comparable with earlier years as recent data are based on commitments only, for both bilateral and multilateral finance.
Presentation of the main indicators
Net greenhouse gas emissions

This indicator measures man-made greenhouse gas (GHG) emissions as well as carbon removals on EU territory [18]. They are integrated into a single indicator — net GHG emissions — expressed in units of CO2 equivalents based on the global warming potential (GWP) of each gas. At present, carbon removals are accounted for only in the land use, land use change and forestry (LULUCF) sector. The net GHG emissions shown here include international aviation, indirect CO2 and natural carbon removals from LULUCF. The indicator refers to GHG emissions in the EU territory. GHG emissions derived from the production of goods imported and consumed in the EU are counted in the export country, following the UNFCCC rules. Emissions and removals data, known as GHG inventories, are submitted annually by Member States to the EU and the United Nations Framework Convention on Climate Change (UNFCCC). The European Environment Agency (EEA) compiles the EU aggregate data and publishes data for the EU and all Member States. Eurostat republishes the EEA data.
.png)
Source: EEA, Eurostat (sdg_13_10)
.png)
Source: EEA, Eurostat (env_air_gge)
.png)
Source: EEA, Eurostat (sdg_13_10)
Net greenhouse gas emissions from land use and forestry

This indicator measures net carbon removals from the land use, land use change and forestry (LULUCF) sector, considering both emissions and removals from the sector. The indicator is expressed as CO2 equivalents using the global warming potential (GWP) of each gas. Emissions and removals data, known as GHG inventories, are submitted annually by Member States to the EU and the United Nations Framework Convention on Climate Change (UNFCCC). The European Environment Agency (EEA) compiles the EU aggregate data and publishes data for the EU and all Member States. Eurostat republishes the EEA data.
.png)
Source: EEA, Eurostat (sdg_13_21)
.png)
Source: EEA, Eurostat (sdg_13_21)

This indicator includes the overall monetary losses from weather- and climate-related events. The European Environment Agency (EEA) compiles the EU aggregate data from CATDAT of RiskLayer. Eurostat republishes the EEA data. Due to the variability of the annual figures, the data are also presented as a 30-year moving average to facilitate the analysis of historical trends.
.png)
Source: EEA, Eurostat (sdg_13_40)
,_by_country,_2016_and_2021_(EUR_per_capita,_constant_prices).png)
Source: EEA, Eurostat (sdg_13_40)
Population covered by the Covenant of Mayors for Climate and Energy signatories

The Covenant of Mayors for Climate and Energy in Europe, now part of the Global Covenant of Mayors for Climate and Energy, represents a climate initiative at multiple levels of governance with actors across the globe pledging to deliver comprehensive climate change mitigation and adaptation and energy action plans and establish a regular monitoring process. Here the number of citizens living within regions that act as signatories to the Covenant of Mayors in Europe is monitored as an indication of the initiative’s reach.
.png)
Source: Covenant of Mayors for Climate and Energy, Eurostat (sdg_13_60)
.png)
Source: Covenant of Mayors for Climate and Energy, Eurostat (sdg_13_60)

The intention of the international commitment on climate finance under the United Nations Framework Convention on Climate Change (UNFCCC) is to enable and support enhanced action by developing countries to advance low-emission and climate-resilient development. The data presented in this section are reported to the European Commission under the Monitoring Mechanism Regulation (Regulation (EU) 525/2013) for the period up to 2019 and under the Governance Regulation (Regulation (EU) 2018/1999) for subsequent years.
.png)
Source: European Commission services and EIONET, Eurostat (sdg_13_50)
.png)
Source: European Commission services and EIONET, Eurostat (sdg_13_50)
Direct access to
More detailed information on EU SDG indicators for monitoring of progress towards the UN Sustainable Development Goals (SDGs), such as indicator relevance, definitions, methodological notes, background and potential linkages, can be found in the introduction of the publication ’Sustainable development in the European Union — Monitoring report on progress towards the SDGs in an EU context — 2023 edition’.
Further reading on climate action
- European Commission, Climate Action.
- European Commission, Citizen support for climate action.
- European Commission, International Climate Finance.
- European Commission (2020), Kick-starting the journey towards a climate-neutral Europe by 2050 — EU Climate Action Progress Report.
- European Commission, Climate Action – 2050 long-term strategy.
- EEA (2022), Trends and projections in Europe 2022, Report No. 1072022, European Environment Agency, Copenhagen.
- EEA (2018), National climate change vulnerability and risk assessments in Europe, 2018, European Environment Agency, Copenhagen.
- EEA (2020), Urban adaptation in Europe: how cities and towns respond to climate change, EEA Report No 12/2020.
- IPCC (2022), Summary for Policymakers. In: Climate Change 2022: Impacts, Adaptation, and Vulnerability. Contribution of Working Group II to the Sixth Assessment Report of the Intergovernmental Panel on Climate Change. Cambridge University Press, Cambridge, UK and New York, NY, USA.
- The Covenant of Mayors, About.
Further data sources on climate action
Notes
- ↑ 2021 data for GHG emissions presented in this report have been calculated based on the approximated estimates for greenhouse gas emissions published by the European Environment Agency: EEA (2022), Approximated estimates for Greenhouse Gas emissions. The data presented here cover GHG emissions produced inside the EU territory and do not take into account those that occurred outside the EU as a result of EU consumption.
- ↑ Eurostat (2023), Quarterly greenhouse gas emissions in the EU.
- ↑ Eurostat (2010), Using official statistics to calculate greenhouse gas emissions — A Statistical Guide, Publications Office of the European Union, Luxembourg; also see Eurostat (2020), Commuting between regions.
- ↑ 2021 data for GHG emissions presented in this report have been calculated based on the approximated estimates for greenhouse gas emissions published by the European Environment Agency: EEA (2022), Approximated estimates for Greenhouse Gas emissions.
- ↑ See: World Inequality Database.
- ↑ Eurostat (online data code: (env_air_gge)) and European Environment Agency (2022), Approximated estimates for greenhouse gas emissions.
- ↑ Eurostat (nrg_bal_c).
- ↑ European Environment Agency (2022), Global and European temperatures.
- ↑ IPCC (2018), Global Warming of 1.5°C, Special Report of the Intergovernmental Panel on Climate Change, Cambridge and New York: Cambridge University Press.
- ↑ IPCC (2021), Impacts, Adaptation and Vulnerabilities, Contribution of Working Group II to the Six Assessment Report of the Intergovernmental Panel on Climate Change, Cambridge and New York: Cambridge University Press.
- ↑ IPBES (2019), Summary for policymakers of the global assessment report on biodiversity and ecosystem services of the Intergovernmental Science-Policy Platform on Biodiversity and Ecosystem Services, Bonn; and European Environment Agency (2016), Climate change impacts and vulnerability in Europe: An indicator-based report, Report No. 1/2017, Copenhagen.
- ↑ European Environment Agency (2023), Economic losses from climate-related extremes in Europe (temporal coverage 1980–2021).
- ↑ A 30-year moving average shows the average over the past 30 years for a given year. For example, for 2017, the data point shows the average from 1988 to 2017.
- ↑ European Commission, European climate adaptation platform — Covenant of Mayors for Climate and Energy.
- ↑ European Commission, Budget — Multiannual Financial Framework programmes.
- ↑ European Commission (2018), A modern budget for a Union that protects, empowers and defends: The Multiannual Financial Framework for 2021–2027, COM(2018) 321 final, Brussels.
- ↑ European Commission (2022), International climate finance.
- ↑ The ‘Kyoto basket’ of GHGs includes carbon dioxide (CO2), methane (CH4), nitrous oxide (N2O) and the so-called F-gases F-gases, i.e., hydrofluorocarbons, perfluorocarbons, nitrogen trifluoride (NF3) and sulphur hexafluoride (SF6).