Quality of life indicators - economic security and physical safety
Data extracted in January 2023.
Planned article update: August 2024
Highlights
In 2021 30.1 % in the EU reported being unable to cope with unexpected financial expenses, 2.4 pp less than in 2020 and 8.3 pp less than one decade before.
In 2021 people living in single parent households in the EU were twice more likely to be in arrears for mortgage or rent, utility bills or hire purchase than the total population.
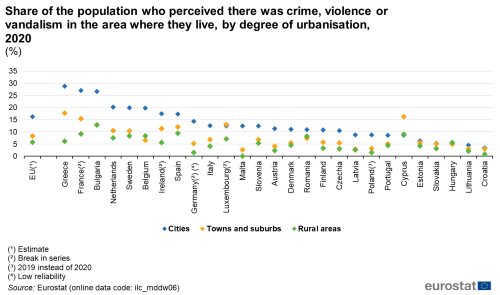
In 2020 people living in cities in the EU were 3 times more likely to perceive there is crime in their area compared to those in rural areas (16.3% compared to 5.8%).
Share of the population unable to face unexpected financial expenses, 2011 and 2021
This article is part of a Eurostat online publication that focuses on Quality of life indicators and includes recent statistics for the European Union (EU). The publication analyses the various indicators in detail which can then form the basis of a more in-depth analysis of the quality of life, complementing gross domestic product (GDP) which has traditionally been used to give a general overview of economic and social developments.
Of the nine quality of life indicator dimensions, this article covers economic security and physical safety.
Full article
General overview
There are many risks that could unexpectedly and adversely affect an individual’s or a household’s material security. In this article, these risks are presented in two categories: economic security and physical safety. The former category is analysed with statistics that measure situations in which people may find themselves, such as being unable to cope with unexpected financial expenses, or being in arrears with a mortgage, rent, utility bills or hire purchase payments. The analysis on physical safety is based on crime statistics, as well as information on the perceptions of the population regarding crime, violence or vandalism in the area where they live.
Economic security
In 2021, almost one in three people (30.1 %) in the EU reported being unable to cope with unexpected financial expenses (see Figure 1), a decrease of 2.4 percentage points (pp) since 2020. In the aftermath of the global financial and economic crisis, this share peaked at 40 % in 2012, after which the situation improved over seven consecutive years and it reached 30.9 % in 2019. In 2020, when the COVID-19 pandemic started, the trend turned and the share rose to 32.5 %.
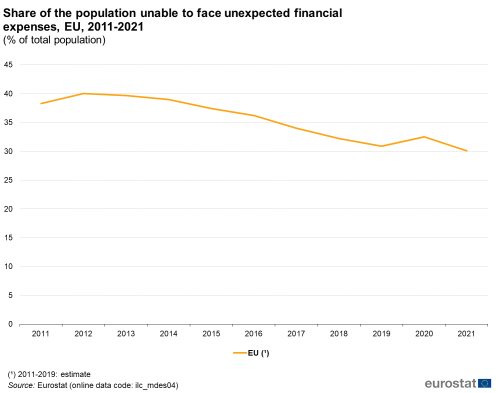
(% of total population)
Source: Eurostat (ilc_mdes04)
In 2021, at Member State level, economic insecurity measured by the share of the population unable to cope with unexpected financial expenses was most common in Romania (47.3 %), Croatia (46.5 %), Greece (46.3 %), Cyprus (43.4 %) and Latvia (41.7 %) – as shown in Figure 2. This was contrary to 2011, when the share of population experiencing economic insecurity was above 50 % in nine Member States, reaching 80.4 % in Latvia and 74.4 % in Hungary, in 2021 this share was below 50 % in all Member States. The best situation was observed in the Netherlands (15.1 %), Malta (15.7 %), Czechia (18.1 %), Sweden (18.4 %), Austria (18.6 %) and Denmark (19.5 %), where less than one fifth of the population faced such difficulties.
Across the EU, the share of the population unable to cope with unexpected financial expenses dropped by 8.2 pp between 2011 and 2021. The biggest decreases were observed in Hungary and Latvia where the share halved over that period (a drop from 74.4 % to 34.8 % in Hungary and from 80.4 % to 41.7 % in Latvia). Double-digit drops were observed in 11 Member States. Overall, there was a considerable drop in all but two Member States in this period: in Greece the share increased by 11.9 pp (to 46.3 %), and in Portugal by 2.1 pp (to 31.2 %).
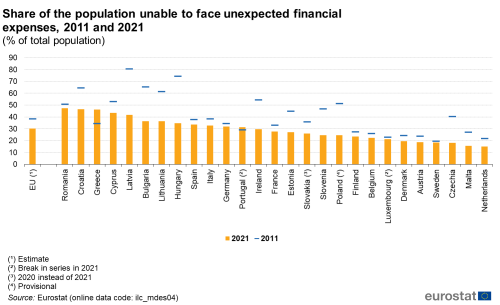
(% of total population)
Source: Eurostat (ilc_mdes04)
In 2021, mortgage or rental arrears were most prevalent in Greece, where 8.5 % of the total population had outstanding debts of this kind (see Figure 3). The next highest proportion was recorded in Ireland (7.0 %), followed by Spain (6.5 %), France and Cyprus (both at 5.4 %). The share of the population reporting arrears on mortgage or rental payments was below 5.0 % in the remaining Member States, falling to less than 2.0 % in 13 of them and reaching a low of 0.5 % in Poland, 0.7 % in Croatia, 0.9 % in Lithuania, 1.0 % in Romania and 1.2 % in Bulgaria. The low levels of mortgage or rental arrears may be related, at least in part, to the small share of the population having a mortgage or renting dwellings at market price in some countries, thereby limiting the share observed. For example, in 2021, homeowners with a mortgage accounted for just 1.4 % of the total population in Romania, 2.4 % in Bulgaria and 7.7 % in Croatia, compared with an EU average of 26.8 % (click here for a complete data set covering all Member States).
Between 2011 and 2021, there was generally a slight decrease in the percentage of the population that was behind with mortgage or rental payments in the majority of EU Member States. Exceptions were Spain (increase of 1.9 pp), Luxembourg (0.6 pp), Romania (0.4 pp), Germany and Malta (both 0.1 pp).

(% of total population)
Source: Eurostat (ilc_mdes06)
Looking at a broader indicator, which includes arrears and debt linked to housing (mortgages or rental), utility bills and hire purchase payments (but excludes overdrafts, credit cards, and informal loans from friends and relatives), less than one tenth (9.1 %) of the EU population had such outstanding arrears in 2021 (see Figure 4). In Greece, more than one third (36.4 %) of the population was in arrears with their mortgage or rent, utility bills or hire purchase payments, while this share was one fifth (20.1 %) in Bulgaria. By contrast, 19 of the 27 Member States recorded a single-digit share of less than 10.0 %. Czechia with 2.4 % and the Netherlands with 2.6 % were the Member States where the proportion of the population in arrears was the lowest.
It is interesting to observe that, in 2021, the share of the population in Poland, Croatia, Lithuania, Romania, Bulgaria, Estonia and Latvia (countries at the bottom of the list for mortgage or rent payment arrears) is much higher when looking at the broader indicator. It stood at 7.0 % compared to 0.5 % in Poland, 16.6 % compared to 0.7 % in Croatia, 6.6 % compared to 0.9 % in Lithuania and 10.1 % compared to 1.0 % in Romania. In these countries, the vast majority of arrears were therefore linked to utility bills or hire purchase payments.
Some of these same countries also recorded the greatest improvement in the share of the population for arrears on mortgage or rent, utility bills or hire purchase since 2011. In Romania, this share fell by 20.7 pp and in Latvia by 18.1 pp The overall proportion of the EU’s population in arrears for mortgage or rent, utility bills or hire purchase payments also fell, by 3.0 pp between 2011 and 2021. However, in six Member States there was a notable increase; this was the case especially in Spain (increase of 5.6 pp), Greece (4.5 pp) and Luxembourg (2.7 pp). (See Figure 4)
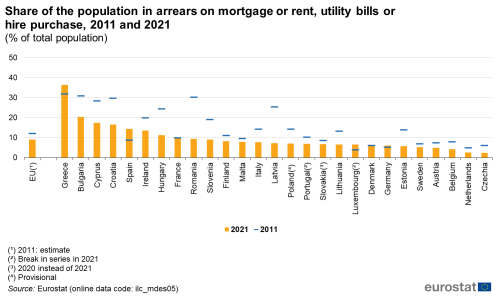
(% of total population)
Source: Eurostat (ilc_mdes05)
In the EU, following five years of decline, the share of the population in arrears of payment began to increase in 2020, coinciding with the COVID-19 pandemic outbreak. However, it did not reach the highest level (12.9 %) that was recorded in 2013 and 2014 following the global financial and economic crisis. (See Figure 5)
In 2011, the share of the EU population living below the poverty threshold and in arrears for mortgage or rent, utility bills or hire purchase payments was 2.8 times higher than the corresponding share of the population living above the poverty threshold and having this type of debt. This ratio increased gradually to reach a peak of 3.1 in 2017, and then it slightly decreased. In 2020 and 2021 the likelihood of being in arrears stood again at 3.1 times higher when living below the poverty threshold than when living above it, across the EU.
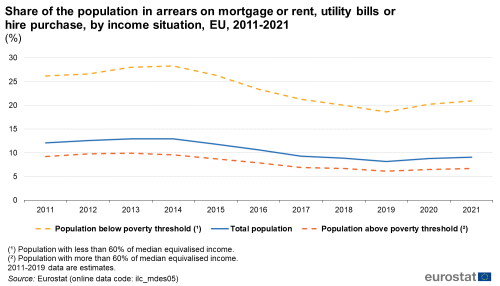
(%)
Source: Eurostat (ilc_mdes05)
Household composition may influence the ability of individuals to service their debt and other regular expenses. People living in single person households with dependent children or households with three or more dependent children are more likely to face economic insecurity than the population as a whole (see Figure 6).
While just under one tenth (9.1 %) of the EU population was in arrears for mortgage or rent, utility bills or hire purchase payments in 2021, this share was twice as high (18.4 %) among people living in single person households with dependent children. It was also considerably higher (15.0 %) for the population living in households composed of two adults with three or more dependent children. Across Member States, a higher than average share of single person households with children were in arrears; this share was highest in Greece (48.9 %) followed by 39.1 % in Cyprus. In 12 countries, at least every fifth single parent household was being in arrears. The difference compared to the total population was the largest in Ireland (38.0 % compared to 13.6 % of the total population), Croatia (38.6 % compared to 16.6 %) and Cyprus (39.1 % compared to 17.3 %). In Ireland and Croatia, single parent households were also 19.6 pp and 18.0 pp respectively more likely to live in arrears compared to households composed of two adults with three or more dependent children. Across the EU Member States a higher than average share of the population living in households composed of two adults with three or more dependent children were in arrears. This share was highest in Greece (46.8 %), followed by 35.4 % in Bulgaria. The greatest differences compared to the total population were recorded in Bulgaria, Malta and Hungary (15.0 pp, 14.0 pp and 13.8 pp difference, respectively).
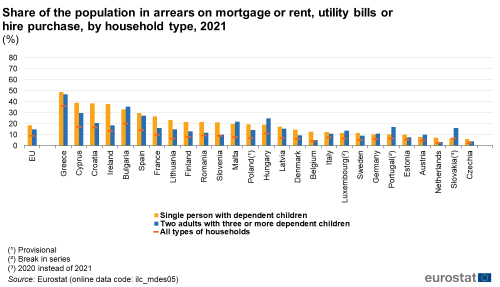
(%)
Source: Eurostat (ilc_mdes05)
Physical safety
Physical safety, or how it is perceived, constitutes another factor determining people’s sense of well-being. Within the context of this article, physical safety refers to being protected from any situation that puts an individual’s physical security at risk this may include crime and violence. Often a perceived lack of physical safety may affect subjective well-being more than the effect of any real threat. For example, homicide causes only a small fraction of the total number of deaths in the EU each year, however, its influence on people’s emotional lives can be considerable. Consequently, some crimes that have the potential to affect a person’s physical safety are often socially magnified, with an increase in feelings of insecurity or anxiousness.
In 2020 (the year with the latest available data), the ratio of homicides per 100 000 inhabitants was the highest in Latvia (4.88 homicides per 100 000 inhabitants), followed by Lithuania (3.54) and Estonia (2.78). The lowest homicide ratios were recorded in Luxembourg (0.32), Italy (0.48) and Slovenia (0.52). (See Figure 7.)
A comparison between 2010 and 2020 reveals that the number of homicides per 100 000 inhabitants fell in most of the Member States. The rate increased only in five Member States: Latvia, Cyprus, Sweden, Malta and France.
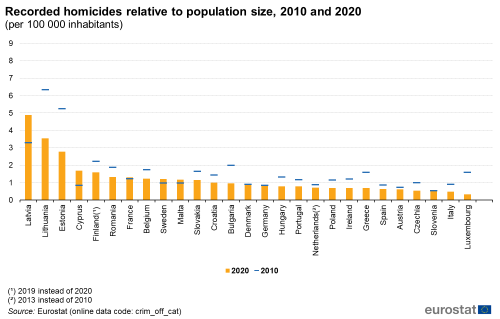
Source: Eurostat (crim_off_cat)
Individual perceptions of crime rates do not always correspond to the actual prevalence of offences; this is one reason why subjective indicators may be useful as a complement to objective indicators. Across the EU, in 2020, about one in ten persons (10.7 %) perceived that there had been crime, violence or vandalism in the area where they lived (see Figure 8). This share was the highest in Bulgaria, where almost one fifth (19.1 %) of the population had this sentiment, followed by 18.1 % in Greece and 17.7 % in France. There were 16 Member States where this share was less than 10.0 %, with the lowest rates recorded in Croatia (2.4 %), Lithuania (3.3 %), Slovakia (4.3 %) and Poland (4.4 %). Examples of differences between objective and subjective indicators include Latvia and Lithuania, which were on the top of the list for recorded homicides, but in the bottom quarter regarding the perceived level of violence. In Greece for example it is the reverse: while recorded homicides were low, a high share of the population perceived crime and violence to be happening close to them.
Between 2010 and 2020, there was generally a fall in the share of the population that perceived crime, violence or vandalism was happening in the area they lived. Across the EU, this proportion fell from 13.1 % in 2010 to 10.7 % in 2020. The greatest reduction in this share was in Latvia (from 23.8 % to 5.3 %), Estonia (18.0 % to 5.5 %), Czechia (15.4 % to 6.1 %) and Bulgaria (27.7 % to 19.1 %). By contrast, the percentage of the population that perceived crime, violence or vandalism in the area they lived in increased slightly in six Member States, with Sweden recording the largest increase (from 10.4 % to 13.8 %).
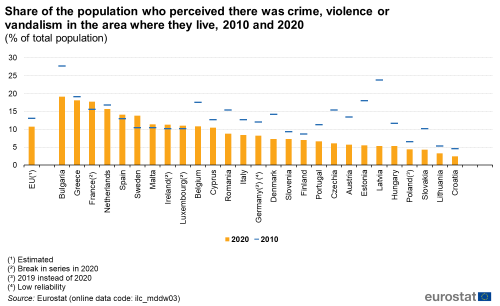
(% of total population)
Source: Eurostat (ilc_mddw03)
Figure 9 presents the reported perception of crime, violence and vandalism by income situation. While 13.7 % of the EU population who were living below the poverty threshold in 2020 perceived there was crime, violence or vandalism in the area where they lived, this proportion was somewhat lower among the population living above the poverty threshold (10.2 %). The difference was particularly apparent in France with respective proportions of 27.0 % and 16.2 %. The share for people living below the poverty threshold was at least 50 % higher than the share for people living above the poverty threshold in Finland, Slovakia, Hungary, Portugal, France and Belgium. In Finland, the share of people below the poverty threshold perceiving crime in their area was more than double that of the share of people above the poverty threshold.
This pattern was repeated in a majority of the EU Member States, however not in all. There were four Member States where people living above (rather than below) the poverty threshold perceived a higher level of crime, violence or vandalism in their area: Cyprus, Croatia, Poland and Greece.
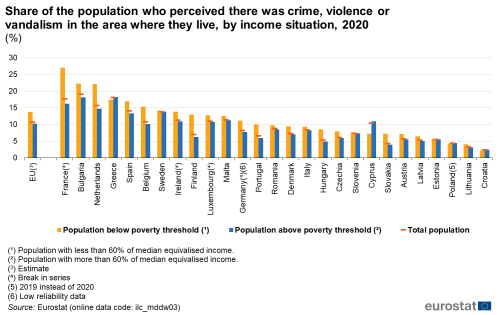
(%)
Source: Eurostat (ilc_mddw03)
There were also notable differences in the perception of crime by degree of urbanization, as shown by Figure 10. In 2020, the perception among the EU population that these issues were of relevance to the area where they lived was considerably higher for people living in cities (16.3 %) than it was for people living in either towns and suburbs (8.4 %) or rural areas (5.8 %).
As regards cities, in 2020 the proportion of the population that perceived there was crime, violence or vandalism in the area where they lived was highest in Greece (28.8 %), France (27.0 %) and Bulgaria (26.6 %). The share of people living in Greek cities that perceived such problems was 1.8 times higher than the EU average (16.3 %). At the other end of the range, some of the lowest levels of perceived crime - across all three degrees of urbanisation - were recorded in Croatia and Lithuania.
In almost all of the Member States, the highest perception of crime, violence or vandalism was recorded among people living in cities. More than one quarter of city-dwellers in Greece, France and Bulgaria reported such safety problems. The lowest share of perceived crime, violence or vandalism was generally recorded among people living in rural areas. This pattern was repeated in most Member States except Belgium, Romania and Hungary, for which the lowest rate was recorded for towns and suburbs.
The most noticeable differences between cities and rural areas were observed in Germany, where the share of city dwellers who perceived that there was crime, violence or vandalism in their area was 9.5 times higher than that of people living in rural areas. In Poland, Austria and Greece the proportion of people perceiving safety problems among city-dwellers was at least 4.6 times higher than that of people living in rural areas. However, in Hungary and Cyprus the share of city dwellers who perceived such problems was less than that recorded among people living in rural areas.
(%)
Source: Eurostat (ilc_mddw06)
Conclusions
The data show that the global financial and economic crisis had a stronger impact on the economic security of individuals in the EU than the COVID-19 crisis. There was a gradual increase in the share of the population that was unable to cope with unexpected expenses until 2012; while the same was true for those in arrears on regular monthly payments until 2014. Both of these shares fell during the subsequent years. The trend has changed and a moderate increase was seen in 2020 and 2021.
A relatively high share of the populations of Greece, Bulgaria and Cyprus had arrears on mortgage payments, rent, utility bills or hire purchase payments in 2021, while economic insecurity - as measured by the share of the population that was unable to cope with unexpected financial expenses - affected almost half of the population of Romania, Croatia and Greece.
Households composed of single adults with dependent children were generally the most economically vulnerable subpopulation when analyzing the information by type of household.
Individual perceptions of crime rates do not always correspond to the actual prevalence of recorded offences. There was a considerable variation concerning the incidence of homicides relative to population size across the Member States in 2020: the highest ratio was recorded in Latvia, where the incidence of homicides was 15 times higher than in Luxembourg (which had the lowest ratio). However, regarding the perception of crime and vandalism in the area, the residents of Latvia were in the bottom quarter. The perceived level of crime, violence or vandalism was generally higher among people living below the poverty threshold than it was for people living above the poverty threshold, suggesting that crime may be more prevalent in poorer areas. It was also much more prevalent among residents of cities.
Data sources
The data used in this article are primarily derived from the EU’s statistics of income and living conditions (EU-SILC) survey.
EU-SILC is the principal instrument measuring income and living conditions in Europe, and is the main source of information on quality of life at individual and household level. These data are used for the section of economic security, expressed through indicators that provide a proxy for wealth (for example, the share of the population unable to cope with unexpected financial expenses) and debt (for example, the share of the population in arrears).
EU-SILC data are also used for the analysis of physical safety for perceived levels of crime, violence or vandalism in the areas where people live, providing subjective information. For objective information, the data is from the joint Eurostat-UNODC data collection on crime and criminal justice.
The provision of data on crime in the EU is complicated by considerable differences in the methods and definitions used in the EU Member States; this should be taken into account when using these statistical data. Crime statistics tend to be reported as ratios per 100 000 inhabitants to allow the incidence of different criminal offences to be compared across countries.
Homicide is defined as the intentional killing of a person, including murder, manslaughter, euthanasia and infanticide; it excludes death by dangerous driving, abortion, assisted suicide and attempted homicide. In contrast with other criminal offences, these statistics relate to the number of victims, rather than the number of criminal cases. Data on homicides are thought to be among the most comparable of crime statistics as they are universally reported (because of their seriousness) and there is little scope for definitions to vary (when compared with other types of crime).
Source data for tables and graphs
Context
Several aspects may unexpectedly and/or adversely affect a household’s or an individual’s material conditions, as well as their physical security. In the quality of life context, economic security and vulnerability are analyzed in relation to wealth and debt, while physical and personal safety is measured by the recorded incidence of criminal offences as well as perceived levels of crime in areas where people live. Subjective perceptions may result in feelings of insecurity that have the potential to undermine an individual’s quality of life.
A variety of risks may threaten the material conditions and safety of individuals and households. Examples at an individual level include losing one’s job, health problems, or ageing. Events at a national or even global level may also have an impact, such as the COVID-19 pandemic or the global financial and economic crisis which resulted in a deterioration of economic conditions and a fall in living standards for EU citizens. Alongside these economic aspects that may affect an individual’s quality of life, there are many non-economic risks, such as violence and crime, which may endanger an individual’s physical safety. Even in cases where these risks do not materialize, the subjective perception of such a threat may lead to feelings of insecurity which can effectively undermine an individual’s quality of life.
The first section of this article is based on a combination of subjective and objective information, with economic security being analysed in relation to disposable income or available wealth (for example, the share of the population with arrears on mortgage and rental payments). It is complemented with data based on subjective information which may help provide a more accurate picture of a person’s or a household’s level of economic security and their vulnerability to economic risk (for example, self-reported ability to cope with unexpected financial expenses).
The concept of economic security is mainly addressed by European policies that relate to the safety nets provided by the social security systems of individual EU Member States. The Social Protection Committee (SPC) is an EU advisory policy committee established by the Treaty on the Functioning of the EU (Article 160) and monitors the development of social protection policies in the EU Member States.
During the period 2015-2017 there was a wide debate around the theme of ‘social Europe’ between EU institutions, Member States, social partners, civil society and citizens. Developments in this policy area centred on a new pillar of social policy: in November 2017, the European Pillar of Social Rights was proclaimed during a summit for fair jobs and growth that took place in Gothenburg, Sweden. It aims to deliver fairness and social justice through new and more effective rights for citizens (the social acquis) and has three main categories covering 20 different principles that are spread over policy areas such as housing, education, social or health care, and employment:
- equal opportunities and access to the labour market;
- fair working conditions;
- social protection and inclusion.
The third category covers a broad range of principles that may be grouped under the heading of safety, covering: childcare and support to children; social protection; unemployment benefits; minimum income; old-age income and pensions; health care; inclusion of people with disabilities; long-term care; housing and assistance for the homeless; access to essential services.
A new Action plan for the implementation of the European Social Pillar has been published by the European Commission in March 2021.
The European Commission has set out a new EU Security Union Strategy to protect everyone in the EU and promote our European way of life. The strategy covers the period from 2020 to 2025 and focuses on priority areas where the EU can help Member States in fostering security for all of those living in Europe, while respecting our European values and principles. The European Commission presents bi-annually progress reports on the implementation on the EU Security Union Strategy.
Direct access to
- All articles on crime
- All articles on quality of life
- Quality of life indicators (online publication)
Further Eurostat information
Main tables
- People at risk of poverty or social exclusion (Europe 2020 indicators) (t_ilc_pe)
- Income distribution and monetary poverty (t_ilc_ip)
- Living conditions (t_ilc_lv)
- Material deprivation (t_ilc_md)
- Quality of life, see:
- Material living conditions (qol_mlc)
- Productive or other main activity (qol_act)
- Health (qol_hlt)
- Education (qol_edu)
- Leisure and social interactions (qol_lei)
- Economic security and physical safety (qol_saf)
- Governance and basic rights (qol_gov)
- Natural and living environment (qol_env)
- Overall experience of life (qol_lif)
- Recorded offences by offence category - police data (crim_off_cat)
- Recorded intentional homicide and sexual offences (crim_hom)
- Court processes (cim_crt)
- Prison and prisoner characteristics (crim_pris)
- People at risk of poverty or social exclusion (Europe 2020 indicators) (ilc_pe)
- Income distribution and monetary poverty (ilc_ip)
- Living conditions (ilc_lv)
- Material deprivation (ilc_md)
- EU SILC ad-hoc modules (ilc_ahm)