Businesses in the professional, scientific and technical activities sector
Data extracted in March 2023
Planned article update: 7 June 2024
Highlights
The professional, scientific and technical activity sector accounted for 8.8 % of the total number of persons employed in the EU in 2020.
The professional, scientific and technical activity sector accounted for 19.2 % of the total number of enterprises in the EU in 2020.
(% share of sectoral value added) - Source: Eurostat (sbs_sc_1b_se_r2)
This article presents an overview of statistics for the European Union’s (EU) professional, scientific and technical services sector, as covered by NACE Rev. 2 Section M. These activities often require a high degree of education and training and make specialised knowledge and skills available to clients who may be other business users or private individuals. This article belongs to a set of statistical articles on 'Business economy by sector'.
Full article
Structural profile
The EU’s professional, scientific and technical activity sector (NACE Section M) numbered 4.5 million enterprises in 2020, a small increase of 1.5 % compared to 2019. It employed 11.2 million persons, a decrease of only 1.6 % compared to pre-pandemic times and it has generated €595.3 billion of value added, 0.4 % less than in the previous year. This sector’s contribution to the non-financial business economy (Sections B to J and L to N and Division 95) was 19.2 % of the enterprise population, 8.8 % of the employment, and 9.2 % of value added.
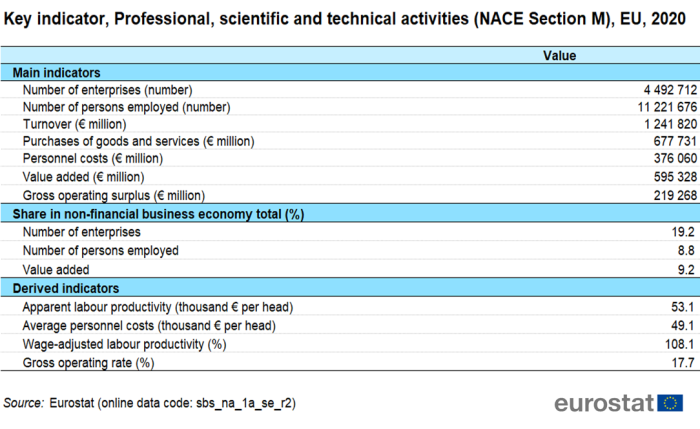
The apparent labour productivity of the EU’s professional, scientific and technical activity sector in 2020 was €53 100 per person employed, which was slightly above the non-financial business economy average of €50 900 per person employed. Alongside this high apparent labour productivity, average personnel costs within the professional, scientific and technical activity sector were €49 100 per employee, which was above the average for the non-financial business economy (€36 400 per employee).
The wage-adjusted labour productivity ratio shows that value added per person employed was equivalent to 108.1 % of average personnel costs per employee across the EU in 2020. This ratio was under the non-financial business economy average (139.8 %) and the third lowest in the non-financial business economy (Sections B to J and L to N and Division 95). The EU’s professional, scientific and technical activity sector recorded a gross operating rate of 17.7 % in 2020, higher than the 10.2 % average for the whole of the non-financial business economy.
Sectoral analysis
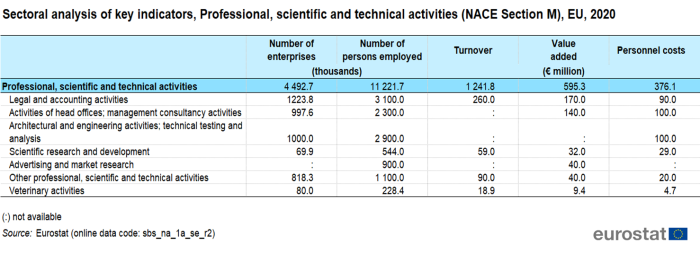
The professional, scientific and technical activities sector can be divided into seven subsectors at the NACE division level. Among these, according to the data available for 2020, there were big differences in their contribution to value added and employment. Three subsectors, namely legal and accounting activities (Division 69), activities of head offices; management consultancy activities (Division 70) and architectural and engineering activities; technical testing and analysis (Division 71) provided in total almost 80 % of EU sectorial value added and around 75 % of its employment in 2020. Veterinary activities (Division 75) was the smallest sector in both value added and employment terms, with 1.6 % and 2.0 % respectively.

(% share of sectoral total) - Source: Eurostat (sbs_na_1a_se_r2)
The subsector 'Activities of head offices; management consultancy activities' recorded the highest levels of apparent labour productivity (€60 900 per person employed), closely followed by scientific research and development (Division 72) with €58 800 per person employed. In terms of average personnel costs, among the five subsectors for which data are available, the same two subsectors recorded the highest levels in the EU across the professional, scientific and technical services sector in 2020, with €62 500 and €59 200 per employee respectively.
Within the EU, the lowest levels of apparent labour productivity among the subsectors that form professional, scientific and technical services were recorded for other professional, scientific and technical services (€36 400 per person employed), the veterinary activities (€41 100 per person employed) and advertising and market research (€44 400 per person employed) — see Table 2b — these three subsectors reported apparent labour productivity which was below the non-financial business economy average (€50 900 per person employed).
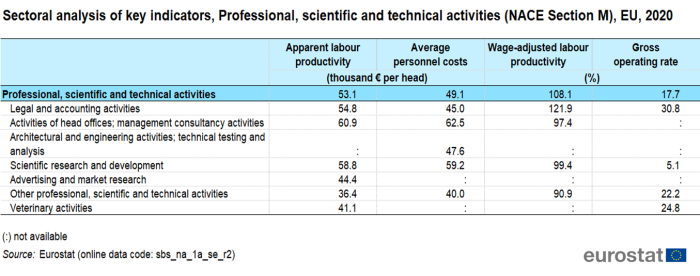
Three of the seven subsectors for which data are available recorded a gross operating rate in 2020 that was equal to or higher than the non-financial business economy average (10.2 %). This was particularly the case for the EU’s veterinary activities (24.8 %) and for other professional, scientific and technical activities (22.2 %). Conversely, scientific research and development recorded substantially lower rates (5.7 %).
Country overview
The most specialized EU Member States in employment terms in the professional, scientific and technical services sector in 2020 were Sweden, Hungary, Ireland, Cyprus, Belgium, Malta, the Netherlands and Luxembourg as each contributed to more than 10 % of their non-financial business economy employment in these activities. Five out of these eight Member States also occupied the top of the ranking in relation to the most specialized Member States for value added, with double-digit shares of at least 10 %. Based on value added, specialization peaked in Luxembourg, where 21.6 % of non-financial business economy value added was generated by the professional, scientific and technical services sector in 2020.
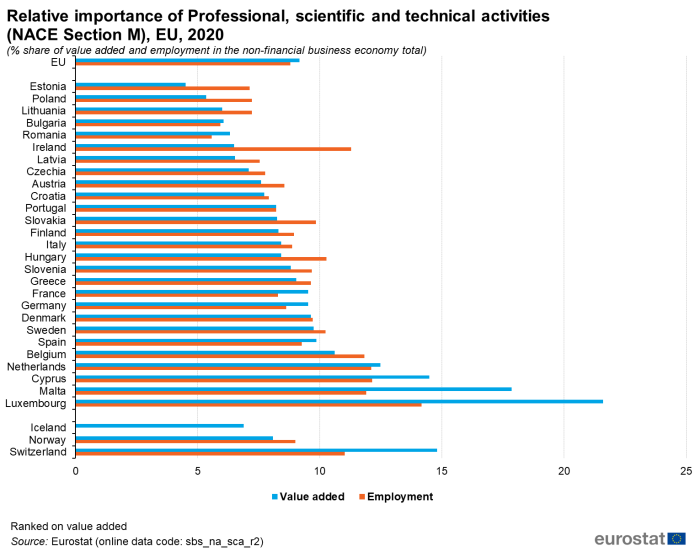
(% share of value added and employment in the non-financial business economy total) - Source: Eurostat (sbs_na_sca_r2)
Germany had the largest share of EU within the professional, scientific and technical services sector in 2020 in both value added (29.1 %) and sectorial employment (22.6 % of the total). The five largest EU Member States generated 70.9 % of the EU’s value added and contributed to almost two thirds (63.1 %) of the EU’s employment which is in line with shares for non-financial economy as whole.
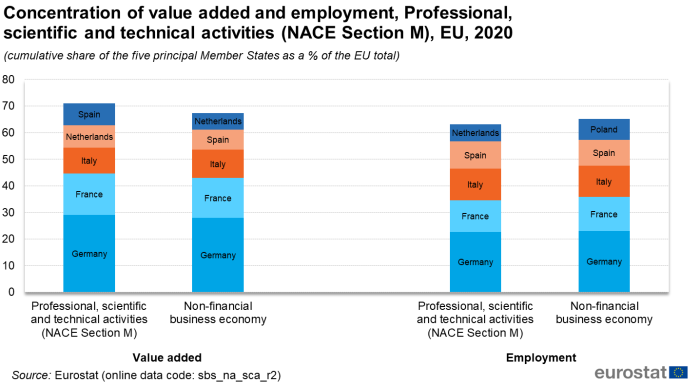
(cumulative share of the five principal Member States as a % of the EU total) - Source: Eurostat (sbs_na_sca_r2)
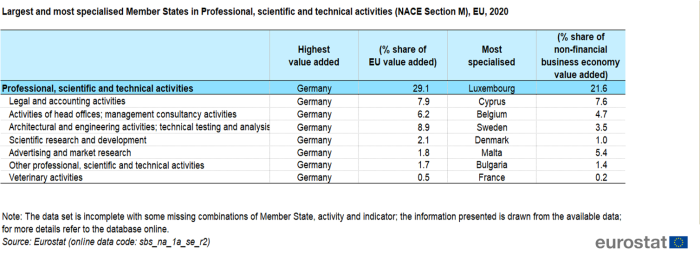
More detailed analysis by NACE division, shows that Germany had the highest level of value added among the EU Member States in all seven subsectors.
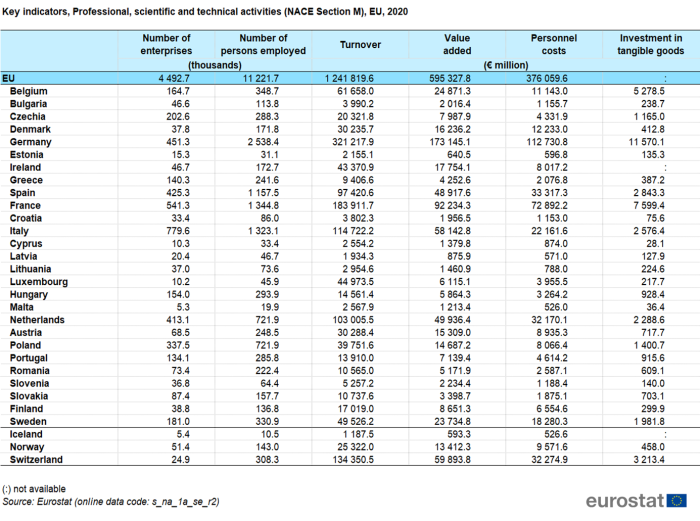
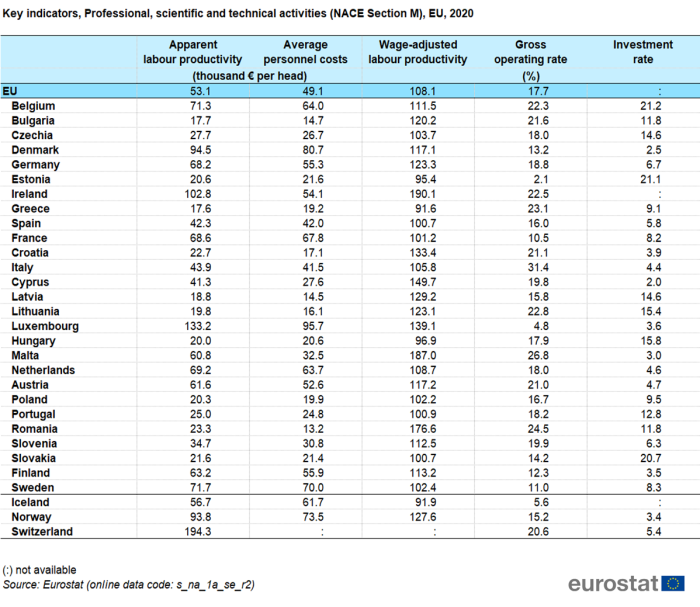
The apparent labour productivity of the professional, scientific and technical services sector in 2020 was less than €20 000 per person employed in Greece, Bulgaria, Latvia and Lithuania, while it exceeded €75 000 per person employed in Denmark, Ireland and peaking at €133 200 per person employed in Luxembourg. It was even higher, at €194 300 per person employed in Switzerland (non-member country). However, after adjusting for the average personnel costs the ranking of countries according to the wage-adjusted labour productivity was a bit different. Romania was in the third highest position, with 176.6 %, having the lowest average personnel costs and one of the lowest apparent labour productivity. Higher wage-adjusted labour productivity than Romania were recorded for only Malta (187.0 %) and Ireland (190.1 %). Together with Cyprus (149.7 %), these four countries were the only EU Member States to record a wage-adjusted labour productivity ratio for the professional, scientific and technical services sector that was above the EU's average for the non-financial business economy (€139.8 %). At the other side, Greece, Estonia and Hungary had wage-adjusted labour productivity ratios below parity, mainly due to lower apparent labour productivity.
Size class analysis
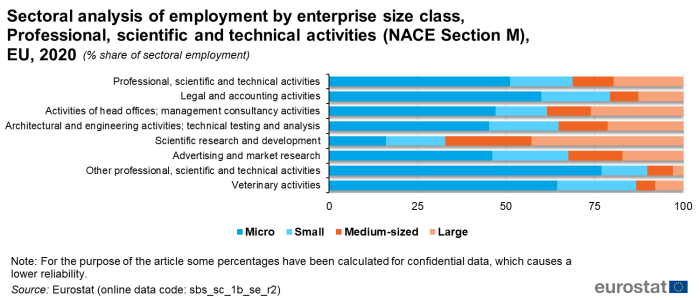
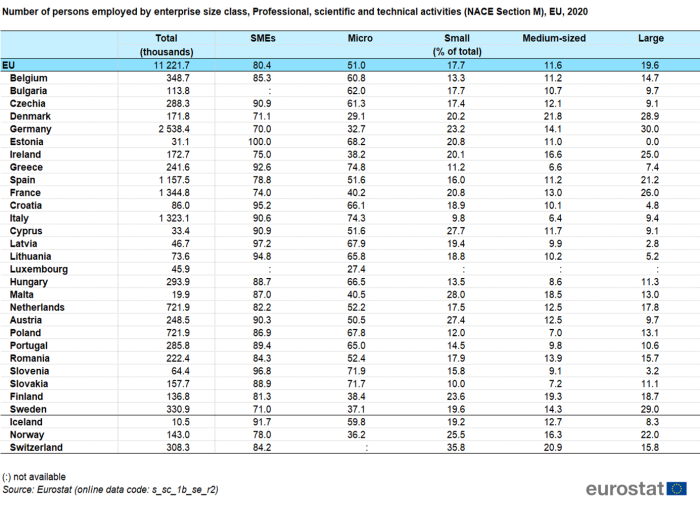
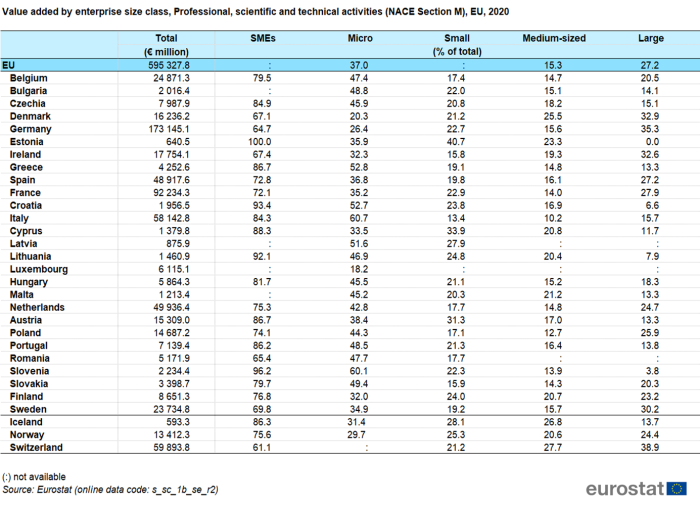
The role of micro enterprises (employing fewer than 10 persons) within the professional, scientific and technical services sector was considerable. There were more almost 4.4 million micro enterprises across the EU in 2020, accounting for 97.3% of the total enterprise population. They provided work to almost 5.7 million persons, which equated to slightly more than half (51.0 %) of the employment within the professional, scientific and technical services sector. While micro enterprises generated the highest level of value added (€220.1 billion), their contribution to the sectorial value added total was less marked (37.0 %) than their employment contribution, therefore suggesting that they had a relatively low level of apparent labour productivity when compared with the three remaining size classes. Indeed, each person employed by a micro enterprise within the EU’s professional, scientific and technical services sector generated an average of €38 400 of added value in 2020. Apparent labour productivity was much higher for medium-sized enterprises with €70 000 per person employed, 1.8 times the ratio recorded for micro enterprises.
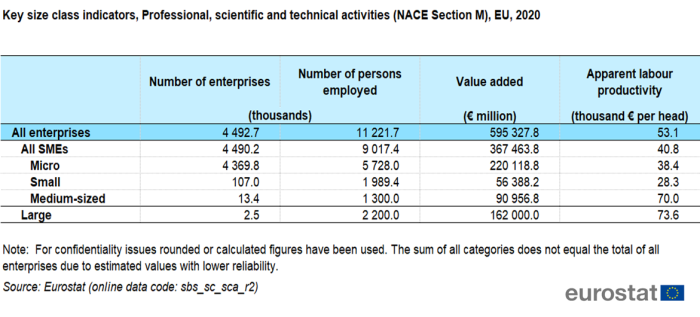
The relative importance of small enterprises (employing 10 to 49 persons) and large enterprises (employing 250 or more persons) to the EU’s professional, scientific and technical services sector in terms of employment was quite similar, accounting for 17.7 % and 19.6 % of the sectorial employment in 2020. Medium-sized enterprises (employing 50 to 249 persons) accounted for a somewhat smaller share of total activity in the sectorial employment.
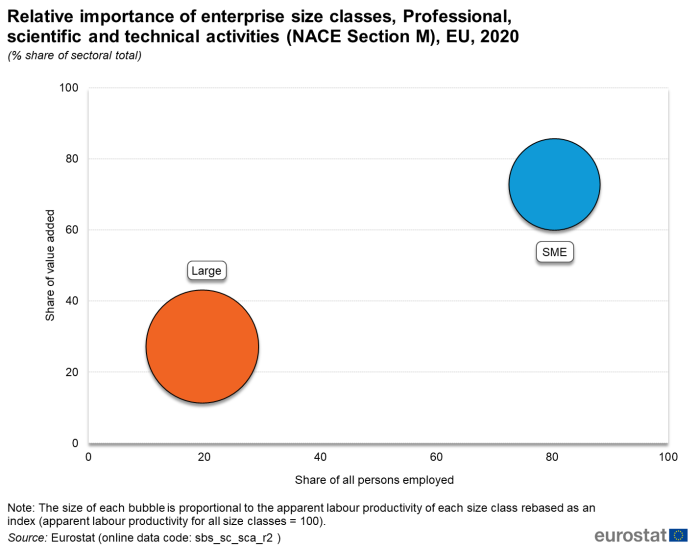
(% share of sectoral employment) - Source: Eurostat (sbs_na_1a_se_r2)

(% share of sectoral value added) - Source: Eurostat (sbs_sc_1b_se_r2)
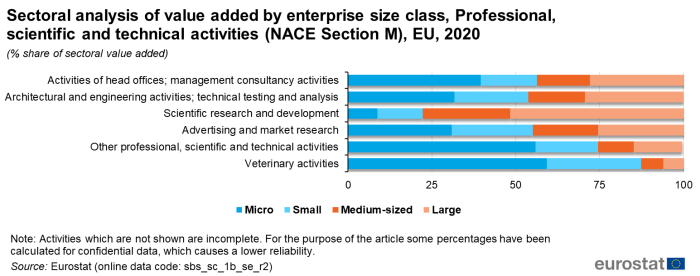
(% share of sectoral value added) - Source: Eurostat (sbs_sc_1b_se_r2)
Among the professional, scientific and technical services activities of the EU, micro enterprises accounted for the largest share of the employment in all subsectors in 2020, except for the scientific research and development subsector, where the role of medium and especially of large enterprises is much more relevant both in terms of employment and value added.
Data sources
Coverage
In NACE the following seven divisions are included as part of this sector:
- legal and accounting activities (Division 69);
- activities of head offices and management consultancy activities (Division 70);
- architectural, engineering and technical consultancy services (Division 71);
- scientific research and development (Division 72);
- advertising (including direct mailing) and market research (Division 73);
- other professional, scientific and technical services such as design, photography, translation and interpretation services (Division 74);
- veterinary services for farm animals and pets (Division 75).
The professional, scientific and technical services sector does not include activities of holding companies that are not engaged in managing (which are classified as a financial activity), while management consultancy does not include educational consultancy activities (which are part of the education sector). Test drilling in connection with mining operations is considered part of the mining and quarrying sector (Section B) rather than technical consultancy.
Data sources
The analysis presented in this article is based on the main dataset for structural business statistics (SBS), size class data and regional data, all of which are published annually.
The main series provides information for each EU Member State as well as a number of non-member countries at a detailed level according to the activity classification NACE. Data are available for a wide range of variables.
In structural business statistics, size classes are generally defined by the number of persons employed. A limited set of the standard structural business statistics variables (for example, the number of enterprises, turnover, persons employed and value added) are analysed by size class, mostly down to the three-digit (group) level of NACE. The main size classes used in this article for presenting the results are:
- small and medium-sized enterprises (SMEs): with 1 to 249 persons employed, further divided into:
- micro enterprises: with less than 10 persons employed;
- small enterprises: with 10 to 49 persons employed;
- medium-sized enterprises: with 50 to 249 persons employed;
- large enterprises: with 250 or more persons employed.
Structural business statistics also include regional data. Regional SBS data are available at NUTS levels 1 and 2 for the EU Member States, Iceland and Norway, mostly down to the two-digit (division) level of NACE. The main variable analyzed in this article is the number of persons employed. The type of statistical unit used for regional SBS data is normally the local unit, which is an enterprise or part of an enterprise situated in a geographically identified place. Local units are classified into sectors (by NACE) normally according to their own main activity, but in some EU Member States the activity code is assigned on the basis of the principal activity of the enterprise to which the local unit belongs. The main SBS data series are presented at national level only, and for this national data the statistical unit is the enterprise. It is possible for the principal activity of a local unit to differ from that of the enterprise to which it belongs. Hence, national SBS data from the main series are not necessarily directly comparable with national aggregates compiled from regional SBS.
Context
Many of the services covered within this article could be performed in-house by enterprises themselves, but purchasing (outsourcing) them from service providers enables them to focus on their core activities, taking advantage of the specialization offered by service providers. As such, an efficient and successful professional, scientific and technical services sector can contribute to the overall competitiveness of an economy.
Some professional and technical services are closely regulated by national governments and professional bodies, with restrictions on the number of entrants into the profession, rates charged and billing arrangements, organisational structure of businesses providing these services, exclusive rights enjoyed by practitioners, and the ability to advertise.
The freedom to provide services and the freedom of establishment are central principles to the internal market for services. They guarantee EU enterprises the freedom to establish themselves in other Member States, and the freedom to provide services on the territory of another Member State. The Directive on services in the internal market (COM(2006) 123) aims to achieve a genuine internal market in services, removing legal and administrative barriers to the development of services activities between Member States. As well as covering many professional, scientific and technical services (with the notable exception of services covered by notaries), the Directive applies to a wide variety of services including industrial and construction activities, as well as distributive trades, accommodation and food services, real estate, administrative and support service activities.
Direct access to
Structural business statistics introduced
Other analyses of the business economy by NACE Rev. 2 sector
- SBS – services (sbs_serv)
- Annual detailed enterprise statistics - services (sbs_na_serv)
- Annual detailed enterprise statistics for services (NACE Rev. 2 H-N and S95) (sbs_na_1a_se_r2)
- SMEs - Annual enterprise statistics by size class - services (sbs_sc_sc)
- Services by employment size class (NACE Rev. 2 H-N and S95) (sbs_sc_1b_se_r2)
- Annual detailed enterprise statistics - services (sbs_na_serv)
- SBS - regional data - all activities (sbs_r)
- SBS data by NUTS 2 regions and NACE Rev. 2 (from 2008 onwards) (sbs_r_nuts06_r2)
- Business economy by sector - NACE Rev. 2 (online publication)
- Decision 1578/2007/EC of 11 December 2007 on the Community Statistical Programme 2008 to 2012
- Regulation (EC) No 295/2008 of 11 March 2008 concerning structural business statistics
- Summaries of EU Legislation: Business statistics