Population grids
This article introduces population grid statistics as an alternative to population statistics for administrative areas. Population grids are a powerful tool to describe our society and to study the interrelationships between human activities and the environment. They are particularly useful for analysing phenomena, and their causes, which are independent of administrative boundaries, such as flooding, commuting and urban sprawl, to name but a few.
The article also presents the GEOSTAT 2011 population-grid dataset as a first example of a European Union (EU) population grid. The European Statistical System (ESSnet) project GEOSTAT 1, launched in co-operation with the European Forum for Geography and Statistics (EFGS) seeks to represent the main characteristics of the 2011 population and housing census in a 1 km2 grid dataset and, more generally, to promote geocoding of statistics.
Full article
Grid statistics
Why grid statistics?
Statistical grid data are statistics geographically referenced to a system of (usually squared) grid cells in a grid net with Cartesian coordinates. Traditionally, official statistics are reported in accordance with a hierarchical system of administrative units ranging from the local to the EU level and usually under the control of an official authority. In the EU the NUTS is the most important example of such an output system. While this is excellent for accounting purposes, and for reporting to the respective authority administering the territory, it is not suitable for studying causes and effects of many socioeconomic and environmental phenomena, such as flooding, commuting, mobility, leisure etc. When studying such phenomena, a system of grids with equal-size grid cells has many advantages:
- grid cells all have the same size allowing for easy comparison;
- grids are stable over time;
- grids integrate easily with other scientific data (e.g. meteorological information);
- grid systems can be constructed hierarchically in terms of cell size thus matching the study area; and
- grid cells can be assembled to form areas reflecting a specific purpose and study area (mountain regions, water catchments).
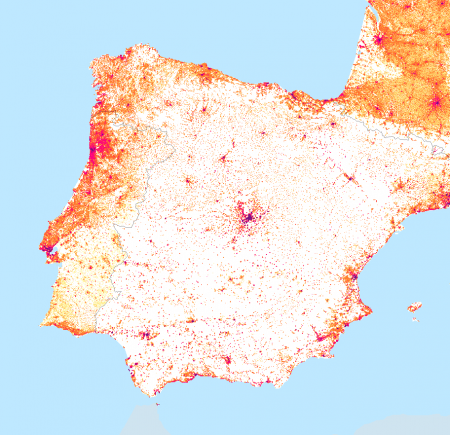
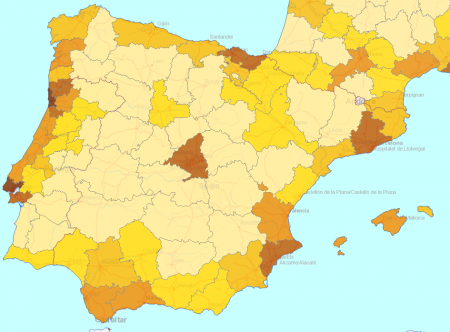
Figures 2 and 3 highlight the systemic advantage of grid statistics over statistics based on larger administrative or statistical areas. In Figure 3, with the population density at NUTS 3 level, the centre of Spain around Madrid does not display any density modulation, whereas the grid in Figure 2 shows very clearly the extremely dispersed population distribution in the region around the Spanish capital. Hence only grid statistics can provide a realistic portrait of where people actually live and how many there are.
Production of grid statistics
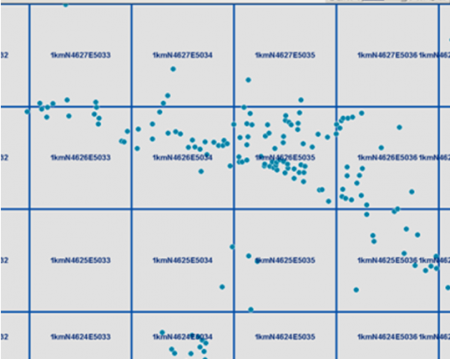
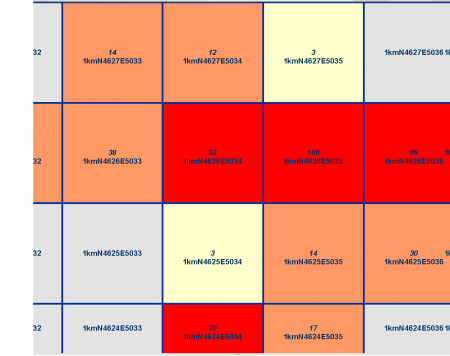
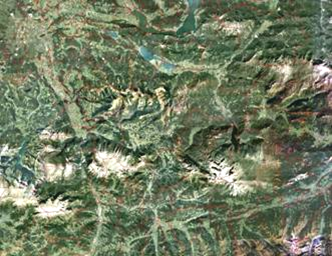
Normally, the production of grid statistics requires the existence of geo-referenced point datasets with high spatial accuracy (see Figure 4); in most cases, these are building, business and address registers geocoded with geographic coordinates to which the statistical information can be referenced. In a second step, these point-based data can be aggregated to whatever area is required, including squared grid cells (see Figure 5). Since geocoded registers have a long tradition in the Scandinavian countries, they also developed the earliest examples of modern population grids in the 1970s.
Geocoded administrative data sources with sufficient accuracy and reliability are now available in many European countries. The Regulation (EC) 763/2008 on the population and housing census requires population and housing topics to be available at a fairly high spatial resolution, down to local administrative unit 2 (LAU2). To meet this requirement and as part of a general trend in public administration the census has triggered initiatives for establishing geocoded building, address- and population registers in a number of countries that serve as input for the GEOSTAT 2011 1 km2 population grid.
In the absence of geocoded population registers, disaggregation and spatial modelling techniques can help to fill the gaps. This system should not replace the existing NUTS classification, but complement it where the NUTS have limitations [1].
The GEOSTAT initiative
An ESSnet project, GEOSTAT 1 was launched at the beginning of 2010 by Eurostat and the EFGS to promote grid-based statistics. The initiative aimed at developing common guidelines for the collection and production of population grid statistics of the 2011 population census.
The ultimate goal is to establish a spatial reference system for official statistics in Europe and set out the framework for spatial statistics. The first phase towards this ambitious goal is the GEOSTAT 2 project with the objective of developing a point based spatial reference framework based on geocoded address, building and dwelling registers. This system will also be the geospatial foundation for all future censuses. Although the GEOSTAT system is abstract, it is very simple. It is based on the study of points and other geospatial objects relevant in statistics, registered in space and time [2].
The GEOSTAT 2006 prototype
One of the first results from the GEOSTAT 1 project was a prototype European population grid dataset for the reference year 2006 at 1 km2 resolution. The GEOSTAT 2006 dataset already contains the total population of the four EFTA countries and all EU Member States, with the exception of Cyprus for which no LAU2 population data were available for the reference year 2006. However its main purpose has been to develop a methodology for population grids and testing it on real data. In particular the main purpose of the GEOSTAT 2006 dataset has been to understand if disaggregated and aggregated population grid data can be fused into one integrated grid dataset.
The geospatial framework is a standardised 1 km x 1 km grid net following the INSPIRE specifications and adopted the ETRS89 Lambert Azimuthal Equal Area coordinate reference system.
12 European countries provided national statistical grid data derived from point data sources, in most cases georeferenced population and address registers. This methodology was designated ‘aggregation’, since each square kilometre included the points within its boundaries. The remaining 18 grid datasets, where the coordinates or addresses did not exist, were produced using a spatial model. Research into the quality of the spatial model however revealed that at the very local scale, disaggregated data has quality issues (see section ‘Quality issues and model restrictions’ below). As a result the efforts to obtain more, properly geocoded national grid data were increased.
The GEOSTAT 2011 population grid
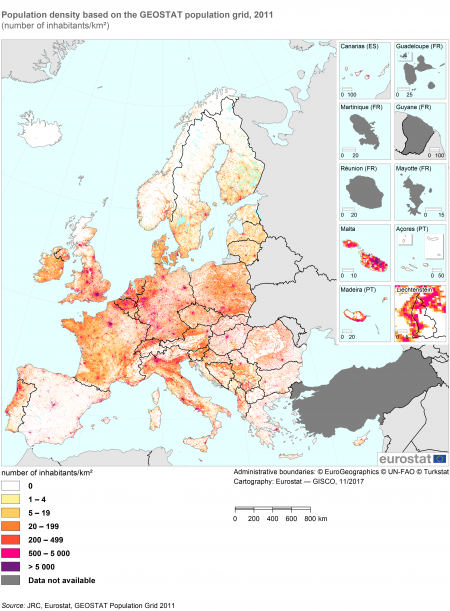
Building on the methodological work of the 2006 prototype grid GEOSTAT 1 continued the successful work on 2011 census data, producing a GEOSTAT 2011 population grid (Figure 1). The project also aimed at investigating the possibilities of mapping population breakdowns and how to deal with the challenge of statistical confidentiality [3]. The project has disseminated population grid data by 1 km2 free of charge via the Eurostat website. This allowed the geographical detail of the census population to be increased from a fairly high LAU2 spatial resolution in most cases, to a very high 1 km2 resolution.
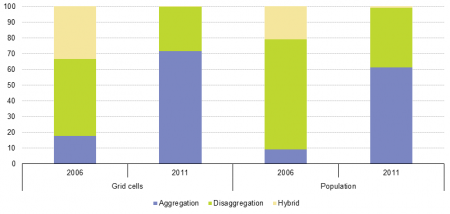
As the main result of the second phase of GEOSTAT 1 the number of countries that used the aggregation or at least a hybrid method to compile grid statistics rose to 18. The aggregation method now covered 62 % of the census 2011 population included in the grid, while in the first project these methods had a 30 % coverage of the population (Figure 8).
Methodology
Grid statistics and disclosure control
High geographical detail of statistical data dramatically increases the risk of disclosure. Therefore the issue is of prime importance for population grids. Moreover when introducing other variables associated to the population (such as sex and age classes, housing, education, etc.) problems with data confidentiality increase even more.
The GEOSTAT 1 project analysed confidentiality issues, and some indications on how to disseminate the data were put forward. GEOSTAT 2011 only contains the total population at the place of usual residence. This topic has been considered as non-sensitive by many national statistical institutes (NSI) which, as a result, did not apply any data protection at all. National data protection laws still require a number of NSIs to protect all information that would allow the identification of individuals. Most countries have set confidentiality thresholds defining the minimum number of persons in each cell that can be published without having to suppress the data. These countries have set thresholds of 3 to 10 individuals per grid cells. The goal is to show additional topics in the future but this will require a balance between data protection practices and usability of the data.
Disaggregation / aggregation
Three methodology types were used to attribute a number of inhabitants to each square kilometre cell:
Aggregation method
Grids are produced by aggregating geo-referenced micro data (also called bottom-up approach). This method requires the availability of data that has been geocoded to a geographical location that and is then aggregated into the square kilometre it is located in.
Disaggregation method
In the absence of geocoded micro data this method produces grids, using statistical data for the lowest available administrative/territorial units in combination with auxiliary spatial data (also called top-down approach). Data on land use and land cover is used to estimate the population within a particular administrative region into the square kilometre cells of that region.
Cyprus, Iceland, Malta and Luxembourg — mostly for technical reasons — have not been able to provide statistical data to GEOSTAT 2011. The Joint Research Centre (JRC) of the Commission produced disaggregated grid data using a model based on the assumption that residential population can only exist in areas where buildings seal the land. Therefore, the principal auxiliary dataset is the Global Human Settlement Layer dataset containing building footprints derived from satellite imagery.
Hybrid method
The hybrid method combines aggregation and disaggregation techniques and represents a compromise between accuracy and availability of data. The aim is to maximise the quality of the data over disaggregation alone, e.g. for different parts of a country. Hybrid could also refer to the source data, meaning a combination of different data sources with the aim of establishing a geocoded framework. Within the GEOSTAT 2011 dataset, several countries adopted a hybrid approach using national geospatial, administrative and statistical data sources. More information can be found in the quality documentation of GEOSTAT 2011.
Quality issues and model restrictions
Evidently, a few assumptions are required in order to apply the model, such as ‘the population density is proportional to the housing density’. Comparisons between aggregated and disaggregated data for the same area show that these assumptions represent an oversimplification of the real situation.
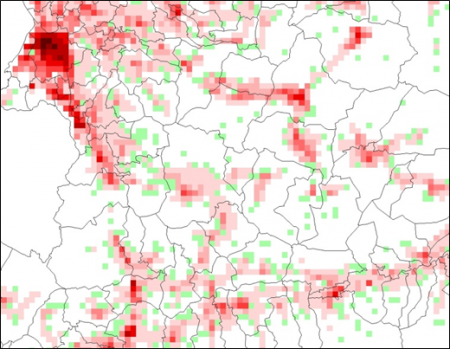
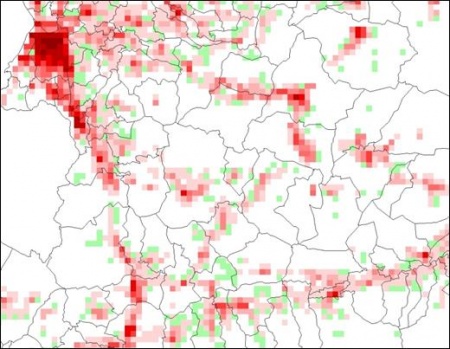
Usually disaggregation is quite successful when it comes to determining whether a grid cell is populated or not, with a detection rate of approximately 90 %. This means that a visual inspection of a grid map produced with disaggregated data compared to a grid map from aggregated data does not reveal significant differences and may give a false quality impression (see Figures 6, 7 and 8).
In terms of population per grid cell, however, the deviations compared to statistical data from NSIs are significant. If we define the relative misplacement error as the difference between the modelled population and actual population in proportion to the reference population of the area, this error is between 25 % for the Netherlands and 70 % for Norway. This means that around 50 % of the population is not located in the correct grid cell. The actual range of misplacement varies according to the size of the LAU2 area which tends to be very small in France and very large in Scandinavia.
Satellite imagery has serious limitations in defining the actual height of buildings and, as a consequence, the number of dwellings on top of each building’s footprint. Most of the misplacement errors can be attributed to the lack of building-height information and the resulting shortcomings in the density model. The model thereby tends to systematically underestimate densely populated areas while overestimating thinly populated areas to balance the totals.
Despite these quality limitations, disaggregated population grids are a valuable contribution to the GEOSTAT 2011 dataset that otherwise would have.
Population distribution in the grid dataset
The GEOSTAT 2006 datasets covers the territory of 26 EU Member States (without Cyprus or Croatia) and the four EFTA countries. A grid net of 1 km2 covering this territory contains 4 884 516 grid cells. In total 502 616 606 residents lived in the area of the GEOSTAT 2006 dataset.
In GEOSTAT 2011 Cyprus and Croatia were included in the project. The EU-28 population also increased by 1.6 % from 2006 to 2011 [4]. The 2011 European population grid included 514 988 853 inhabitants in 1 953 286 square kilometre cells. Compared to the previous 2006 grid, there were:
- 183 061 new cells with 8 306 196 inhabitants (that did not have population in 2006);
- 178 148 cells (that previously covered 4 019 186 inhabitants) had no population in 2011; and
- 1 770 225 populated cells common to both datasets.
The methodologies used by the various countries changed from 2006 to 2011 (Figure 9). Therefore, the percentage of populated grid cells (11 %) and of population (6 %) that maintained the same method does not allow a suitable assessment between the two datasets in terms of population density trends.
(%)
Source: Eurostat, GEOSTAT Population Grid 2006 and 2011 (http://ec.europa.eu/eurostat/web/gisco/geodata/reference-data/population-distribution-demography)
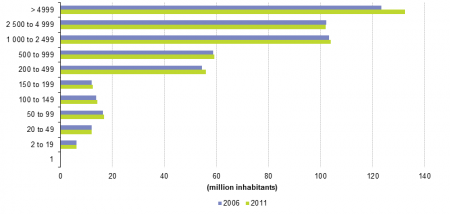
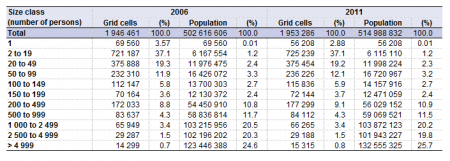
Figure 10 and Table 1 show that the population concentration in the EU and EFTA is high. Only 1 946 461 grid cells corresponding to only approximately 40 % are actually inhabited by at least one person. The average population density in Europe in 2006 was estimated at 114 inhabitants per km2 whilst the average number of inhabitants per inhabited grid cell was 258 inhabitants.
(number of people per km2)
Source: Eurostat, GEOSTAT Population Grid 2006 and 2011 (http://ec.europa.eu/eurostat/web/gisco/geodata/reference-data/population-distribution-demography)
Source: Eurostat, GEOSTAT Population Grid 2006 and 2011 (http://ec.europa.eu/eurostat/web/gisco/geodata/reference-data/population-distribution-demography)
In 2011 there were approximately 55 000 grid cells with only one inhabitant while at the other end of the scale the highest observed population per grid cell was 53 119 located in the centre of Barcelona. Around 49 million inhabitants occupied 1 508 963 grid cells in total with less than 150 inhabitants per km2. This means that only around 10 % of the European population enjoyed around 75 % of the inhabited land while 465 940 407 persons or 90 % of the population crowded into the remaining 25 % with equal or higher density than 150 inhabitants per km2. And at the very top of the density distribution, the grid cells with a population of more than 5 000 per km2 amounted to only 0.3 % of all grid cells whereas they contained some 132 million inhabitants and as such almost 25 % of the population in the grid. As can be seen in Figure 10, the higher density size classes increased in population, while the lower density classes of either stabilised or showed a slight decrease.
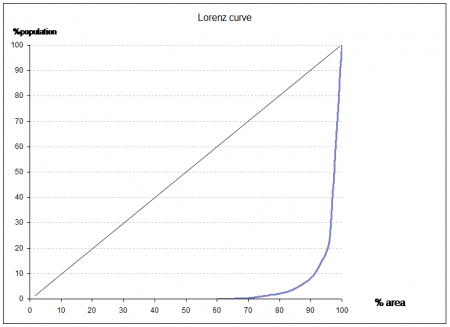
This is further illustrated by the Lorenz curve which represents the share of the territory covered in relation to the share of the population living in the territory (Figure 11). The graph is far from the diagonal which represents an equal distribution. Thus, 80 % of the territory houses 2 % of the population, and at the other end of the scale 4 % of the territory houses 76 % of the population.
1 720 grid cells are shared by two countries with a total population of approximately 710 000 persons. Only two grid cells in Europe are inhabited by citizens from three countries: one in the border triangle between France, Switzerland and Germany with ca. 3 000 inhabitants and the second is shared between the Netherlands, Germany and Belgium with only 46 inhabitants.
Use of georeferenced statistics
The application of the data has already proved very beneficial to the quality of an important branch of statistics used intensively for EU policy-making, in particular in the area of cohesion policy and the support of regional development.
The urban-rural typology and the degree of urbanisation have been reworked with the help of the GEOSTAT data and a more solid typology has been established in cooperation between various Commission DGs and the Organisation for Economic Co-operation and Development (OECD). This new typology will have direct implications for the quality of some important statistics deriving from Europe-wide surveys such as the Labour Force Survey (LFS) or the EU statistics on income and living conditions (SILC). The harmonised concept can be used to derive insights valid for all rural or urban regions. An example of this application is the sampling infrastructure, like in the case of the new Portuguese sampling for the household survey. The improvement of statistical production originates in the possibility of crossing administrative data with georeferenced buildings of the 2011 population census [5].
Source data for tables and graphs
Data sources
The GEOSTAT grid dataset is referenced to the 1 km2 INSPIRE grid net Grid-ETRS89-LAEA-1K. The GEOSTAT dataset can be accessed and used by everybody for non-commercial purposes. More information may be found on the Eurostat dedicated GISCO website from where the dataset can also be downloaded: Download the GEOSTAT 2011 and GEOSTAT 2006 population grid dataset.
Direct access to
- Regions and cities
- Territorial typologies
- Territorial typologies for European cities and metropolitan regions (background article)
- Territorial typologies manual (online publication)
Notes
- ↑ http://www.efgs.info/geostat/1B/frontpage/final-technical-report
- ↑ The European Forum for Geography and Statistics — ESSnet project GEOSTAT — Representing Census data in a European population grid (Final Report) http://ec.europa.eu/eurostat/documents/4311134/4350174/ESSnet-project-GEOSTAT1A-final-report_0.pdf/fc048569-bc1c-4d99-9597-0ea0716efac3
- ↑ http://www.cros-portal.eu/sites/default/files//Appendix15_WP4_Flyer_EFGS_GEOSTAT%5B1%5D.pdf
- ↑ Population on 1 January Code: tps00001
- ↑ http://www.cros-portal.eu/sites/default/files//Appendix10_WP1_Paper_PT.pdf
