Migrant integration statistics - education
Data extracted in July 2023.
Planned article update: July 2024.
Highlights
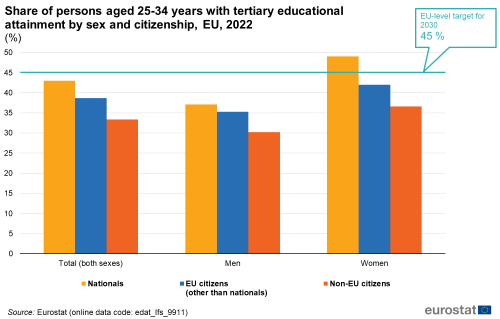
In 2022, according to the citizenship of people aged 25–34 years, 33.4 % of non-EU citizens living in the EU had a tertiary educational attainment compared with 38.7 % of citizens of an EU Member State living in another EU Member State and 43.0 % of nationals living in their own country.
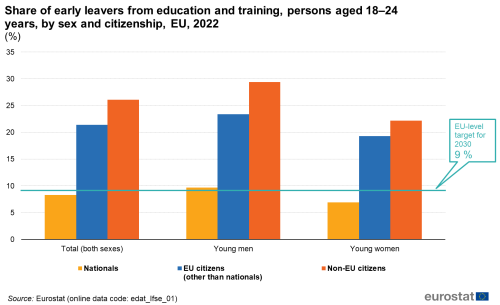
In 2022, the share of early leavers from education and training was 26.1 % for young non-EU citizens in the EU and 21.4 % for young citizens of an EU Member State living in another EU Member State. By contrast, the share of young nationals who lived in their own country and who were early leavers from education and training stood at 8.3 %.
In 2022, according to the citizenship of people aged 25–64 years, 11.6 % of non-EU citizens living in the EU had participated in learning in the four weeks prior to the 2022 survey, compared with 9.8 % of citizens of an EU Member State living in another EU Member State and 11.9 % of nationals living in their own country.
(%)
Source: Eurostat (edat_lfs_9911)
This article presents European statistics for three main education topics: educational attainment, early leavers from education and training and adult participation in learning. These topics are analysed according to an individual’s citizenship or country of birth. Information is presented for various groups of foreign citizens or foreign-born persons and compares these with nationals or native-born persons.
This article forms part of an online publication on migrant integration statistics.
Full article
Educational attainment
Educational attainment is becoming an increasingly important factor, both in the labour market and for individuals as well as society in general. In the labour market, education is valued by employers when hiring employees. In the coming years it is expected that there will be an increased demand for highly skilled people with the relevant education in order to manage jobs that are more flexible and complex. More generally, having at least an upper secondary education is often considered as the minimum level that helps individuals to be equipped for a full participation in society and to live a fulfilling life.
An analysis of educational attainment is based on the highest level of education that a person has successfully completed. Educational levels are defined and classified in the international standard classification of education (ISCED). The levels of educational attainment used in this article are based on ISCED 2011.
- A low level of education refers to ISCED levels 0–2 (less than primary, primary and lower secondary education).
- A medium level refers to ISCED levels 3 and 4 (upper secondary and post-secondary non-tertiary education).
- A high level refers to ISCED levels 5–8 (tertiary education, composed of short-cycle tertiary education, bachelor’s degree or equivalent, master’s degree or equivalent, and doctorate or equivalent).
Figures 1–3 and Table 1 look at the distribution of the population aged 25–74 years according to their level of educational attainment. Figures 4–6 then focus on tertiary educational attainment for a narrower cohort, namely, people aged 25–34 years.
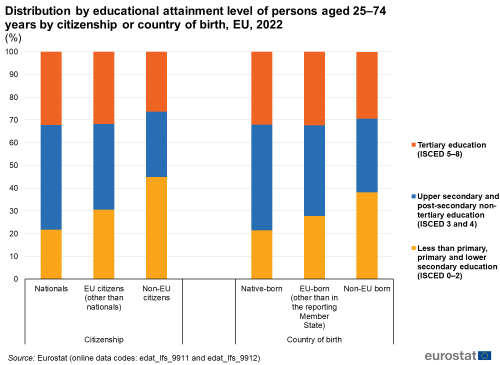
Among nationals aged 25–74 years living in the EU in 2022, almost one fifth (21.8 %) had completed at most lower secondary education, close to half (46.0 %) had a medium level of education (i.e. either upper secondary or post-secondary non-tertiary education) and close to one third (32.2 %) had a tertiary educational attainment – see Figure 1.
- By comparison, citizens of other EU Member States and non-EU citizens had higher shares of people with at most, lower secondary education (30.6 % for citizens of other EU Member States and 44.9 % of non-EU citizens).
- Equally, citizens of other EU Member States and non-EU citizens had smaller shares with a medium level of education (37.6 % for citizens of other EU Member States and 28.8 % of non-EU citizens).
- Concerning tertiary educational attainment, both the shares for citizens of other EU Member States (31.9 %) and for non-EU citizens (26.3 %) were lower than the share observed for nationals.
An analysis by country of birth rather than by citizenship provides a similar picture. In the EU in 2022, the structure of the population in terms of educational attainment differed between native-born persons and persons born in other EU Member States in terms of the shares with low or medium educational attainment. Comparing native-born persons and persons born in non-EU countries, the share with low educational attainment was notably higher among those born in non-EU countries, while the shares with medium or high educational attainment were higher for native-born persons.
(%)
Source: Eurostat (edat_lfs_9911) and (edat_lfs_9912)
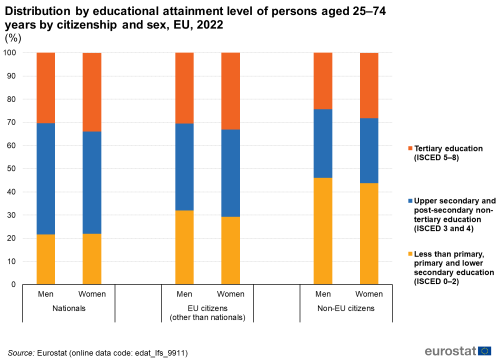
Comparing the distributions according to educational attainment for women and men aged 25–74 years in the EU, one common feature can be observed, regardless of citizenship: in 2022, a higher share of women had a tertiary educational attainment than men – see Figure 2. For non-EU citizens, this gender gap was 3.8 percentage points; for nationals, the gap was 3.5 percentage points and for citizens of other EU Member States it was 2.7 percentage points. By contrast, a lower share of women had a medium level of education than men, in case of nationals and non-EU-citizens; for EU citizens, the shares were identical. The gender gap in the shares of people having completed at most lower secondary education was relatively small for national citizens (a higher share for women), while it was somewhat higher for citizens of other EU Member States and for non-EU citizens, both with higher shares for men.
Comparing EU citizens and non-EU citizens with nationals, the integration gap in terms of educational attainment in the EU in 2022 was wider for men than for women. For example:
- for citizens of other EU Member States, the share with a low educational attainment was 10.3 percentage points higher than for nationals among men, whereas the gap was 7.4 percentage points among women;
- for non-EU citizens, the share with high educational attainment was 6.1 percentage points lower than for nationals among men, whereas the gap was 5.8 percentage points among women.
(%)
Source: Eurostat (edat_lfs_9911)
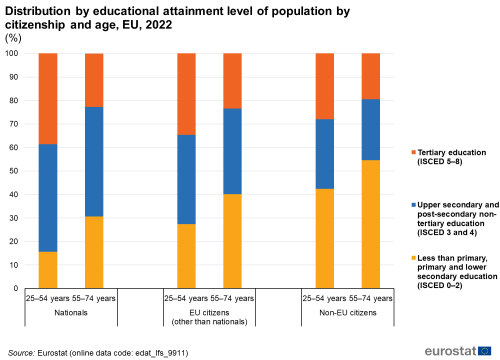
A similar analysis is presented in Figure 3, with two age groups rather than two sexes.
Again, the distributions according to educational attainment have common features for the younger (aged 25–54 years) and older (aged 55–74 years) age groups in 2022, regardless of citizenship: in the EU, a larger share of younger people had tertiary educational attainment than did older people. For nationals, this age gap was 15.9 percentage points (p.p.); for citizens of other EU Member States the gap was 11.3 p.p. and for non-EU citizens it was 8.5 p.p.. By contrast, a larger share of older people had completed at most lower secondary education than had younger people, regardless of citizenship. The age gap in the shares of people with upper secondary or post-secondary non-tertiary education was relatively small for all categories of citizenship: there was a slightly larger share for older (rather than younger) people among nationals and the reverse situation for citizens of other EU Member States and for non-EU citizens.
Comparing EU citizens and non-EU citizens with nationals, the integration gap in terms of educational attainment in the EU in 2022 was somewhat different for younger and older people.
- For low educational attainment, the gap was narrower for older rather than younger people, both for citizens of other EU Member States and for non-EU citizens.
- For medium educational attainment, the gap was wider for older rather than younger people, both for citizens of other EU Member States and for non-EU citizens.
- For high educational attainment, the gap was narrower for older rather than younger people, both for citizens of other EU Member States and for non-EU citizens. However, the integration gap for older citizens of other EU Member States was positive: the share of older citizens of other EU Member States with tertiary educational attainment (23.4 %) was higher than the equivalent share among nationals (22.7 %).
(%)
Source: Eurostat (edat_lfs_9911)
As noted above, nationals aged 25–74 years living in the EU in 2022 were generally:
- less likely than both categories of foreign citizens to have completed, at most, lower secondary education;
- more likely to have a medium level of educational attainment;
- slightly more likely to have tertiary educational attainment.
The average shares for the EU in 2022 reflect a wide range of situations among the EU Member States. In fact, Germany and France were the only ones (among the 16 countries for which a full set of reliable data is available in Table 1) with the same pattern of integration gaps.
Comparing the educational attainment distributions in 2022 for nationals and citizens of other EU Member States, Ireland and Malta had the opposite situation to that observed for the EU, as national citizens had higher shares of people with low educational attainment and a lower share with medium or high educational attainment.
Turning to a comparison of nationals and non-EU citizens, Malta also had the opposite situation to that observed for the EU: national citizens had higher shares of people with low educational attainment and lower shares with medium or high educational attainment.
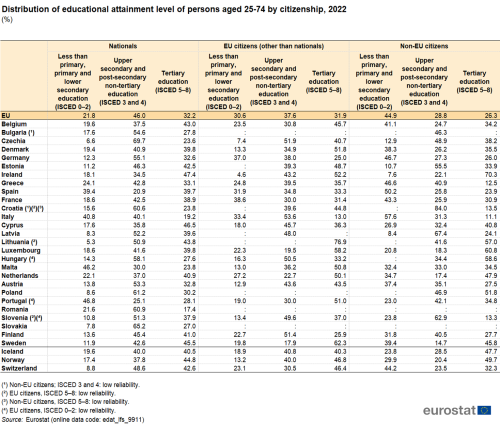
(%)
Source: Eurostat (edat_lfs_9911)
Having successfully completed tertiary education is becoming more important due to the increased demand for highly skilled individuals in the labour market within the European Union. Higher education plays an essential role in society by fostering innovation, increasing economic development and growth, and improving more generally the well-being of citizens.
The last three figures of this section (Figures 4–6) focus on the share of people with tertiary educational attainment, in other words having completed at least one level of tertiary education (ISCED levels 5, 6, 7 and 8). The age coverage is limited to the population aged 25–34 years.
In the EU, the tertiary educational attainment rate for foreign citizens aged 25–34 years was lower than for nationals in 2022 – see Figure 4. For citizens of other EU Member States, it was 4.3 percentage points lower, while for non-EU citizens the integration gap was wider at 9.6 percentage points. Compared with 2013, both of these gaps narrowed.
A similar analysis by country of birth presents the same picture for the EU:
- in 2022, the tertiary educational attainment rates for both categories of foreign-born persons aged 25–34 years were lower than for native-born persons;
- in 2022, the integration gap was wider for persons born in non-EU countries than for persons born in other EU Member States;
- the integration gaps for both categories of foreign-born persons were narrower in 2022 than in 2013.
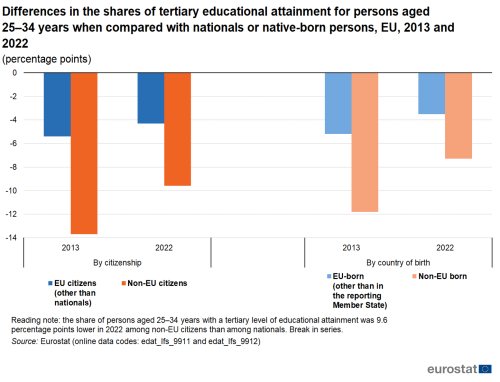
(percentage points)
Source: Eurostat (edat_lfs_9911) and (edat_lfs_9912)
The Resolution on a strategic framework for European cooperation in education and training towards the European Education Area and beyond (known as EEA 2030) set seven EU-level targets, including that the share of persons aged 25–34 years with tertiary educational attainment should be at least 45 %, by 2030. As can be seen from Figure 5, this share was already surpassed in 2022 for women who were nationals, for whom the share was 49.0 %. For their male counterparts, the share was 37.1 %, in other words 7.9 percentage points below the target.
- For all three categories of citizenship, the tertiary educational attainment shares were higher for women than for men.
- Both among men and women, the tertiary educational attainment share was highest for nationals and lowest for non-EU citizens.

(%)
Source: Eurostat (edat_lfs_9911)
In less than half (13 out of 27) of the EU Member States, the share of nationals aged 25–34 years with tertiary educational attainment in 2022 was already above the target for 2030 – see Figure 6. This share was largest in Cyprus (69.3 %) and smallest in Romania (24.7 %).
- Data for citizens of other Member States are available and reliable for 14 Member States, among which nine recorded shares above the target. The largest share was 69.3 % in Sweden, while the smallest was 14.7 % in Italy. In eight of these 14 Member States, the share of citizens of other Member States with tertiary educational attainment was higher than that for national citizens.
- Data for non-EU citizens are available and reliable for 21 Member States, among which eight recorded shares above the target. The largest share was 81.8 % in Ireland, while the smallest was 11.8 % in Greece. In five of these 21 Member States, the share of non-EU citizens with tertiary educational attainment was higher than that for national citizens.
In Czechia and Luxembourg, the share of people aged 25–34 years with tertiary educational attainment in 2022 was lower for nationals than for both categories of foreign citizens.
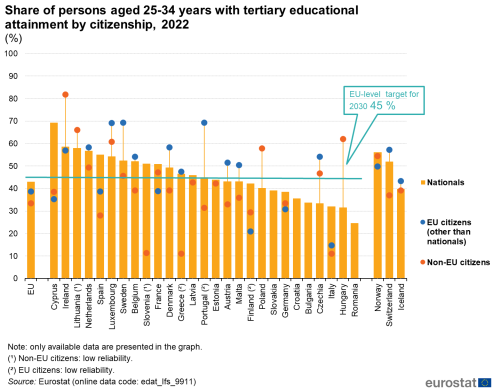
(%)
Source: Eurostat (edat_lfs_9911)
Early leavers from education and training
This section focuses on the share of early leavers from education and training; this indicator is calculated for persons aged 18–24 years. A person in this age group is considered to be an early leaver if their highest level of educational attainment is at most lower secondary education and they have not received any formal nor non-formal education or training in the four weeks preceding the survey.
It is important to follow the developments of this group, as early leavers from education and training can face challenges when trying to get established in the labour market. Education has become an increasingly important factor when employers are hiring employees. Leaving education early can also have significant consequences for the individual, as well as for society, in the long term.
In the EU, the share of early leavers from education and training for foreign citizens aged 18–24 years was higher than for nationals in 2022 – see Figure 7. For citizens of other EU Member States, it was 13.1 percentage points higher, while for non-EU citizens the integration gap was wider at 17.8 percentage points. Compared with 2013, the integration gap narrowed both for citizens of other Member States and for non-EU citizens.
A similar analysis by country of birth presents a similar picture (to the analysis by citizenship) for the EU:
- In 2022, the shares of early leavers from education and training for both categories of foreign-born persons aged 18–24 years were also higher than for native-born persons;
- In 2022, the integration gap was also slightly wider for persons born in non-EU countries than for persons born in other EU Member States;
- The integration gap was narrower in 2022 than in 2013 for both categories of foreign-born persons.
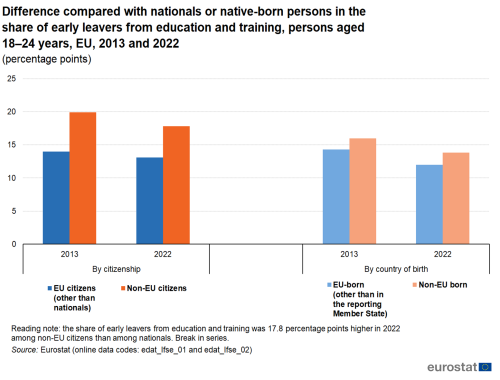
(percentage points)
Source: Eurostat (edat_lfse_01) and (edat_lfse_02)
Among the seven targets set by the EEA 2030, one demands that the share of early leavers from education and training in the EU should be less than 9 %, by 2030. As can be seen from Figure 8, the share of early leavers among young women who were nationals (6.9 %) was, in 2022, already below this target. For their male counterparts, the share was 9.7 %, in other words 0.7 percentage points above the target.
- For all three categories of citizenship, the shares of early leavers from education and training were lower for young women than for young men.
- Both among young men and among young women, the share of early leavers from education and training was notably lower for nationals than for the two categories of foreign citizens. For both sexes, the highest shares were for non-EU citizens.
(%)
Source: Eurostat (edat_lfse_01)
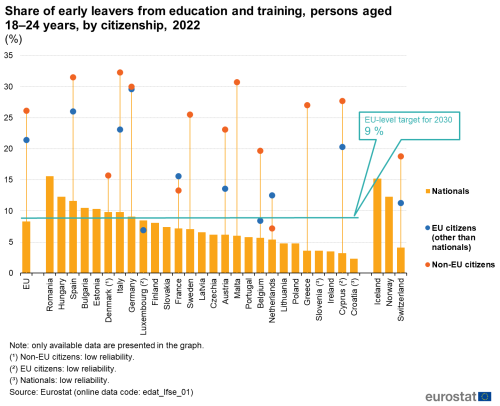
In 17 of the EU Member States (out of 25 with reliable data), the share of nationals aged 18–24 years who were early leavers from education and training was, in 2022, below 9.0 % – see Figure 9. This share was smallest in Cyprus (3.2 %) and largest in Romania (15.6 %).
- Data for citizens of other Member States are available and reliable for seven Member States, among which only Belgium recorded the share below the target (8.4 %). The largest share was 29.6 % in Germany. In all seven of these Member States, the share of citizens of other Member States who were early leavers from education and training was higher than that for nationals; the narrowest integration gap was 2.7 percentage points in Belgium.
- Data for non-EU citizens are available and reliable for 11 Member States, among which only the Netherlands recorded shares below the target (7.2 %). The largest share 32.3 % in Italy. In all 11 of these Member States, the share of non-EU citizens who were early leavers from education and training was higher than that for nationals; the narrowest integration gap was 1.8 percentage points in the Netherlands.
(%)
Source: Eurostat (edat_lfse_01)
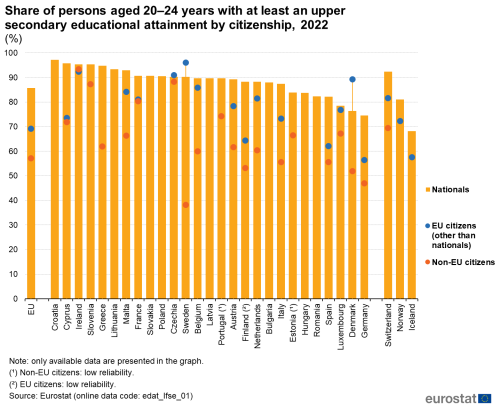
One of the criteria for someone to be classified as an early leaver from education and training is if their highest level of education or training was at most lower secondary education. Figure 10 complements Figures 7–9 by showing the share of the population aged 20-24 with at least upper secondary educational attainment – regardless of whether or not they recently received education or training. This indicator complements the one on early leavers from education and training.
The skills and competences gained in upper secondary education are increasingly seen as the minimum credentials for a successful labour market entry as well as the basis for further learning and a fulfilling life.
In 2022, the share of people aged 20–24 years in the EU who had completed at least upper secondary education was 85.7 % for nationals. The share was 16.5 percentage points lower for citizens of other EU Member States (69.2 %) and 28.6 percentage points lower for non-EU citizens (57.1 %).
- Among the EU Member States, the highest shares for nationals were in Croatia, Cyprus, Ireland and Slovenia, all above 95.0 %. The lowest share was in Germany, 74.5 %.
- Data for citizens of other Member States are available and reliable for 14 Member States, among which the smallest share was 56.4 % in Germany and the largest was 96.0 % in Sweden. In 11 of these 14 Member States, the share of citizens of other Member States who had completed at least upper secondary education was lower than that for national citizens; the exceptions were Denmark, Czechia and Sweden.
- Data for non-EU citizens are available and reliable for 17 Member States, among which the smallest share was 38.2 % in Sweden and the largest was 92.3 % in Ireland. In all of these 17 Member States, the share of non-EU citizens who had completed at least upper secondary education was lower than that for nationals.
(%)
Source: Eurostat (edat_lfs_9911)
Participation in adult learning in the previous four weeks
The share of people having participated in learning is calculated for persons aged 25–64 years. It is the share of people who participated in formal or non-formal education and training during the four weeks preceding the survey.
Adult learning is an important aspect when it comes to the digitalization and automation in the labour market. Employees need to adapt and for example learn new digital skills and in some cases reskill since some jobs will be eliminated due to technical development. Adult learning should improve employability, boost innovation, ensure social fairness and close the digital skills gap. One of the seven EU-level targets set by the EEA 2030 was that by 2025, at least 47 % of adults aged 25–64 years should have participated in learning during the previous 12 months. Note that the period of time in which such learning should have taken place is the previous 12 months; the indicator presented here refers to participation in learning in the previous four weeks, as data on participation in the previous 12 months are not yet available by citizenship or country of birth.
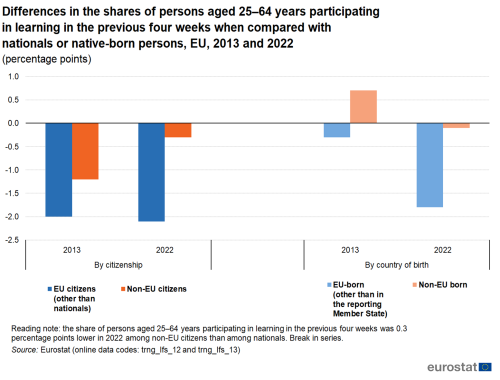
In the EU, the share of people aged 25–64 years having participated in learning during the previous four weeks was lower for citizens of other EU Member States than for nationals in 2022 (see Figure 11), representing an integration gap of 2.1 percentage points. For non-EU citizens, the share having participated in learning during the previous four weeks was also lower, however, only 0.3 percentage points below the share for nationals. Compared with 2013, the integration gap for citizens of other Member States slightly widened, while for non-EU citizens the gap significantly narrowed.
A similar analysis by country of birth presents the same picture for the EU in 2022:
- the share of people aged 25–64 years having participated in learning during the previous four weeks was lower both for persons born in other EU Member States and for persons born in non-EU countries than for native-born persons;
- the integration gap was wider for persons born in other EU Member States than the gap for persons born in non-EU countries.
However, when analysed by country of birth the comparison of EU data for 2013 and 2022 is different from the analysis by citizenship. Non-EU born persons recorded a positive integration gap in 2013, as their share of people aged 25–64 years having participated in learning during the previous four weeks was higher than the equivalent share among native-born persons. By 2022, this had turned into a negative gap, as noted above.
(percentage points)
Source: Eurostat (trng_lfs_12) and (trng_lfs_13)
As can be seen from Figure 12, participation in learning during the previous four weeks was most common in the EU in 2022 among nationals and least common among citizens of other EU Member States. Equally, this share was higher for women than for men, for all categories of citizenship. The highest share was 13.0 % among female nationals while the lowest was among male citizens of other Member States (8.7 %).
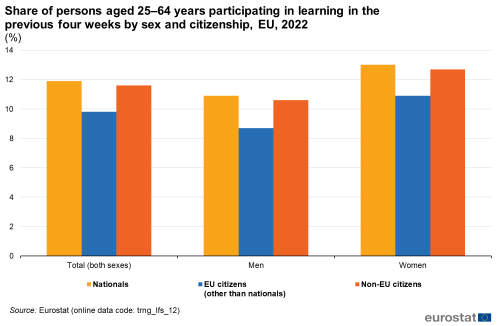
(%)
Source: Eurostat (trng_lfs_12)
In 2022, among the 26 EU Member States with reliable data, more than a quarter of nationals aged 25–64 years in Sweden, Denmark and the Netherlands had participated in learning during the previous four weeks – see Figure 13. This share was smallest in Bulgaria (1.7 %).
- Data for citizens of other EU Member States are available and reliable for 14 Member States, among which the same three – Sweden, Denmark and the Netherlands – again recorded shares above a quarter. The smallest shares were 3.4 % in Italy and 5.1 % in Germany. In half of these 14 Member States, the share of citizens of other Member States having participated in adult learning during the previous four weeks was higher than that for nationals; the largest positive integration gap was 4.5 percentage points in the Netherlands. In the remaining seven Member States, the share was lower for citizens of other Member States than for national citizens, with the largest negative gap observed in Spain and Italy (both 6.9 percentage points).
- Data for non-EU citizens are available and reliable for 19 Member States, among which Sweden, Finland, the Netherlands and Denmark recorded shares above a quarter. The smallest shares were in Italy (3.9 %) and Latvia (4.9 %). Nine out of these 19 Member States reported a higher share of non-EU citizens having participated in learning during the previous four weeks than that for nationals; the largest positive gaps were in Finland (14.3 percentage points) and the Netherlands (12.5 percentage points). In the remaining ten Member States, the share was lower for non-EU citizens than for national citizens, with the largest gap in Estonia (10.3 percentage points).
In 2022, the share of people aged 25–64 years having participated in learning during the previous four weeks was lower for nationals than for both categories of foreign citizens in Belgium, Ireland, Finland and the Netherlands. The reverse situation – a higher share for national citizens than for both categories of foreign citizens – was observed in Italy, Cyprus, Spain and France.
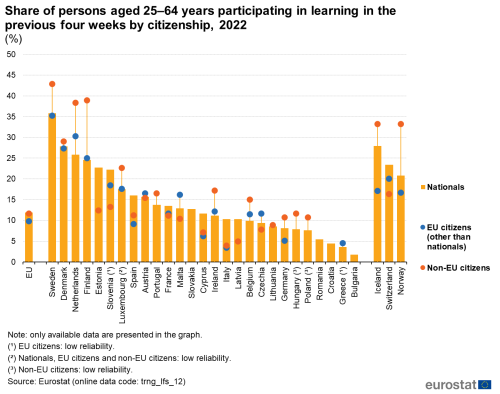
(%)
Source: Eurostat (trng_lfs_12)
Source data for tables and graphs
Data sources
The data presented in this article are from the labour force survey (LFS) and the the largest household sample survey in the EU. The survey covers the resident population, defined as all people usually residing in private households. As such, persons living in collective households are excluded from the target population. Usual residence means the place where a person normally spends the daily period of rest, regardless of temporary absences for purposes of recreation, holidays, visits to friends and relatives, business, medical treatment or religious pilgrimage. The data for the EU are aggregated results for the 27 EU Member States. For more information on the data sources used, please consult the online publication EU labour force survey.
Due to the sampling nature of the survey, some data have low reliability or are not published due to very low reliability or confidentiality. Data that are of low reliability are duly marked in the footnotes below the figures and tables.
Main concepts
Educational attainment refers to the highest level of education successfully completed. Educational levels are defined and classified in the international standard classification of education (ISCED). The levels of education used in this article are based on ISCED 2011. A low level of educational attainment refers to ISCED levels 0–2 (less than primary, primary and lower secondary education), a medium level refers to ISCED levels 3 and 4 (upper secondary and post-secondary non-tertiary education) and a high level refers to ISCED levels 5–8 (tertiary education).
For the calculation of the tertiary educational attainment rate, the numerator refers to persons aged 25–34 years with tertiary educational attainment (ISCED level 5-8). The denominator is the total population of the same age group, excluding respondents who did not answer the question ‘highest level of education or training successfully completed’.
For the calculation of the share of early leavers from education and training, the numerator refers to persons aged 18–24 years who met both of the following two conditions: (a) the highest level of education or training they had completed was ISCED 2011 levels 0, 1 or 2 (in other words, at most, lower secondary education) and (b) they had not received any education or training (neither formal nor non-formal) in the four weeks preceding the survey. The denominator is the total population of the same age group, excluding respondents who did not answer the questions ‘highest level of education or training successfully completed’ and ‘participation in education and training’.
Data for participation in (formal and non-formal) education and training during the four weeks preceding the are used to calculate the share of people aged 25–64 years participating in learning in the previous four weeks. The denominator used for the ratio is the total population (of the same age group), excluding people who did not answer the question concerning participation in (formal and non-formal) education and training. The indicator covers formal and non-formal education and training but excludes informal learning. The fundamental criterion to distinguish learning activities from non-learning activities is that the activity must be intentional (not by chance – ‘random learning’), in other words, a deliberate search for knowledge, skills, competences or attitudes.
- Formal education and training is defined as ‘education that is institutionalised, intentional and planned through public organisations and recognised private bodies and – in their totality – constitute the formal education system of a country’.
- Non-formal education and training is defined as any organised and sustained learning activities outside the formal education system. This can be further distinguished as:
- non-formal programmes;
- courses (which are further distinguished into classroom instruction, private lessons and combined theoretical-practical courses including workshops);
- guided-on-the-job training (it should be noted that labour force survey data on non-formal education and training do not cover guided-on-the-job training).
- Non-formal education therefore takes place both within and outside educational institutions and may cater for people of all ages. It covers educational programmes and training to impart literacy, life skills, work skills, and general culture.
- Informal learning is less organised and less structured. It is defined as forms of learning that are intentional or deliberate but are not institutionalised. It may include learning events that occur in the family, in the workplace, and in the daily life of every person, for example, coaching/informal tuition, guided visits, self-learning, learning groups or practice. Labour force survey data do not cover informal learning.
Context
In November 2020, an Action Plan on Integration and Inclusion 2021–2027 (COM(2016) 377 final) was adopted with the purpose of fostering social cohesion and building inclusive societies for all. Inclusion for all is about ensuring that all policies are accessible to and work for everyone, including migrants and EU citizens with migrant background. This plan includes actions in four sectoral areas (education and training, employment and skills, health and housing) as well as actions supporting effective integration and inclusion in all sectoral areas at the EU, Member State and regional level, with a specific attention paid to young people.
More information on the policies and legislation in force in this area can be found in an introductory article on migrant integration statistics.
The Resolution on a strategic framework for European cooperation in education and training towards the European Education Area and beyond (known as EEA 2030) was agreed by the Council in February 2021. It outlines five strategic priorities for the period 2021–2030: improving quality, equity, inclusion and success for all in education and training; making lifelong learning and mobility a reality for all; enhancing competences and motivation in the education profession; reinforcing European higher education; and supporting the green and digital transitions in and through education and training. For monitoring progress, seven EU-level targets were defined, including that
- the share of persons aged 25–34 years with tertiary educational attainment should be at least 45 %, by 2030;
- the share of early leavers from education and training should be less than 9 %, by 2030;
- at least 47 % of adults aged 25–64 years should have participated in learning during the previous 12 months, by 2025.
2023 was announced as the European Year of Skills that aims to promote a mindset of reskilling and upskilling, helping people to get the right skills for relevant quality jobs.
Direct access to
Online publications
- Education and training in the EU – facts and figures
- Foreign-born people and their descendants
- Migrant integration statistics
Methodology
- Education (mii_educ)
- Distribution of the population by educational attainment level (mii_edata)
- Early leavers from education and training (mii_edatt1)
- Participation in lifelong learning of population aged 18+ (mii_trng)
- EU labour force survey
- LFS series – Detailed annual survey results (ESMS metadata file – lfsa_esms)
- Migrant integration statistics – methodology
- Action Plan on Integration and Inclusion 2021–2027
- European Commission – Directorate-General for Migration and Home Affairs (DG HOME), see:
- European Commission – Education and training policies
- European Migration Network (EMN)
- European Website on Integration
- OECD – Migration, see:
- UNESCO – Education transforms lives
- UNESCO Institute for Lifelong Learning