Labour cost index - recent trends
Data extracted on 10 March 2024
Planned article update: June 2024.
Highlights
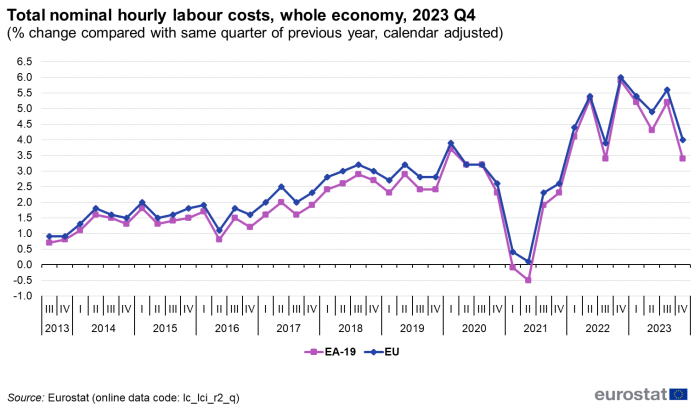
Total nominal hourly labour costs, whole economy, 2023 Q4 (% change compared to same quarter of previous year, calendar adjusted)
The labour cost index (LCI) shows the short-term development of the labour cost, the total cost on an hourly basis of employing labour. In other words, the LCI measures the cost pressure arising from the production factor "labour". This article takes a look at the most recent evolutions of the LCI, both at the level of the European Union (EU) and the Member States.
In addition, Eurostat estimates of the annual labour cost per hour in euros are provided for EU Member States as well as the whole EU. These were obtained by combining the four-yearly Labour cost survey (LCS) with the quarterly labour cost index. Since the release in April 2013, these figures have been moved to a separate article on hourly labour costs.
Full article
Overview
Eurostat publishes labour cost index data broken down by economic activities defined in sections B to S of the Statistical classification of economic activities in the European Communities (NACE Rev 2). The aggregate B to S is referred to as the "whole economy" for the sake of simplification. For the EU and EA aggregates, these series are available from 2008 onwards.
EU and euro area
In the fourth quarter of 2023 the hourly labour costs rose by 3.4 % in the euro area and by 4.0 % in the EU, compared with the same quarter of the previous year.

Source: Eurostat (lc_lci_r2_q)
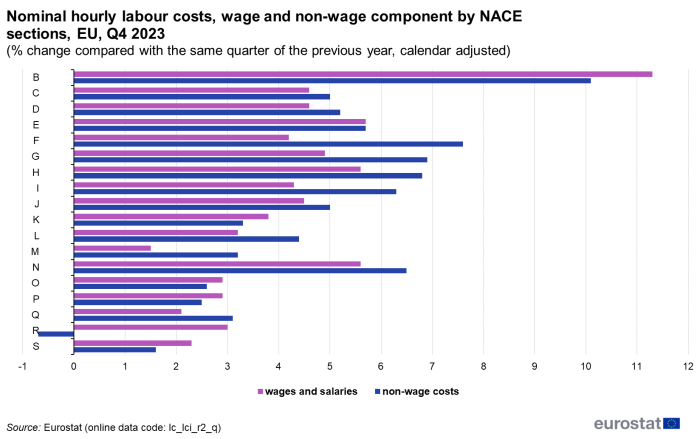
The two main components of labour costs are wages & salaries and non-wage costs. In the euro area, wages & salaries per hour worked increased by 3.1 %, while the non-wage component rose by 4.2 % in the fourth quarter of 2023, compared with the same quarter of the previous year. In the EU, hourly wages & salaries increased by 3.8 % and the non-wage component by 4.6 % in the fourth quarter of 2023.
Breakdown by economic activity
In the fourth quarter of 2023 compared with the same quarter of the previous year, hourly labour costs in the euro area rose by 1.8 % in the (mainly) non-business economy and by 4.2 % in the business economy: +4.2 % in industry, +4.4 % in construction and +4.1 % in services. In the EU, hourly labour cost grew by 2.6 % in the (mainly) non-business economy and by 4.7 % in the business economy: +4.9 % in industry, +5.0 % in construction and +4.6 % in services.
Wage costs
In the EU, the economic activity that recorded the highest annual increase in hourly wage costs in the fourth quarter of 2023 compared with the same quarter of the previous year is NACE Rev. 2 section B – 'Mining and quarrying' (+11.3 %). The lowest annual increases were recorded in NACE Rev. 2 sections M – 'Professional, scientific and technical activities' (+1.6 %) and Q - 'Human health and social work activities' (+2.1 %).
Non-wage costs
The only economic activity that recorded a decrease in the non-wage component was NACE Rev. 2 section R - 'Arts, entertainment and recreation' (-0.6 %).

Source: Eurostat (lc_lci_r2_q)
For full details of NACE Rev. 2 sections see here
Hourly wage costs across countries
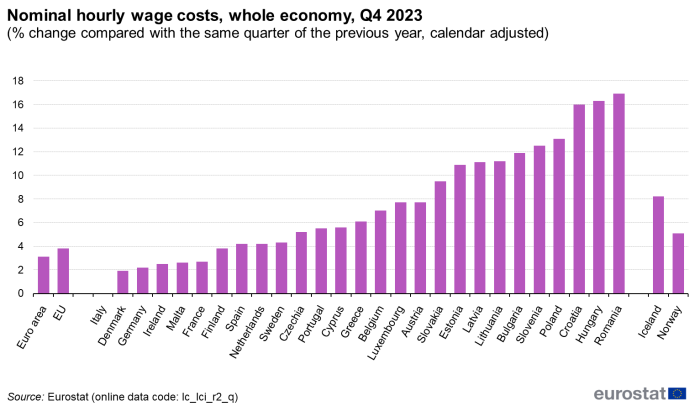
In the fourth quarter of 2023 compared with the same quarter of the previous year, the highest increases in hourly wage costs for the whole economy were recorded in Romania (+16.9 %), Hungary (+16.3 %), Croatia (+16.0 %), Poland (+13.1 %) and Slovenia (+12.5 %). Four more EU Member States recorded an increase above 10 %, namely: Bulgaria (+11.9 %), Lithuania (+11.2 %), Latvia (+11.1 %) and Estonia (+10.9 %).

Source: Eurostat (lc_lci_r2_q)
For full details of NACE Rev. 2 sections see here
Hourly labour costs in euro
Since the release in April 2013, these figures have been moved to a separate article on hourly labour costs.
Data sources
Labour cost index
The labour cost index is defined as the Laspeyres index of labour costs per hour worked, chain-linked annually and based upon a fixed structure of economic activity at NACE Rev.2 section level. The current reference year of the index is 2020. In addition to the index numbers, annual and quarterly growth rates of labour cost are also calculated.
EU Member States produce the necessary estimates by using surveys, other appropriate sources such as administrative data and statistical estimation procedures.
Also, different estimation methods are used, for example, for estimations of separate growth rates for labour costs and hours worked, or the application of growth rates of some labour cost components to all labour cost components.
Since annual or even 4-yearly benchmark surveys, as well as estimation methods, play an important role in the production of quarterly LCI figures in most EU Member States, revisions are frequent and can go back several years.
EU aggregates are obtained as weighted aggregates of the national data. The weights reflect the share of labour costs that each Member State has in the total EU aggregate. While the LCI itself is compiled in national currency and thus not influenced by exchange rate movements, the share of the Member State for the EU aggregates is measured in euro and can therefore vary according to the value of the national currency against the euro. In practice, these variations are however very small and have no influence on the comparability of the LCI series over time.
Eurostat has labour cost index data available for all EU Member States, the euro area and the EU on a quarterly basis from the year 2000 onwards. Up to 31 December 2022, the euro area (EA19) included Belgium, Germany, Estonia, Ireland, Greece, Spain, France, Italy, Cyprus, Latvia, Lithuania, Luxembourg, Malta, the Netherlands, Austria, Portugal, Slovenia, Slovakia and Finland. From 1 January 2023 the euro area (EA20) also includes Croatia. The aggregate data series commented on in this release refers to EA20. The European Union includes Belgium, Bulgaria, Czechia, Denmark, Germany, Estonia, Ireland, Greece, Spain, France, Croatia, Italy, Cyprus, Latvia, Lithuania, Luxembourg, Hungary, Malta, the Netherlands, Austria, Poland, Portugal, Romania, Slovenia, Slovakia, Finland and Sweden.
Data are broken down by cost items (Total cost, Wages and salaries, Other labour costs) and by economic activity (NACE Rev. 2 sections). Index numbers and growth rates are made available by economic activity, for the total cost index as well as for the two main coponents: wages and salaries and non-wage labour cost.
In the news release, the following NACE aggregations are published:
- The whole economy (NACE Rev. 2 sections B to S, i.e. excluding agriculture, forestry and fishing, as well as activities of households as employers and activities of extraterritorial organisations and bodies). This is broken down into:
- The business economy (NACE Rev. 2 sections B to N); for the EU/EA aggregates this accounts for about 70 % of the labour costs of the whole economy and is further broken down into:
- Industry (NACE Rev. 2 sections B to E): B - 'Mining and quarrying', C - 'Manufacturing', D - 'Electricity, gas, steam and air conditioning supply', E - 'Water supply; sewerage, waste management and remediation activities'.
- Construction (NACE Rev. 2 section F).
- Services (NACE Rev. 2 sections G to N): section G - 'Wholesale and retail trade, repair of motor vehicles and motorcycles', H - 'Transportation and storage', I - 'Accommodation and food service activities', J - 'Information and communication', K - 'Financial and insurance activities', L - 'Real estate activities', M - 'Professional, scientific and technical activities' and N - 'Administrative and support service activities'.
- The mainly non-business economy (NACE Rev. 2 sections O to S); for the EU/EA aggregates this accounts for about 30 % of the labour costs of the whole economy. It contains sections O - 'Public administration and defence; compulsory social security', P - 'Education', Q - 'Human health and social work activities', R - 'Arts, entertainment and recreation' and S - 'Other service activities'.
- The business economy (NACE Rev. 2 sections B to N); for the EU/EA aggregates this accounts for about 70 % of the labour costs of the whole economy and is further broken down into:
In the database, all series are available in calendar adjusted form; this means that differences in hourly labour cost which arise due to a varying number of working days are corrected for. Also, all series are available on a seasonally adjusted basis. Seasonal adjustment corrects for infra-annual variations in the labour cost index which can arise due to recurring events, such as new school and university graduates entering the labour market in the autumn. Seasonally adjusted data may be commented quarter-on-quarter whereas calendar adjusted figures should be analysed year-on-year due to possible seasonal effects.
New data are released every quarter, about 75 days after the end of the reference quarter.
Recording of COVID-19 support schemes: in the first half of 2020, the governments of EU countries introduced the main schemes to alleviate the impact of the COVID-19 pandemic on enterprises and employees that consisted in short-term work arrangements and temporary lay-offs. In most cases, schemes were recorded as subsidies (or tax allowances) with a negative sign in the non-wage component of the labour cost index. This means that a decrease in subsidies, in particular following the phasing out of COVID-19 support schemes, translates on the opposite into an increase in the non-wage component of labour costs. This phasing out is, in general, visible in the first half of 2022. Detailed guidance on the recording of government schemes related to the COVID-19 crisis in labour cost statistics can be found here.
Country notes
In the case of Ireland, the annual growth of hourly wages was impacted downwards by the phasing out of the Employment Wage Subsidy Scheme (EWSS) introduced by the government in March 2020 to support wages during the COVID-19 pandemic. It enabled employees, whose employers' business activities were adversely affected by the pandemic, to receive support directly from their employers through the payroll system.
In the case of Germany, data have been revised due to benchmarking on the Labour Cost Survey 2020 (see national publication). In addition, wage data for the four quarters of 2022 are impacted by a change in data sources (see further explanation, in German). Due to this change in data sources, data for Germany show a break in series for the total economy, business economy and construction, starting from the first quarter of 2022.
Context
The labour cost index is an essential part of the range of statistics that are relevant for an understanding of the inflationary process and the cost dynamics in the economy.
Information on labour costs is required for economic and monetary policies, wage bargaining and economic analyses. Labour costs are an important potential source of inflation since they account for a large proportion of the total costs borne by private businesses, which may pass higher labour costs, in particular if not reflected in higher productivity, on to consumers via higher end prices, thus fuelling inflation. Symmetrically, low or negative growth in the hourly labour costs may signal deflation risks. A timely labour cost index is therefore important for the institutions in charge of monetary policy, in particular the European Central Bank (ECB).
Direct access to
- News releases
- Labour market statistics - 2011 edition
- Principal European Economic Indicators - A statistical guide - 2009 edition
- Labour market, see:
- Labour costs (t_lc)
- Labour cost index (teilm100)
- Labour costs (t_lc)
- Labour market, see:
- Labour costs (lc)
- Labour cost index (lci)
- Labour cost index - Quarterly data (Nace R2) (lc_lci_r2_q)
- Labour cost index - Annual data (Nace R2) (lc_lci_r2_a)
- Labour cost index - Country weights - NACE rev.2 (lc_lci_r2_cow)
- Labour cost index - Item weights - NACE rev.2 (lc_lci_r2_itw)
- Labour cost levels (lc_lci_lev)
- Historical data - NACE rev. 1.1 (lci_hist)
- Labour cost index - Quarterly data (lc_lci_r1_q)
- Labour cost index - Annual data (lc_lci_r1_a)
- Labour cost index - Country weights (lc_lci_r1_cow)
- Labour cost index - Item weights (lc_lci_r1_itw)
- Historical data - NACE rev. 1.1 (lci_hist)
- Labour costs (lc)
- Labour cost index (ESMS metadata file — lci_esms)
- Regulation (EC) No 450/2003 of 27 February 2003 concerning the labour cost index
- Summaries of EU Legislation: Comparable EU-wide labour cost statistics
- Regulation (EC) No 1216/2003 of 7 July 2003 implementing Regulation (EC) No 450/2003 concerning the labour cost index
- Corrigendum to Regulation (EC) No 1216/2003 of 7 July 2003
- Regulation (EC) No 224/2007 of 1 March 2007 amending Regulation (EC) No 1216/2003 as regards the economic activities covered by the labour cost index
- Revision File containing information on revisions of the EU-27 and EA-19 aggregates
- Employment Cost Index (U.S. Bureau of Labour) - An alternative measure of changes in labour costs