International trade in goods for the EU - an overview
Data extracted in June 2022
Planned article update: August 2024
Highlights
The value of intra-EU trade in goods was 1.5 times as high as the value of extra-EU trade in goods in 2022.
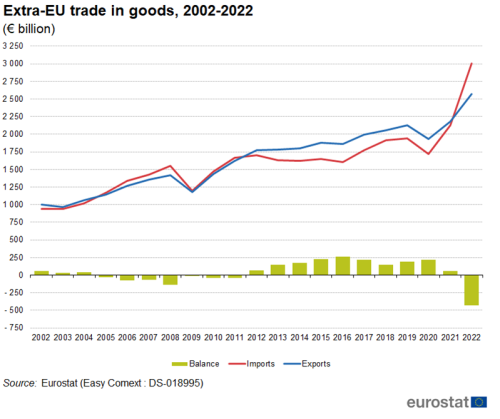
Extra-EU trade recovered strongly in 2021 and 2022, after the decline in 2020 due to the COVID-19 pandemic.
Globalisation patterns in EU trade and investment: Extra-EU trade in goods, 2002-2022
Globalisation patterns in EU trade and investment is an online Eurostat publication presenting a summary of recent European Union (EU) statistics on economic aspects of globalisation, focusing on patterns of EU trade and investment.
The EU has a relatively open trade regime, which has provided a stimulus for developing relationships with a wide range of trading partners. Indeed, the EU is deeply integrated into global markets and this pattern may be expected to continue, as modern transport and communication developments provide a further stimulus for producers to exchange goods (and services) around the world.
This article provides an overview of trade developments across the EU, detailing patterns of growth (in value and volume terms), the split between intra-EU trade and extra-EU trade, the performance of individual EU Member States, and developments for the terms of trade.
Statistics on international trade in goods
Statistics on international trade in goods distinguish between intra-EU and extra-EU trade.
Intra-EU statistics concern transactions that occur within the EU, in other words, exports of goods leaving one EU Member State that are destined to arrive in another. The advent of the single market on 1 January 1993 and the removal of customs formalities between EU Member States resulted in a loss of information and required the establishment of a new data collection system — Intrastat — which is closely linked to VAT systems and is based on collecting data directly from taxable persons (traders).
Extra-EU statistics record flows of goods exported and imported between the EU and non-member countries; note that goods ‘in transit’ through an EU Member State are excluded. Extra-EU trade statistics are collected through a different system — Extrastat — which uses records of trade transactions for customs declarations that are gathered by customs authorities.
The trade balance is the difference between exports and imports. When exports are higher than imports, the balance is positive and this is called a trade surplus. In contrast, if exports are lower than imports, the balance is negative and this is called a trade deficit.
Full article
International trade in goods - an overview
EU policymakers see the promotion of international trade (and investment) with the rest of the world as a key driver of economic growth and job creation. The EU is one of the world’s biggest players in global trade: in 2021, it was the second largest exporter and importer of goods in the world, as extra-EU trade accounted for 13.7 % of global exports and 15.2 % of global imports. China exported more goods (18.1 % of the world total) than the EU, while the United States imported more goods (16.3 % of the world total) — see article on World trade in goods and this table for more details. The EU has achieved this position, at least in part, by acting in a united way with a single voice, rather than having 27 national trade strategies: the EU Member States share a single market, a single external border and a single external trade policy within the World Trade Organisation (WTO), where the rules of international trade are agreed and enforced.
Since 2008 the value of goods exported outside the EU has risen at a faster pace than the value of goods imported into the EU
EU international trade in goods reached a relative peak in 2008 (see Figure 1), when imports were valued at €1 555 billion and the value of exports was somewhat lower, €1 421 billion; as such the EU had a trade deficit of €134 billion. The impact of the global financial and economic crisis resulted in a rapid decline in the EU’s international trade in goods; the value of extra-EU exports fell by 16.7 % in 2009, while there was an even greater reduction (-23.2 %) in the value of extra-EU imports. However, there was a swift recovery in trade activity, as EU exports had already risen above their pre-crisis value in 2010, while the same pattern was observed for EU imports by 2011; both EU imports and exports continued to grow in 2012.
The downturn in the value of EU imports starting in 2012 may be linked to the fall in the price of oil
Thereafter, somewhat different patterns of development were observed for EU exports and imports — reflecting, at least in part, the development of oil prices. Between 2012 and 2016 the value of extra-EU imports fell, while the value of EU exports continued to grow. After 2016, imports also started to grow again, reaching a peak of €1 941 billion in 2019. In that same year exports peaked at €2 132. In 2020, due in large part to the COVID-19 pandemic both imports (- 11.5 %) and exports (- 9.3 %) fell sharply. However, in the last two years they more than recovered, with exports reaching €2 573 billion and imports reaching €3 002 billion.
Since 2008, the value of EU exports of goods has generally expanded at a faster pace than the value of EU imports; this has led to a significant change in the EU’s trade balance for goods (the difference between exports and imports). The EU had a trade deficit for goods of €134 billion in 2008, although this was reversed by 2012 when a surplus of €68 billion was recorded. The surplus peaked in 2016 at €264 billion, dropped to €191 billion in 2019 before increasing to €218 billion in 2020. In 2021, due to large growth in imports the surplus decreased to €55 billion. Due to sharply increasing energy price the trade surplus turned into a trade deficit of €430 billion in 2022.
Variations by Member State
During the period 2002-2022, some of the fastest growth rates for trade in goods were recorded among those Member States that joined the EU in 2004 or more recently
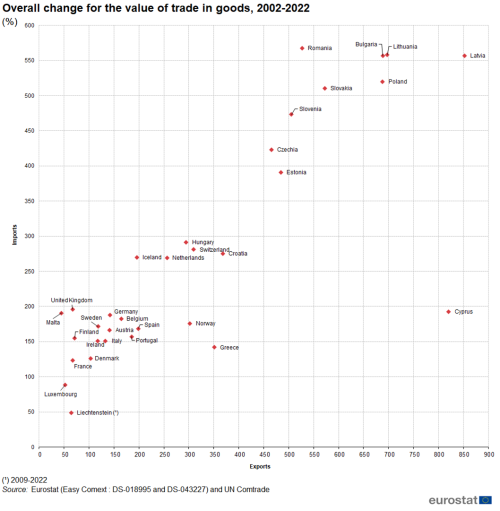
Looking at developments within the individual EU Member States, Figure 2 shows the overall rate of change in the value of imports and exports between 2002 and 2022; note that these statistics relate to total trade flows (in other words, both intra-EU and extra-EU trade). It is interesting to note that those Member States with the highest overall growth in total trade (the sum of imports and exports) tended to be characterised by higher rates of export growth (when compared with import growth rates), while those Member States with relatively low overall growth in total trade tended to report higher rates of import growth.
Growth rates of more than 200 % in total trade between 2002 and 2022 were recorded in twelve of the thirteen Member States that joined the EU in 2004 or more recently (Latvia, Lithuania, Bulgaria, Poland, Romania, Slovakia, Slovenia, Czechia, Estonia, Croatia, Hungary and Cyprus) which may, at least in part, be explained by their process of integration into both global markets and (in particular) the European single market, following reforms which led to switching from centrally-planned to market-based economic models. In the Netherlands the growth rate was also larger than 200 %. There were twelve Member States (Greece, Spain, Belgium, Portugal, Germany, Austria, Sweden, Italy, Ireland, Malta, Denmark and Finland) that recorded growth rates between 100 % and 200 %. In France and Luxembourg growth rates were below 100 %.
Latviva recorded the highest overall growth in its value of exported goods between 2002 and 2022 (an increase of 852 %), while Cyprus, Lithuania, Bulgaria and Poland also recorded increases of more than 600 %. By contrast, growth rates for exports were below 100 % in Malta, Luxembourg, France and Finland.
Romania (568 %) recorded the highest growth rates for imported goods, during the same period. Lithuania, Latvia, Bulgaria, Poland, and Slovakia also recorded growth rates above 500 %. By contrast, growth rates for imports below 150 % were registered in Greece, Denmark, France and Luxembourg.
(%)
Source: Eurostat (ext_lt_intratrd) and (ext_lt_intercc)
Germany had the highest trade surplus for goods in 2022
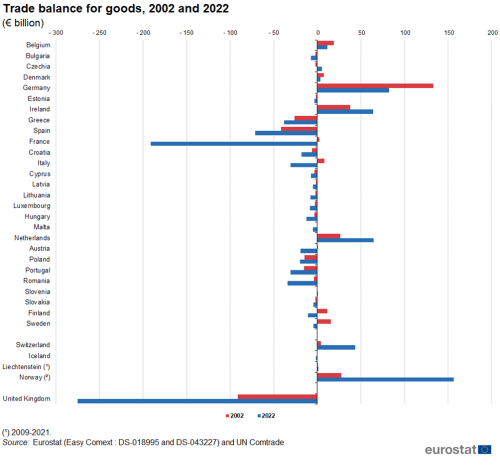
Figure 3 presents a comparison between 2002 and 2022 for the trade balance for goods. In 2022, Germany had the highest trade surplus in goods (€82 billion). This was followed at some distance by the surpluses recorded in the Netherlands (€65 billion) and Ireland (€65 billion). At the other end of the range, the trade deficit for trade in goods in France amounted to €191 billion in 2022, which was much higher than the next largest deficit, recorded in Spain (€71 billion).
Between 2002 and 2022, two EU Member States — Czechia and Slovakia — moved from the position of having a trade deficit for goods to having a trade surplus. By contrast, France, Italy, Austria, Finland and Sweden saw the opposite development, namely their trade position for goods moved from a surplus to a deficit. Belgium, Denmark, Germany, Ireland and the Netherlands had a trade surplus both in 2002 and 2021. The remaining fifteen Member States had a trade deficit in both years.
The trade surplus for goods in Germany decreased by €51 billion between 2002 and 2022, while the highest absolute increases was reported in the Netherlands (€38 billion). France's trade balance dropped the most between 2002 and 2021, by €194 billion. Italy Romania, Spain and Finland were the only other Member States whose trade balance dropped by more than €20 billion.
(€ billion)
Source: Eurostat (ext_lt_intratrd) and (ext_lt_intercc)
The value of intra-EU trade in goods was 1.5 times as high as the value of extra-EU trade in goods in 2021
Although trade flows within the single market may not appear (at first sight) to be particularly ‘global’ in nature and could be considered by some as ‘protectionist’ or ‘inward-looking’, it is important to note that some of these intra-EU flows result from the activities of European or multinational enterprises producing goods on foreign territories; for example, German or Japanese cars manufactured in Slovakia or Romania, from where they may be exported tariff-free to other parts of the single market.
A comparison between intra-EU trade (between EU Member States) and extra-EU trade (between EU Member States and non-member countries) reveals that the former was 1.5 times as high as the latter in 2002; this comparison is made on the basis of total trade (in other words, the sum of imports and exports). This ratio was slightly higher in 2021 when intra-EUE trade was 1.6 times as high as extra-EU trade (see Table 1).
The relative significance of different products
A high proportion of the goods imported into the EU are primary goods
Table 1 provides more detailed information — based on the Standard International Trade Classification (SITC) — concerning the relative significance of different products within intra-EU and extra-EU trade. The intrinsic nature of different goods means that some are largely restricted to national markets or trade within the single market (intra-EU trade), whereas others are more openly traded on global markets. For example, the perishable nature of some food products may, at least in part, explain why food, drinks and tobacco accounted for almost one tenth (9.5 %) of all intra-EU exports in 2022, while their share of extra-EU exports was somewhat lower, at 7.9 %. On the other hand, the scarcity or a complete lack of natural resource endowments may explain, at least to some degree, why some goods are imported from extra-EU partners; this is the case for mineral fuels and related materials, which accounted for 27.7 % of all extra-EU imports, compared with a 9.4 % share of intra-EU imports.

(share in total, %)
Source: Eurostat (ext_lt_intratrd)
International trade in goods - intra-EU and extra-EU flows
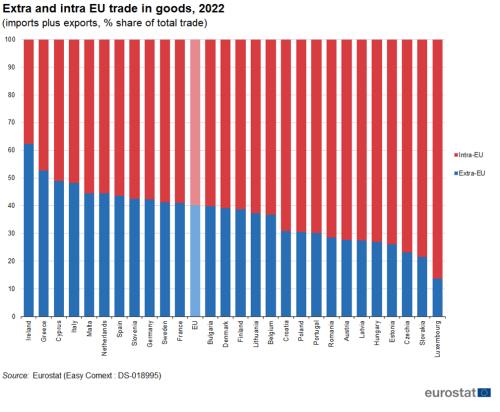
In 2022 Ireland and Greece were the only EU Member State that had a higher share of its trade in goods with non-member countries
Figure 4 provides an analysis at an aggregate level for total trade in goods showing which EU Member States had a higher propensity to trade within the single market (intra-EU trade) and which had a higher proportion of their total trade with non-member countries (extra-EU trade). The proportion of total trade in goods that was accounted for by intra-EU and extra-EU flows varied considerably across the Member States, reflecting to some degree historical ties and geographical location. In 2022, more than three quarters of the trade conducted by Luxembourg (86.3 %), Slovakia (78.5 %) and Czechia (76.8 %) was with intra-EU partners; there were 13 additional Member States where the share of intra-EU trade in total trade was within the range of 60-75 %. In ten Member States the share was between 50 % and 60 %, while only Ireland and Greece reported more extra-EU rather than intra-EU trade.
(imports plus exports, % share of total trade)
Source: Eurostat (ext_lt_intratrd)
Volume of goods
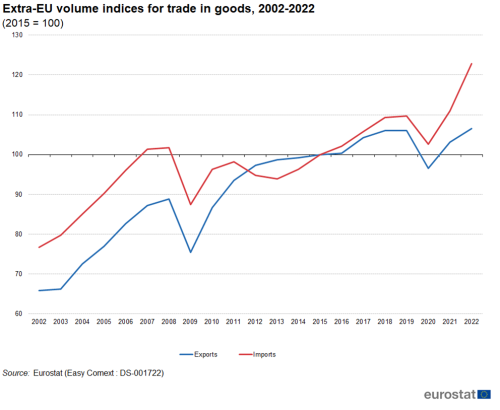
Imports (+46.1 percentage points) and exports (+40.7 percentage points) of goods grew between 2002 and 2022 despite setbacks in 2009 and 2020
Figure 5 extends the analysis of international trade developments to cover extra-EU volume indices for trade in goods. The patterns of development for EU trade were broadly similar to those in value terms (see Figure 1) during the period 2002-2008. Thereafter, there was a sizeable contraction in the volume of goods traded in 2009, as the global financial and economic crisis impacted on the level of trade with non-member countries; extra-EU exports were reduced by 13.5 percentage points while the corresponding reduction for extra-EU imports was 14.2 percentage points. Between 2009 and 2022 extra-EU imports increased by 35.3 percentage points while exports increased by 31.1 percentage points despite decreases for both imports (-7.1 percentage points) and exports (-9.4 percentage points) between 2019 and 2020 due in large part to the COVID-19 pandemic.
(2010 = 100)
Source: Eurostat (ext_lt_intertrd)
EU Terms of trade
Terms of trade
Unit value indices provide a proxy for the price of imports and exports: changes in the (relative) price of specific products/goods can have a major impact on the trade performance and the structure of trade in individual EU Member States. For example, if the price of oil doubles then it is possible that some Member States (with a high degree of energy dependency) may see their trade position move from a surplus to a deficit.
The terms of trade index presents, for an individual country or geographical aggregate, the ratio between the unit value indices for exports and imports; if the terms of trade are higher than 100 %, then the relative price of exports is greater than the relative price of imports. If a country’s terms of trade improve, then for every unit of exports that it sells abroad, it is able to purchase more units of imported goods. That said, an improvement in the terms of trade may also mean that the price of a country’s exports becomes relatively more expensive on global markets and depending upon the scarcity of these goods (and the availability of possible substitutes), such an increase may have a direct impact on the volume of goods that are exported and could reduce a country’s trade balance.
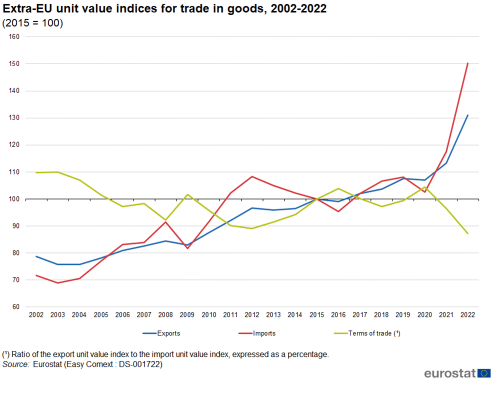
Between 2002 and 2022 the EU’s terms of trade declined …
Figure 6 shows the development of extra-EU unit value indices during the period 2002-2022. The unit values of EU imports and exports rose during this period. The overall change for imports was 52.3 percentage points, while that for exports was higher, at 78.5 percentage points. As a result, the EU terms of trade index fell overall by 22.6 percentage points.
(2010 = 100)
Source: Eurostat (ext_lt_intertrd)
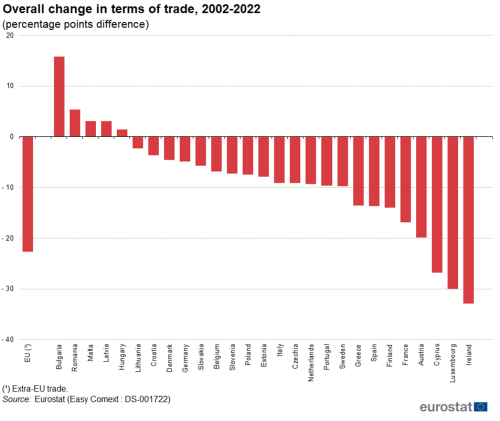
The information presented in Figure 7 extends the analysis of terms of trade to the individual EU Member States; note the data concerns trade flows with the rest of the world (in other words, both intra-EU and extra-EU trade). In 2022, there were only two Member States (Latvia and Luxembourg) that had terms of trade indices that were above parity (in other words, their unit value indices for exports were higher than their unit value indices for imports) while the lowest terms of trade were recorded in Italy and Ireland. Between 2002 and 2022, Bulgaria and Romania had the biggest improvements in their respective terms of trade (up 15.8 and 5.4 percentage points respectively). Twenty-two Member States saw their terms of trade deteriorate between 2002 and 2022, with declines of more than 20.0 percentage points recorded for Ireland, Cyprus and Luxembourg.
(percentage points difference)
Source: Eurostat (ext_lt_intertrd)
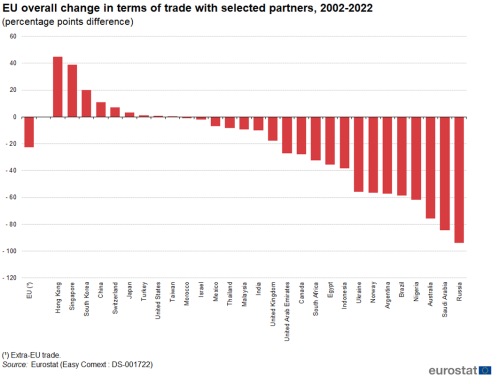
EU terms of trade deteriorated with a number of countries from which it imports a relatively large amount of raw materials, minerals and energy-related goods
EU terms of trade indices can also be analysed on the basis of bilateral indices for selected trade partners. Given that for extra-EU partners as a whole the terms of trade fell by 22.6 percentage points between 2002 and 2022, it is perhaps unsurprising to find that the terms of trade with a majority of the selected partners shown in Figure 8 also deteriorated. This was particularly the case for a number of trade partners from which the EU imports a relatively large amount of raw materials, minerals and energy-related goods such as Russia, Saudi Arabia, Australia, Nigeria, Brazil, Australia, Argentina, Norway and Ukraine. By contrast, EU terms of trade with the United States (up 1.0 points) and China (up 11.0 points) improved. There were also double-digit improvements recorded for the EU’s terms of trade with South Korea (up 20.2 points) and Singapore (up 38.9 points), while the biggest improvement was for the terms of trade with Hong Kong, a gain of 44.8 percentage points.
(percentage points difference)
Source: Eurostat (DS-001722)
The final analysis in this article presents information on the overall change in EU terms of trade for a number of selected products (based on the SITC) between 2002 and 2022 as shown in Figure 9. At the start of this period, terms of trade indices were below parity for only two products — mineral fuels, lubricants and related materials and machinery and transport equipment. By 2022, this situation had changed and all product groupings had terms of trade below parity with the exception of food, drinks and tobacco. EU terms of trade indices generally deteriorated between 2002 and 2022, with the only improvement recorded for machinery and transport equipment (+ 4.2 points).
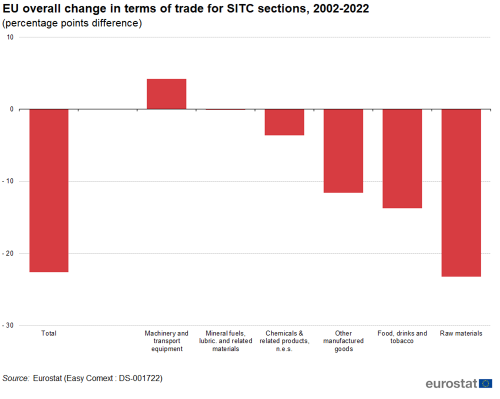
(percentage points difference)
Source: Eurostat (DS-001722)
Source data for tables and graphs
Direct access to
- International trade in goods - aggregated data
- International trade in goods - long-term indicators
- International trade in goods - detailed data
- International trade in goods (ESMS metadata file — ext_go_agg_esms)
