Businesses in the information and communication services sector
Data extracted in January 2023.
Planned article update: 14 June 2024.
Highlights
The information and communication services sector numbered ovearound 1.2 million enterprises and employed more than 6.4 million people in the EU in 2020.
The information and communication services sector accounted for 4.9 % of enterprises in the EU in 2020.
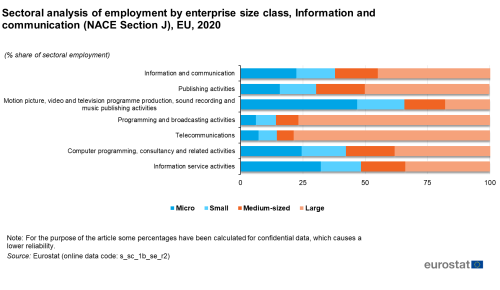
(% share of sectoral employment) - Source: Eurostat (sbs_sc_1b_se_r2)
This article presents an overview of statistics for the European Union’s (EU) information and communication services sector, as covered by NACE Rev. 2 Section J. It belongs to a set of statistical articles on 'Business economy by sector'
Full article
Structural profile
The EU’s information and communication services sector (Section J) numbered around 1.2 million enterprises in 2020, an increase of 3.1 % compared to 2019. It employed more than 6.4 million persons and generated €572 billion of value added, an increase of 3.1 % compared to pre-pandemic times. This sector’s contribution to the non-financial business economy (Sections B to J and L to N and Division 95) was 8.8 % of value added and 5.0 % of the enterprise population and the persons employed, respectively.
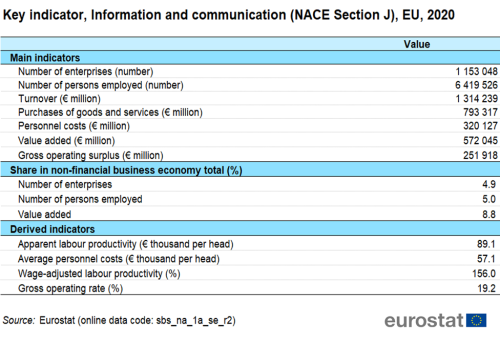
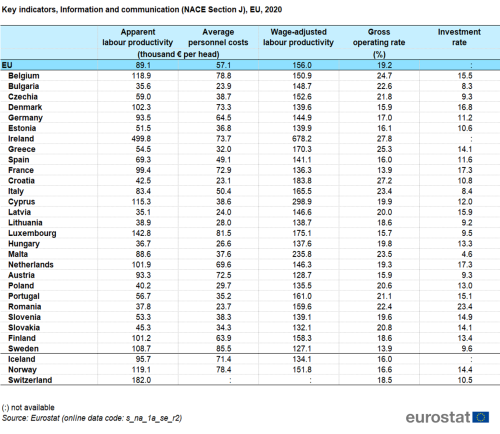
The apparent labour productivity of the EU’s information and communication services sector in 2020 was €89 100 per person employed, which was more than 75.0 % higher than the non-financial business economy average of €50 900 per person employed. Alongside this relatively high apparent labour productivity — third highest among the NACE sections that form the non-financial business economy — average personnel costs within the information and communication services sector were €57 100 per employee, which was also well above the average for the non-financial business economy (€36 400 per employee) and the second highest among the NACE sections.
The wage-adjusted labour productivity ratio shows that value added per person employed was equivalent to 156.0 % of average personnel costs per employee across the EU in 2020. This ratio was substantially higher than the non-financial business economy average (139.8 %). Equally the EU’s information and communication services sector recorded a gross operating rate of 19.2 % in 2020, almost double the 10.3 % average for the whole of the non-financial business economy and only lower than the rates recorded for real estate activities (40.9 %).
Sectoral analysis
One of the six subsectors (at the division level) dominated the information and communication services sector in the EU, namely computer programming, consultancy and related activities (Division 62). This subsector generated more than half (56.1 %) of the employment in 2020, employing 3.6 million persons . The second largest subsector was telecommunications (Division 61), which accounted for 13.2 % (0.8 million persons employed) of the information and communication services employment and contributed 24.5 % to sectoral value added (€140 million).
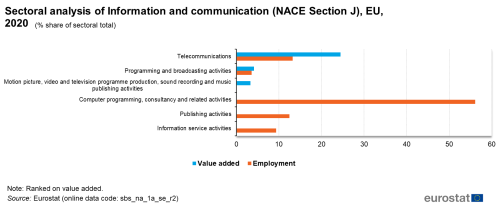
(% share of sectoral total) - Source: Eurostat (sbs_na_1a_se_r2)
Other subsectors within the information and communication services sector are: - publishing activities (Division 58), - motion picture, video and television programme production, sound recording and music publishing activities (Division 59), - programming and broadcasting activities (Division 60), - information service activities (Division 63).
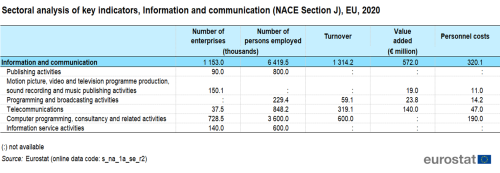
The high apparent labour productivity figure for the whole of the EU’s information and communication services sector in 2020 was pulled upwards by the values for the telecommunications subsector (€165 100 per person employed) and the programming and broadcasting activities subsector (€103 700 per person employed). Among the other subsectors within the information and communication services sector for which data is available, apparent labour productivity was below the sectoral average of €89 100 per person employed, but still above the non-financial business economy average of €50 900 per person employed.
Due to the very high apparent labour productivity, the telecommunications subsector recorded the highest levels of wage-adjusted labour productivity (288.0 %), which was among the highest wage-adjusted labour productivity ratios at the NACE division level within the non-financial business economy in 2020.
Country overview
In the information and communication services sector, two thirds of the member states had higher shares of non-financial business economy value added than the EU average of 8.8 %. The highest shares were recorded in in Ireland (22.4 %), Cyprus (17.2 %), Malta (14.1 %), Bulgaria (12.6 %) and Sweden (11.3 %, while the lowest was recorded in Austria, 5.8 % (see Figure 2). The relative weight of the information and communication services sector was higher than the EU average in Iceland (10.0 %) and lower than the EU average in Switzerland and Norway, as it contributed 7.3 % and 7.2 % respectively to the value added that was generated within the non-financial business economies of these two countries in 2020.
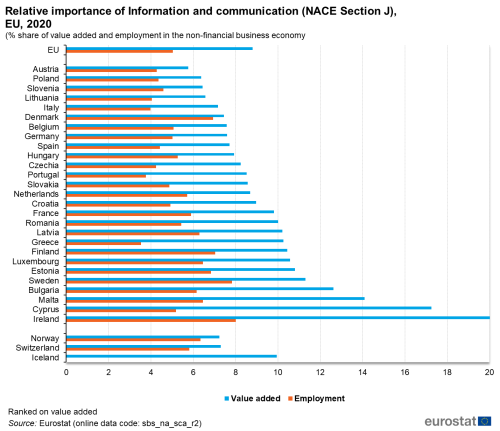
(% share of value added and employment in the non-financial business economy total) - Source: Eurostat (sbs_na_sca_r2)
Germany made the largest contribution among the EU Member States to sectoral value added and employment within the information and communication services sector in 2020, accounting for a 24.2 % share of EU value added and a 28.0 % share of the information and communication services employment. Almost 1.5 million persons were employed within the information and communication services sector in Germany in 2020. Two countries with the highest recorded levels of value added within the information and communication services sector in 2020 were Germany and France (€138.2 billion and €95.1 billion respectively). Collectively, the five largest Member States accounted for 66.9 % of the EU’s value added in the information and communication services sector.
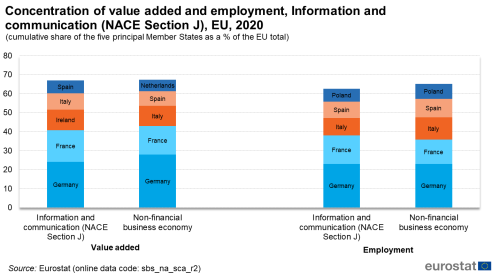
(cumulative share of the five principal Member States as a % of the EU total) - Source: Eurostat (sbs_na_sca_r2)
Germany made the highest contribution to EU value added in five out of six subsectors. In the largest subsector, namely computer programming and consultancy, Germany generated the largest share of EU value added (12.9 % in 2020); while Malta was the most specialised with 9.3 % of non-financial business economy value added in 2020. In relative terms, the most specialised EU Member State within the information and communication services sector was Ireland (with 22.4 % of non-financial business economy value added in 2020). For the six subsectors that form information and communication services — the data that are available show a geographical spread of the specialisation depending on the subsector.
Eight countries; Ireland, Luxembourg, Belgium, Cyprus, Sweden, Denmark, the Netherlands and Finland stood out as having an apparent labour productivity higher than €100 000 per person employed for the information and communication services sector in 2020. Ireland reported the highest wage-adjusted labour productivity ratio, at 678.2 %, followed by Cyprus at 298.9 % and Malta at 235.8 %. None of the Member States recorded a wage-adjusted labour productivity ratio that was below parity (100 %).
The highest gross operating rate for the information and communication services sector in 2020 was recorded for Ireland (27.8 %); while rates above 20.0 % were recorded in total in 13 EU Member States.
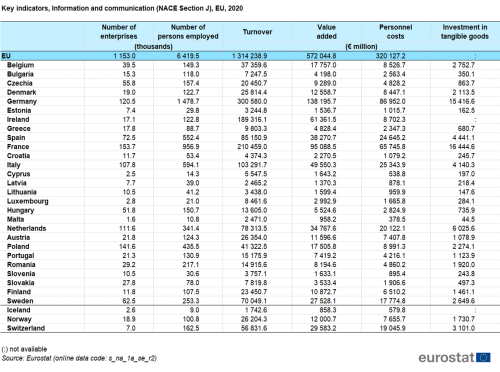
Size class analysis
Large enterprises (employing 250 or more persons) dominated the information and communication services sector in the EU; in 2020 they reported a 61.8 % share of sectoral value added (equal to €353.6 billion), while SMEs contributed €218.4 billion to sectoral value added. The apparent labour productivity of SMEs within the EU’s information and communication services sector was €62 800 per person employed in 2020.
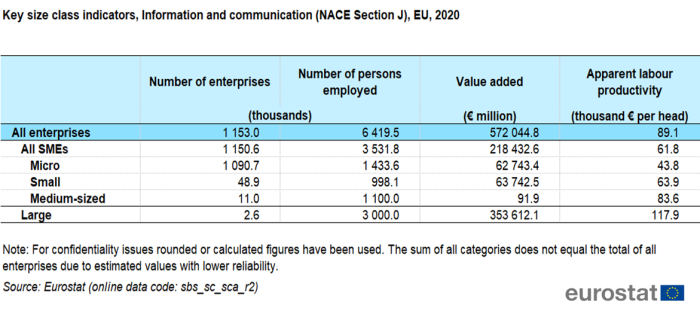
Across all of the NACE sections that form the non-financial business economy, the information and communication services sector recorded the fourth highest contribution from large enterprises to its sectoral value added — behind the electricity, gas, steam and air conditioning supply and manufacturing (Sections D and C).
The apparent labour productivity of large enterprises within the EU’s information and communication services sector was €89 100 per person employed in 2020, more than the level recorded in the SME, (€61 800 per person employed). There appeared to be increasing returns to scale within the information and communication services sector.
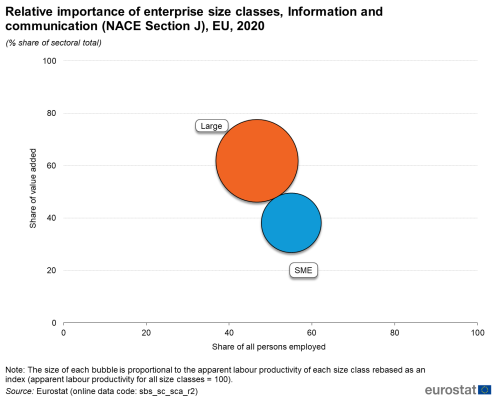
(% share of sectoral total) - Source: Eurostat (sbs_sc_sca_r2)

(% share of sectoral employment) - Source: Eurostat (sbs_sc_1b_se_r2)
In employment terms, the dominance of large enterprises was somewhat less apparent, but remained prevalent, especially for the telecommunications subsector where large enterprises accounted for 78.7 % of the total person employed across the EU. Almost half is the contribution of large enterprises to the employment in the publishing subsector (48.7 %).
Data sources
Coverage
Information and communication services concern the production and distribution of information and cultural products, the provision of the means to transmit or distribute these products as well as data or communications, information technology activities, and the processing of data and other information service activities.
The sector is composed of six separate NACE divisions and includes:
- publishing activities (Division 58);
- motion picture and sound recording activities (Division 59);
- programming and broadcasting activities (Division 60);
- wired, wireless and satellite telecommunications activities (Division 61);
- computer programming and consultancy activities (Division 62);
- information service activities such as data processing, hosting, web portals, news agencies, information search (Division 63).
Note that this article does not cover printing or the mass reproduction of recorded media, both of which are considered as part of the manufacturing sector (Section C). The activities of call centres are included within the administrative and support services sector (Section M).
Publishing includes the acquisition of copyrights to content (information products) and making this content available to the general public by engaging in or arranging for the reproduction and distribution of this content in various forms; all types of media are included. Different types of content are considered, with the publishing activity as presented in this article including content such as books, newspapers, magazines and software, while the production of audio and visual content is included within motion picture and sound recording activities.
Programming and broadcasting activities cover the production and distribution of TV programming and involves different stages: production of individual items (such as films or television series); the creation of a complete television channel programme (including live news programming) and broadcasting; distribution of complete television programmes by third parties without any alteration of the content, for example through broadcasting, satellite or cable systems.
Data sources
The analysis presented in this article is based on the main dataset for structural business statistics (SBS), size class data and regional data, all of which are published annually.
The main series provides information for each EU Member State as well as a number of non-member countries at a detailed level according to the activity classification NACE. Data are available for a wide range of variables.
In structural business statistics, size classes are generally defined by the number of persons employed. A limited set of the standard structural business statistics variables (for example, the number of enterprises, turnover, persons employed and value added) are analysed by size class, mostly down to the three-digit (group) level of NACE. The main size classes used in this article for presenting the results are:
- small and medium-sized enterprises (SMEs): with 1 to 249 persons employed, further divided into:
- micro enterprises: with less than 10 persons employed;
- small enterprises: with 10 to 49 persons employed;
- medium-sized enterprises: with 50 to 249 persons employed;
- large enterprises: with 250 or more persons employed.
Structural business statistics also include regional data. Regional SBS data are available at NUTS levels 1 and 2 for the EU Member States, Iceland and Norway, mostly down to the two-digit (division) level of NACE. The main variable analyzed in this article is the number of persons employed. The type of statistical unit used for regional SBS data is normally the local unit, which is an enterprise or part of an enterprise situated in a geographically identified place. Local units are classified into sectors (by NACE) normally according to their own main activity, but in some EU Member States the activity code is assigned on the basis of the principal activity of the enterprise to which the local unit belongs. The main SBS data series are presented at national level only, and for this national data the statistical unit is the enterprise. It is possible for the principal activity of a local unit to differ from that of the enterprise to which it belongs. Hence, national SBS data from the main series are not necessarily directly comparable with national aggregates compiled from regional SBS.
Context
Technological and regulatory advancements have made it possible for broadcasting to be opened up to a wider range of content and services to users than those traditionally distributed by government-licensed organisations that used to be solely responsible for the broadcasting of a small number of radio and television channels according to a fixed schedule. Using a range of modern technologies, broadcasting can nowadays be undertaken with far lower entry barriers, providing a wider range of distribution media, content and services to users.
Information and communication technologies (ICT) affect people’s everyday lives in many ways and EU policies in this area range from regulating entire sectors to trying to protect an individual’s privacy. The increased availability of broadband services and of wireless devices is transforming economic and societal behaviour. Widespread access to the internet via rapid broadband connections is seen as essential for the development of advanced services on the internet.
In May 2010, the European Commission adopted a Communication concerning a Digital Agenda for Europe, a strategy for a flourishing digital economy by 2020, replacing the i2010 initiative; this is one of seven flagship initiatives under the Europe 2020 strategy for smart, sustainable and inclusive growth. It outlines policies and actions aimed at maximizing the benefit of the digital era to all sections of society and the economy. The agenda focuses on seven priority areas for action: creating a digital single market, greater interoperability, boosting internet trust and security, providing much faster internet access, encouraging investment in research and development, enhancing digital literacy skills and inclusion, and applying ICT to address challenges facing society like climate change and the ageing population.
The Digital Agenda for Europe defines roaming as a key performance target for attaining the Digital Single Market, with the stated aim of making the difference between roaming and national tariffs approach zero by 2016. After having conducted a thorough review, the European Commission found that the roaming market is not yet competitive enough and despite the fact that the cost of using mobile phones or other devices when abroad in the EU has continuously fallen, most operators still propose retail prices that remain around the maximum legal caps. For this reason the Roaming Regulation has been extended until 30 June 2022, and a series of new measures aimed at increasing competition and encouraging operators to offer attractive consumer deals have also been introduced; these revised rules started as of 1 July 2012.
Direct access to
Structural business statistics introduced
More detailed analysis of information and communication service activities:
Other analyses of the business economy by NACE Rev. 2 sector
- SBS – services (sbs_serv)
- Annual detailed enterprise statistics - services (sbs_na_serv)
- Annual detailed enterprise statistics for services (NACE Rev. 2, H-N and S95) (sbs_na_1a_se_r2)
- SMEs - Annual enterprise statistics by size class - services (sbs_sc_sc)
- Services by employment size class (NACE Rev. 2, H-N, S95) (sbs_sc_1b_se_r2)
- Annual detailed enterprise statistics - services (sbs_na_serv)
- SBS - regional data - all activities (sbs_r)
- SBS data by NUTS 2 regions and NACE Rev. 2 (from 2008 onwards) (sbs_r_nuts06_r2)
- Decision 1578/2007/EC of 11 December 2007 on the Community Statistical Programme 2008 to 2012
- Regulation (EC) No 295/2008 of 11 March 2008 concerning structural business statistics
- Summaries of EU Legislation: Business statistics