Health statistics at regional level
Data extracted in March 2023.
Planned article update: September 2024.
Highlights
In 2021, there were three regions in the EU – Anatoliki Makedonia, Thraki (Greece), Sud-Est (Romania) and Estonia – where more than 8.0 % of the population aged 16 years or over reported unmet needs for medical examination.
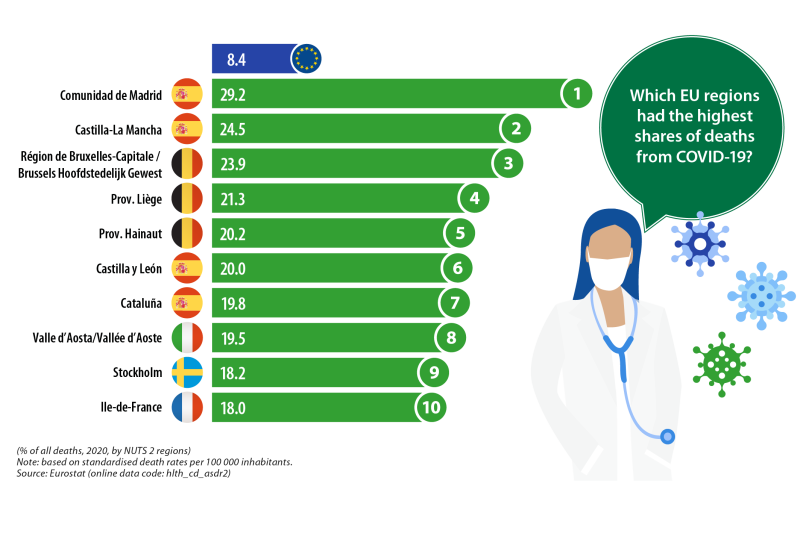
In 2020, COVID-19 accounted for 29.2 % of all deaths in the Spanish capital region of Comunidad de Madrid – the highest regional share in the EU.
Health is an important priority for most Europeans who expect to receive efficient healthcare services – for example, if contracting a disease or being involved in an accident – alongside timely and reliable public health information. One of the 20 principles of the European Pillar of Social Rights is that everyone has the right to timely access to affordable, preventive and curative health care of good quality. The overall health of the European Union’s (EU’s) population is closely linked to that of the environment through – among other influences – the quality of the air we breathe, the water we drink and the food we eat.
The COVID-19 crisis resulted in severe human suffering and a considerable loss of life. The pandemic highlighted the need to prioritise public health and to strengthen healthcare systems across the EU. The European Commission took a series of coordinated actions to support the EU Member States’ efforts to contain the spread of the coronavirus, support health systems and counter the socioeconomic impact of the pandemic; for more information, see here .
This year’s edition of the Eurostat regional yearbook is the first to include data on causes of death relating to COVID-19. In 2020, some 8.4 % of all deaths in the EU were attributed to COVID-19: as such, it was the third most common cause of death, behind circulatory diseases and malignant neoplasms (cancer). At the start of May 2023, the WHO declared that the pandemic was no longer a global threat. Most aspects of life in the EU have returned to ‘normality’, with the majority of restrictions on personal mobility and economic sectors having been lifted. That said, COVID-19 continues to impact healthcare systems in the EU: for example, large numbers of operations/treatments were cancelled or delayed during the pandemic because frontline staff had been redeployed to take care of those suffering from the virus or because they were suffering from the virus themselves. Furthermore, at an individual level, some patients decided to forego hospital visits, thereby missing regular check-ups and screening for a variety of diseases.
In 2020, almost 3 out of every 10 deaths (29.2 %) in the Spanish capital region of Comunidad de Madrid were attributed to COVID-19 (see the infographic above). This was, by far, the highest share recorded across NUTS level 2 regions of the EU. There were five more regions where COVID-19 accounted for at least one in five deaths:
- two of these bordered the Spanish capital – Castilla-La Mancha (24.5 %) and Castilla y León (20.0 %);
- three were located in Belgium – Région de Bruxelles-Capitale / Brussels Hoofdstedelijk Gewest (23.9 %), Prov. Liège (21.3 %) and Prov. Hainaut (20.2 %).
Full article
Health care
In 2021, some 8.9 % of the population in the Greek region of Anatoliki Makedonia, Thraki had unmet needs for medical examination
In 2021, 2.0 % of the EU population aged 16 years or over reported that they had unmet needs for a medical examination or treatment in the previous 12 months for reasons of finance, distance/transport, and/or waiting lists (hereafter referred to as unmet needs for medical examination). An analysis of NUTS level 2 regions reveals this share ranged from 0.1 % in Germany (national data), Cyprus and Malta up to 8.9 % in the Greek region of Anatoliki Makedonia, Thraki; note that data for Belgium, Italy and Serbia relate to level 1 regions and that only national data are available for Czechia, Germany, Spain, France, the Netherlands, Austria, Portugal and Türkiye.
The regional distribution of this indicator was balanced, insofar as there were 53 regions that recorded shares that were higher than the EU average, 50 regions with shares that were lower than the EU average, and two regions that had shares identical to the EU average. At the top end of the distribution, there were 12 regions where the self-reported share of people aged 16 years or over with unmet needs for medical examination in 2021 was at least 6.0 % (as shown by the darkest shade in Map 1). These regions were principally located in Greece (six regions) and Romania (three regions); the three remaining regions with relatively high shares included:
- Estonia;
- Stredné Slovensko in Slovakia (2020 data); and
- Wielkopolskie in Poland.
At the other end of the distribution there were nine regions across the EU where less than 0.5 % of the population aged 16 years or over reported unmet needs for medical examination in 2021 (as shown by the lightest shade in Map 1). This group included three regions in Hungary – Közép-Dunántúl, Dél-Dunántúl and Dél-Alföld – Cyprus and Malta, as well as Czechia, Austria, the Netherlands and Germany (only national data available for this latter group of four).
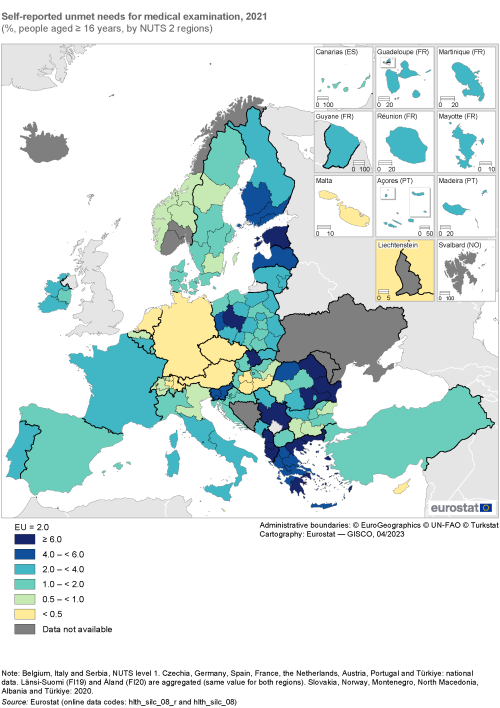
(%, people aged ≥ 16 years, by NUTS 2 regions)
Source: Eurostat (hlth_silc_08_r) and (hlth_silc_08)
Hospital beds and medical doctors
The number of hospital beds and the number of medical doctors are indicators that may be used to measure the capacity of healthcare systems in regular times and their preparedness/resilience to pandemics (such as COVID-19).
The number of hospital beds includes those which are regularly maintained and staffed and immediately available for the care of patients admitted to hospitals; these statistics cover beds in general hospitals and in speciality hospitals. In 2019, there were 2.38 million hospital beds across the EU. This equated to 532 hospital beds per 100 000 inhabitants, or – expressed in a different way – there was, on average, one hospital bed for every 188 people.
The number of medical doctors includes generalists (such as general practitioners (GPs)) as well as medical and surgical specialists. These doctors provide services to patients as consumers of health care, including: giving advice, conducting medical examinations and making diagnoses; applying preventive medical methods; prescribing medication and treating diagnosed illnesses; giving specialised medical or surgical treatment. Eurostat gives preference to the concept of practising healthcare staff. Note that the data for Greece, Portugal and Finland relate to medical doctors licensed to practice, while the data for Slovakia, North Macedonia and Türkiye relate to professionally active medical doctors. In 2020, there were 1.8 million medical doctors in the EU; this equated to an average of 391.4 per 100 000 inhabitants.
The capital region of Romania – Bucureşti-Ilfov – was the only region in the EU to report more than 1 000 hospital beds per 100 000 inhabitants
Map 2 shows the number of hospital beds and the number of medical doctors per 100 000 inhabitants in 2020 for NUTS level 2 regions; only national data are available for Germany, Ireland, Croatia, the Netherlands and Finland. There were 13 regions across the EU with a relatively high concentration of both of these healthcare resources – with at least 575.0 hospital beds per 100 000 inhabitants and at least 450.0 medical doctors per 100 000 inhabitants – as shown by the darkest shade of green in the map. A closer analysis reveals that this group included:
- seven capital regions – those of Bulgaria, Czechia, Lithuania, Hungary, Austria, Romania and Slovakia (to some extent, this may reflect country-specific ways of organising health care and the types of service provided to patients; it also reflects a large number of healthcare services and medical doctors being concentrated in urban regions with high levels of population density);
- five additional regions from Austria;
- the island region of Região Autónoma da Madeira (Portugal).
By contrast, there were 13 regions in the EU with a relatively low concentration of healthcare resources per 100 000 inhabitants – less than 350.0 hospital beds and less than 350.0 medical doctors – as shown by the lightest shade in the map. This group included Pest in Hungary, a region which surrounds the national capital of Budapest (that featured among the 13 regions with the highest ratios of hospital beds and medical doctors per 100 000 inhabitants). This contrasting situation reflects, at least in part, a relatively centralised healthcare system in Hungary, with a high proportion of hospitals and other medical facilities in the region of Budapest, where demand is further stimulated by medical tourism (for example, cosmetic and orthopaedic surgery, fertility treatment, balneotherapy or dentistry). The remaining 12 regions with a relatively low concentration of healthcare resources were composed of rural, remote and outermost regions:
- the northern Danish region of Nordjylland (2019 data);
- Ireland (national data);
- the Greek regions of Voreio Aigaio and Sterea Elláda (2019 data);
- the Spanish regions of La Rioja and Castilla-La Mancha;
- the French outermost regions of Guyane and Mayotte;
- the Italian regions of Basilicata, Provincia Autonoma di Bolzano/Bozen and Veneto; and
- the southern Portuguese region of Alentejo.
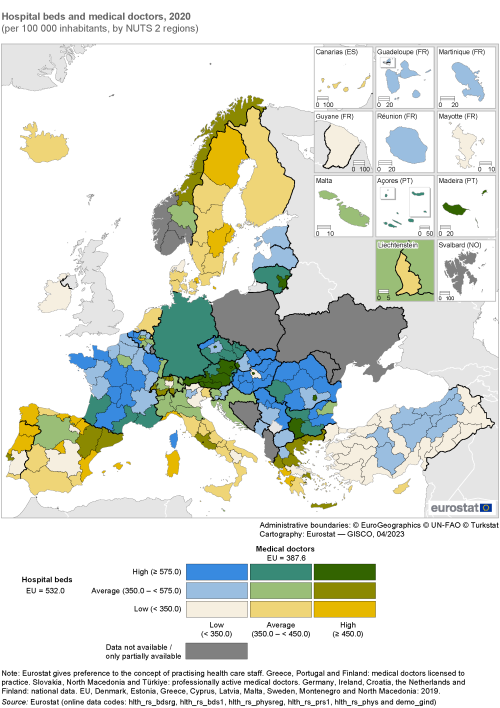
(per 100 000 inhabitants, by NUTS 2 regions)
Source: Eurostat (hlth_rs_bdsrg), (hlth_rs_bds1), (hlth_rs_physreg), (hlth_rs_prs1), (hlth_rs_phys) and (demo_gind)
The number of hospital beds relative to the population fell in almost two-thirds of EU regions
Falling numbers of hospital beds relative to population numbers may reflect, among other factors: cuts to healthcare spending in the aftermath of the global financial and economic crisis; medical and technological developments; or changes in healthcare policies. For example, the need for hospital beds may be reduced through a greater provision of day-care and outpatient services as well as reductions in the average length of hospital stays; such changes may result from the introduction of new treatments and less invasive forms of surgery. In addition, during the pandemic, hospital services outside of emergencies were often closed (for example, many planned operations were postponed and/or staff shortages meant that certain wards were shut down); these factors may also have contributed to a decrease in bed numbers.
Figure 1 shows the NUTS level 2 regions in the EU with the highest and lowest annual rates of change for their number of hospital beds per 100 000 inhabitants; the latest data available for Germany relate to NUTS level 1 regions, while only national data are available for Ireland, Croatia and the Netherlands. For the vast majority of regions, the latest data available relate to annual changes between 2019 and 2020, although the latest information for the EU, Germany, Estonia, Greece, Cyprus, Latvia, Luxembourg and Malta refers to the change in hospital bed numbers per 100 000 inhabitants between 2018 and 2019.
The number of hospital beds per 100 000 inhabitants across the EU was 1.2 % lower in 2019 than in 2018. Almost two thirds (65.7 %) of EU regions (134 out of 204) recorded a fall in their number of hospital beds per 100 000 inhabitants between 2019 and 2020. There were 10 regions where the annual fall in the number of hospital beds per 100 000 inhabitants was within the range of -5.0 % to -10.0 %. The six largest decreases within this group are shown in Figure 1, along with information for four other regions that recorded much bigger losses, namely:
- the southern Italian region of Calabria (down 21.9 %); and
- three regions located in Finland – the capital region of Helsinki-Uusimaa (down 20.0 %), Etelä-Suomi (down 21.5 %) and the archipelago of Åland (down 53.9 %) which has a relatively small population and a limited range of medical facilities.
By contrast, there were 70 regions across the EU where the number of hospital beds per 100 000 inhabitants increased between 2019 and 2020. Only one of these recorded a double-digit increase: the mountainous, north-western Italian region of Valle d’Aosta/Vallée d’Aoste (up 16.1 %). The next highest increases were observed in the Swedish capital region of Stockholm (up 8.1 %), the Polish regions of Lubelskie (up 6.5 %) and Opolskie (up 5.8 %), the northern Spanish region of Cantabria (up 6.1 %), and the Greek regions of Dytiki Makedonia (up 5.9 %) and Ipeiros (up 5.8 %). All but one of the regions in Romania – the exception being Nord-Est – recorded a positive development in hospital bed numbers per 100 000 inhabitants in 2020.
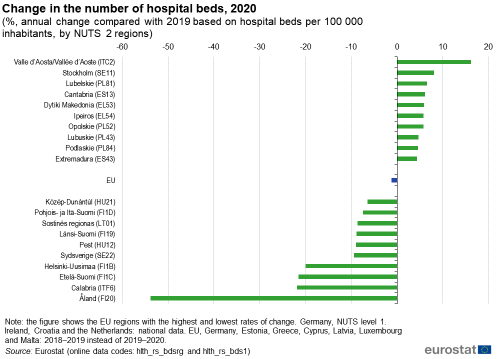
(%, annual change compared with 2019 based on hospital beds per 100 000 inhabitants, by NUTS 2 regions)
Source: Eurostat (hlth_rs_bdsrg) and (hlth_rs_bds1)
The number of medical doctors relative to the population rose in approximately three fifths of EU regions
Figure 2 shows the NUTS level 2 regions in the EU with the highest and lowest annual rates of change for their number of medical doctors per 100 000 inhabitants; only national data are available for Germany, Ireland, Croatia and Finland. The number of medical doctors per 100 000 inhabitants increased in the EU at an annual rate of 1.0 % in 2019.
Approximately three out of every five (or 108 out of 177) regions across the EU recorded an increase in their number of medical doctors per 100 000 inhabitants between 2019 and 2020; data for Denmark, Estonia, Cyprus, Latvia and Sweden relate to 2018–2019 instead of 2019–2020. Every region of Belgium, Cyprus (2019), Malta, the Netherlands, Portugal, Slovenia and Slovakia recorded an annual increase in their respective number of medical doctors per 100 000 inhabitants in 2020. There were also positive rates of change observed in Germany, Ireland, Croatia and Finland (where only national data are available).
However, the eight regions with the highest annual growth rates were all located in Spain, with double-digit increases observed for seven of these. The highest rate of change was recorded in the island region of Illes Balears (up 33.6 %), followed by Extremadura (20.7 %) and Comunidad Foral de Navarra (18.6 %). The number of medical doctors per 100 000 inhabitants increased 9.6 % in the Spanish capital region of Comunidad de Madrid, while the only regions outside of Spain to record growth rates of at least 7.0 % were the Portuguese islands of Região Autónoma da Madeira, Vest in Romania, and Ipeiros in north-western Greece.
At the other end of the range, 8 out of the 10 EU regions with the biggest falls in 2020 for their number of medical doctors per 100 000 inhabitants were located in Hungary; in other words, this group included every region of Hungary. The largest declines were observed in Budapest (down 10.7 %), Nyugat-Dunántúl (down 11.1 %), Dél-Alföld (down 12.4 %) and Észak-Magyarország (down 13.9 %). The only regions outside of Hungary to record annual reductions of at least 6.0 % were Región de Murcia and La Rioja (both in Spain) and Dytiki Makedonia (Greece).
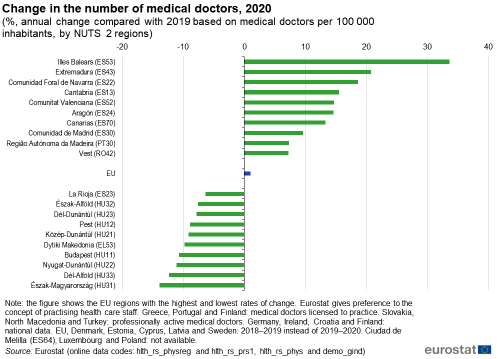
(%, annual change compared with 2019 based on medical doctors per 100 000 inhabitants, by NUTS 2 regions)
Source: Eurostat (hlth_rs_physreg), (hlth_rs_prs1), (hlth_rs_phys) and (demo_gind)
Causes of death
Information presented in this section is based on standardised death rates, whereby age-specific mortality rates are combined to reflect the structure of a standard population. This removes the influence of different age structures between regions (as elderly persons are more likely to die than younger persons or are more likely to catch/contract a specific illness/disease); the result is a measure that is more comparable across space and/or over time.
The total number of deaths in the EU increased by more than half a million between 2019 and 2020
In 2020, there were 5.18 million deaths across the EU. This equated to an increase of more than half a million compared with the year before (up 11.4 %), reflecting, at least in part, the impact of the COVID-19 crisis; more information about deaths during the early stages of the pandemic is provided below.
Map 3 shows information both for the relative number and for the main causes of deaths across NUTS level 1 regions with information generally available for 2020. There were eight regions in the EU where standardised death rates were at least 1 500 deaths per 100 000 inhabitants (as shown by the largest circles). Most of these had relatively low living standards, as their GDP per inhabitant (in purchasing power standards (PPS)) was commonly less than two thirds of the EU average. This situation was most notable in Severna i Yugoiztochna (Bulgaria) which recorded the highest death rate in the EU (1 854 deaths per 100 000 inhabitants) and the lowest level of GDP per inhabitant (39 % of the EU average). The other regions with particularly high death rates included all four regions in Romania, the two non-capital regions of Hungary, and the other Bulgarian region (Yugozapadna i Yuzhna tsentralna).
A similar pattern was often apparent for different regions within individual EU Member States. For example, the highest standardised death rates in three of the largest Member States in 2020 were recorded in Sachsen-Anhalt (eastern Germany), Sur (southern Spain) and Hauts-de-France (northern France). These regions are relatively disadvantaged, with levels of GDP per inhabitant that are considerably lower than their respective national averages. However, a different pattern was observed in Italy, as the highest death rate in 2020 was recorded in Nord-Ovest (which is a relatively rich region). This may be linked to the impact of the COVID-19 crisis, as several areas of northern Italy were particularly impacted during the early stages of the pandemic (as hospitals in some regions were overburdened).
In 2020, almost one third of all deaths in the EU were attributed to diseases of the circulatory system
In 2020, the three main causes of death in the EU were: diseases of the circulatory system, malignant neoplasms (hereafter referred to as cancer) and COVID-19. Diseases of the circulatory system – which include heart diseases, hypertensive diseases and diseases of pulmonary circulation – accounted for almost one third (32.4 %) of all deaths. Cancer accounted for 22.8 % of the total number of deaths in the EU.
Having been declared a pandemic on 11 March 2020 by the World Health Organization (WHO), the COVID-19 virus spread rapidly across the world, including across the EU. Aside from its considerable impact in terms of lives lost, the pandemic and its associated measures caused widespread disruption to daily lives and the economy. In 2020, COVID-19 accounted for 8.4 % of all deaths in the EU. To put this share into context, there were 439 000 deaths from COVID-19 in 2020, considerably higher than the 348 000 deaths from diseases of the respiratory system – the fourth most common cause of death in 2020.
Map 3 also shows data for the three main causes of death in 2020. Diseases of the circulatory system were the main cause of death in 71 % (65 out of 92) of NUTS level 1 regions. Among these, there were eight regions where more than half of all deaths were caused by diseases of the circulatory system: this group included both regions of Bulgaria, Latvia, Lithuania and all four regions of Romania. In Yugozapadna i Yuzhna tsentralna Bulgaria, close to two thirds of all deaths (63.5 %) were attributed to diseases of the circulatory system – the highest share in the EU. By contrast, the French capital region of Ile-de-France had the lowest share of deaths attributed to diseases of the circulatory system, at 16.7 %.
In 2020, cancer was the main cause of death in more than a quarter of all NUTS level 1 regions (25 out of 92). The 10 regions in the EU with the highest shares of deaths from cancer all had shares that were within a relatively narrow range (27.5–29.1 %). More than half of this group – six regions – was located in France (principally in western or central regions, but also including Corse), while the others included Åland (Finland), Ireland, the Dutch capital region of Noord-Nederland, and Denmark. Pays de la Loire in western France had the highest share of deaths from cancer, at 29.1 %. At the other end of the range, cancer accounted for a relatively low share of the total number of deaths in several regions where diseases of the circulatory system accounted for more than half of all deaths. This pattern was most apparent in the two Bulgarian regions and the Romanian region of Macroregiunea Patru, as cancer accounted for no more than 15.0 % of all deaths in these three regions.
In 2020, COVID-19 was the main cause of death in the Spanish capital region of Comunidad de Madrid, accounting for almost 3 out of every 10 deaths (29.2 %). The only other NUTS level 1 region in the EU where COVID-19 was the main cause of death was Région de Bruxelles-Capitale / Brussels Hoofdstedelijk Gewest; almost a quarter (23.9 %) of all deaths in the Belgian capital region were attributed to COVID-19. At the other end of the range, there were four regions in the EU where COVID-19 accounted for less than 1.0 % of all deaths in 2020. Three of these were island regions, where (at least during the initial stages of the pandemic) it may have been somewhat easier to control the spread of the virus through containment measures – Nisia Aigaiou, Kriti (Greece) and Regiões Autónomas dos Açores e da Madeira (both Portugal) – the other was the sparsely-populated, northern German region of Mecklenburg-Vorpommern.
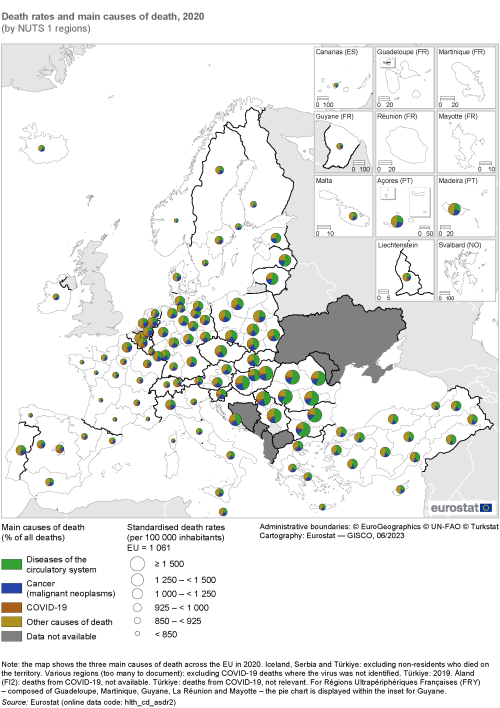
(by NUTS 1 regions)
Source: Eurostat (hlth_cd_asdr2)
Focus on deaths from COVID-19
COVID-19 is a respiratory infection caused by the novel coronavirus 2 (SARS-CoV-2 virus), first identified in Wuhan, China during December 2019. During its initial stages, the spread of COVID-19 was largely concentrated around international travel hubs that played a vital role in global transmission. The impact of the COVID-19 crisis was considerable, and undoubtedly played a part in the total number of deaths in the EU rising by more than half a million between 2019 and 2020 (up 11.4 %).
It is important to note that the information presented here is derived from the causes of death data collection. These data provide a measure of the number of deaths ‘from’ COVID-19 (in other words, as established by medical experts and as documented on death certificates). It takes a substantial period of time to produce the causes of death data and information are only now available for reference year 2020 (the first year of the COVID-19 pandemic). Statistics on causes of death were supplemented during the pandemic by information from the European Centre for Disease Prevention and Control (ECDC) on the number of deaths ‘with’ COVID-19 (in other words, deaths among people having tested positive for the virus); this alternative dataset (from teh ECDC) was principally used for the daily monitoring of COVID-19 mortality patterns.
Health inequalities were brought into stark contrast during the COVID-19 pandemic, with the number of deaths disproportionately high among elderly persons, people already suffering from pre-existing health conditions and disadvantaged groups within society. However, a wide range of factors determine regional mortality patterns, with deaths linked, among other issues, to age structures, the balance of males/females in the population, access to healthcare services, living/working conditions, types of occupation, and the surrounding environment.
Based on the latest causes of death data, there were 439 000 deaths in the EU attributed to COVID-19 during 2020, equivalent to 8.4 % of the total number of deaths (based on standardised death rates). Map 4 shows the proportion of deaths attributed to COVID-19 for NUTS level 2 regions; there are no data available for Åland (Finland). The regional distribution of deaths was heavily skewed during the first year of the pandemic, with approximately one third (32.8 %) of EU regions (79 out of 241) reporting a share of deaths from COVID-19 that was equal to or above the EU average. Successive waves of the pandemic had different distributions, as the virus became more prevalent and higher death rates were recorded, particularly in eastern EU Member States.
Looking in more detail, there were 24 regions where COVID-19 accounted for at least 15.0 % of all deaths in 2020 (as shown by the darkest shade in Map 4), they were principally concentrated in urban regions and included:
- seven regions from Belgium (one of which was the capital);
- seven regions from Spain (one of which was the capital);
- four regions from (northern) Italy;
- three regions from France (one of which was the capital); as well as
- Noord-Brabant in the Netherlands, Vzhodna Slovenija in Slovenia and Stockholm (the Swedish capital region).
There were 24 regions in the EU where COVID-19 accounted for less than 2.0 % of all deaths in 2020 (as shown by the lightest shade in Map 4). This group included many popular holiday destinations – where visitor numbers were drastically lower in 2020 – several of these were island regions that had particularly low case/death rates. The complete list of 24 regions included:
- seven regions from Greece;
- four out of five regions in Denmark (the exception being the capital region);
- four regions in central and northern Germany;
- three out of the four regions in Finland for which data are available (the exception being the capital region);
- three regions from Portugal;
- two of the French outermost regions; and
- Estonia.
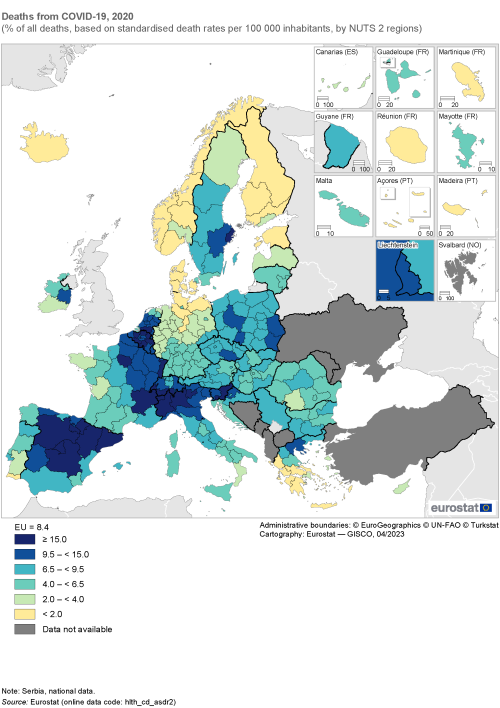
(% of all deaths, based on standardised death rates per 100 000 inhabitants, by NUTS 2 regions)
Source: Eurostat (hlth_cd_asdr2)
In 2020, the Bulgarian region of Yugozapadna i Yuzhna tsentralna had the highest share of deaths from diseases of the circulatory system
Figure 3 consolidates the information presented above, providing information on the four main causes of death within the EU in 2020: diseases of the circulatory system; cancer; COVID-19; diseases of the respiratory system. It shows, for each cause of death, the EU average and information for the five NUTS level 1 regions with the highest and lowest shares of total deaths (based on standardised death rates per 100 000 inhabitants). The order in which the four main causes of death are displayed is rotated for each part of the figure to always start with the specific cause being studied.
- The Bulgarian region of Yugozapadna i Yuzhna tsentralna had the highest share of deaths from diseases of the circulatory system.
- The western French region of Pays de la Loire had the highest share of deaths from cancer.
- The Spanish capital region of Comunidad de Madrid had the highest share of deaths from COVID-19.
- The Portuguese Região Autónoma da Madeira had the highest share of deaths from diseases of the respiratory system.
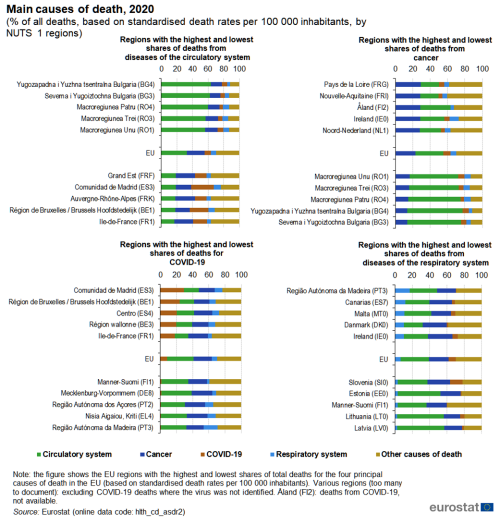
(% of all deaths, based on standardised death rates per 100 000 inhabitants, by NUTS 1 regions)
Source: Eurostat (hlth_cd_asdr2)
Source data for figures and maps
Data sources
EU statistics on income and living conditions (EU-SILC)
Data concerning unmet needs for medical examination come from EU statistics on income and living conditions (EU-SILC). The EU-SILC survey contains a specific module on health, composed of three variables on health status and four variables on unmet needs for health care. The variables on unmet needs for health care target two broad types of services: medical care and dental care.
Data from EU-SILC do not cover the institutionalised population, for example, people living in health and social care institutions. It is therefore likely that, to some degree, the statistics presented are under-estimates, given the health status of people living in such institutions is likely to be worse than that of the population living in private households and their needs greater. By contrast, it should also be noted that various forms of medical care may be readily available in some of these institutions.
Healthcare resources
Until reference year 2020, non-expenditure data on healthcare resources, such as data on the number of hospital beds or the number of medical doctors, were submitted to Eurostat on the basis of a gentlemen’s agreement; in other words, there was no binding legislation for the collection of regional data on these subjects. The information presented is mainly based on national administrative sources and therefore reflects country-specific ways of organising health care and may not be completely comparable; a few countries compile their statistics from surveys. Annual data for healthcare resources are provided in absolute numbers and in population-standardised rates (per 100 000 inhabitants).
Causes of death
Data on causes of death provide information on mortality patterns and form an important element of public health information. This dataset refers to the underlying cause of death, which – according to the World Health Organization (WHO) – is ‘the disease or injury which initiated the train of morbid events leading directly to death, or the circumstances of the accident or violence which produced the fatal injury’.
Since reference year 2011, data for causes of death have been provided based on the Commission Regulation (EC) No 1338/2008 of the European Parliament and of the Council of 16 December 2008 on Community statistics on public health and health and safety at work and the implementing Regulation (EU) No 328/2011 of 5 April 2011 on Community statistics on public health and health and safety at work, as regards statistics on causes of death.
Causes of death statistics are based on information derived from the medical certificate of cause of death. The medical certification of death is an obligation in all EU Member States. The dataset is built upon standards laid out in the WHO’s International statistical classification of diseases and related health problems (ICD). The ICD provides codes, rules and guidelines for mortality coding (as provided on the medical certificate) into ICD codes. The statistics presented in this publication are based on the 10th edition of the ICD (ICD-10). Eurostat’s causes of death statistics are classified according to a European shortlist. Note that ICD-11 has already been adopted and came into effect at the start of 2022.
As the population structure of a region (or country) can strongly influence crude death rates, regional (and national) comparisons are normally made on the basis of standardised death rates, taking into account age effects. The standardised death rate is computed as a weighted average of age-specific mortality rates (where the weighting factor is the age distribution of a standard reference population). As most causes of death vary significantly with people’s age and sex, the use of standardised death rates improves comparability over time and between regions (and countries).
Statistics on causes of death may be analysed by cause of death, sex, five-year age group, residency and country of death. Annual data are provided in absolute numbers, as crude death rates and as standardised death rates. While the majority of regional data published for causes of death is presented in the form of three-year averages (to smooth the impact of outliers), the information presented in this chapter refers to death rates for NUTS level 2 regions of residence for the latest available reference year.
When the COVID-19 pandemic began, the WHO introduced a set of emergency codes in ICD-10 to be used when reporting deaths from COVID-19. Subsequently, Eurostat added new codes to its online databases so that additional information could be presented for the following causes of death:
- COVID-19, virus identified (COVID-19 deaths where the virus was confirmed by laboratory testing);
- COVID-19, virus not identified (COVID-19 deaths where the virus was not identified);
- COVID-19 other (COVID-19 deaths not elsewhere defined).
During the pandemic, there was considerable demand for rapid reporting of the number of COVID-19 cases and deaths. EU Member States made use of new and sometimes innovative data collection methods to fulfil these demands, often with daily reporting for headline indicators. The initial reporting of COVID-19 deaths was generally based on the deceased having tested positive for COVID-19 and/or clinical signs pointing towards COVID-19 (whether or not the actual cause of death was COVID-19); these deaths may be termed as dying ‘with’ COVID-19.
By contrast, causes of death data are based on the results of death certificates established by medical experts. It is important to note that a death certificate may establish another cause of death despite the deceased dying ‘with’ COVID-19. Furthermore, the opposite situation is possible: namely, that a death certificate confirms somebody as dying ‘from’ COVID-19, while this was not picked up during the rapid reporting.
Indicator definitions
Self-reported unmet needs for medical examination
Self-reported unmet needs concern a person’s own assessment of whether they needed medical examination or treatment (dental care excluded), but did not have it or did not seek it. This indicator is part of the EU’s sustainable development goals (SDGs) indicator set to monitor progress for goal 1 (no poverty) and goal 3 (good health and well-being); it is also included as a headline indicator in the social scoreboard for the European Pillar of Social Rights, as part of the dimension covering social protection and inclusion.
Within EU-SILC the main reasons for unmet needs for medical care are:
- financial reasons – could not afford (too expensive);
- waiting list;
- did not have time – because of work, care for children or for others;
- too far to travel – no means of transportation;
- fear of doctors, hospitals, examination or treatment;
- wanted to wait and see if problem got better on its own;
- did not know any good medical doctor;
- other reasons.
Within this publication, the indicator on unmet needs for medical care is defined as the share of the population aged 16 years or over reporting unmet needs due to one of the following reasons: financial reasons, waiting list and too far to travel.
As the indicator is derived from self-reported data it is, to a certain extent, affected by respondents’ subjective perception as well as by their social and cultural background. Another factor that may play a role is the different organisation of healthcare services, be that nationally, regionally or locally. As such, caution is required when comparing the magnitude of inequalities across different regions of the EU.
Available beds in hospitals
Hospital bed numbers provide information on healthcare capacities, in this case the maximum number of patients who can be admitted to hospitals. The total number of hospital beds includes all hospital beds which are regularly maintained and staffed and immediately available for the care of admitted patients. This count is equal to the sum of the following four categories: i) curative (acute) care beds; ii) rehabilitative care beds; iii) long-term care beds; and iv) other hospital beds.
Medical doctors
A medical doctor (or physician) has a degree in medicine. Practising physicians are those who have successfully completed studies in medicine at university level, have a license to practise and who are working to provide services to individual patients (conducting medical examinations, making diagnoses, performing operations). Excluded from the count of practising physicians are students who have not yet graduated, unemployed physicians, retired physicians or physicians working abroad, as well as physicians working in administration, research or other posts that do not involve direct contact with patients.
Eurostat gives preference to the concept of practising physicians, although some data may be presented for professionally active physicians (a practising physician or any other physician for whom a medical education is a prerequisite for the execution of their job), or for licensed physicians (a broader concept, encompassing the other two types of physician as well as other registered physicians who are entitled to practise as healthcare professionals but are unemployed, retired, and so on).
Deaths
A death, according to the United Nations definition, is the ‘permanent disappearance of all vital functions without possibility of resuscitation at any time after a live birth has taken place’; this definition therefore excludes foetal deaths (stillbirths).
Causes of death
The underlying cause of death is defined as the disease or injury which started the train (sequence) of morbid (disease-related) events which led directly to death, or the circumstances of the accident or violence which produced the fatal injury. Although international definitions are harmonised, the resulting statistics on causes of death may not be fully comparable, as classifications may vary when the cause of death is multiple or difficult to evaluate, and because of different notification procedures.
Within this publication, data are presented for the main cause of death (according to ICD-10):
- all causes of death (as defined by ICD-10 A–R and V–Y, as well as U07.1 and U07.2);
- cancer (malignant neoplasms) (ICD-10 C);
- diseases of the circulatory system (ICD-10 I);
- diseases of the respiratory system (ICD-10 J);
- COVID-19, computed as the sum of
- COVID-19, virus identified (ICD-10 U07.1) and
- COVID-19, virus not identified (ICD-10 U07.2);
- other causes of death.
Context
Health systems across the EU are organised, financed and managed in very different ways and the responsibility for the delivery of health services largely resides with individual EU Member States. Policy developments for the EU are based on an open method of coordination, a voluntary process that seeks to agree common objectives that help national authorities cooperate. The COVID-19 crisis underlined the issue of cooperation on health matters and focused attention on the ability of the EU to respond to shocks and health crises.
The EU’s main policy objectives within this domain include: improving access to health care for all through effective, accessible and resilient health systems; fostering health coverage as a way of reducing inequalities and tackling social exclusion; promoting health information and education, healthier lifestyles and individual well-being; investing in health through disease prevention; improving safety standards for patients, pharmaceuticals/drugs and medical devices; guaranteeing/recognising prescriptions in other EU Member States.
Within the European Commission, policy actions for the health domain generally fall under the responsibility of the Directorate-General for Health and Food Safety and the Directorate-General for Employment, Social Affairs and Inclusion. Such actions are focused on protecting people from health threats and disease, providing consumer protection (food safety issues), promoting lifestyle choices (fitness and healthy eating), as well as workplace safety.
EU4Health
Regulation (EU) 2021/522 of the European Parliament and of the Council of 24 March 2021 establishing a Programme for the Union’s action in the field of health (‘EU4health programme’) for the period 2021–2027 provides funding to EU Member States, health organisations and non-governmental organisations (NGOs) and is designed, among other objectives, to boost the EU’s preparedness for major cross-border health threats by creating:
- reserves of medical supplies for crises;
- a reserve of healthcare staff and experts that can be mobilised to respond to crises across the EU;
- increased surveillance of health threats.
EU4Health has a budget of €5.8 billion for the period 2021–2027 and aims to support a longer-term vision of improving health outcomes via efficient and inclusive health systems, through 10 specific objectives that are classified under four general goals:
- improve and foster health in the EU
- disease prevention and health promotion
- international health initiatives and cooperation
- tackle cross-border health threats
- prevention, preparedness and response to cross-border health threats
- complementing national stockpiling of essential crisis-relevant products
- establishing a reserve of medical, healthcare and support staff
- improve medicinal products, medical devices and crisis-relevant products
- making medicinal products, medical devices and crisis-relevant products available and affordable
- strengthen health systems, their resilience and resource efficiency
- strengthening health data, digital tools and services, digital transformation of health care
- improving access to health care
- developing and implementing EU health legislation and evidence-based decision making
- integrated work among national health systems
Response to the COVID-19 crisis
The COVID-19 crisis resulted in severe human suffering and a considerable loss of life. The pandemic highlighted the need to prioritise public health and to strengthen healthcare systems across the EU (and further afield). The European Commission took a series of coordinated actions to support containment of COVID-19, while also supporting national health systems and countering the socioeconomic impact of the pandemic; for more information, see here .
In response to the pandemic, the European Commission took a range of actions, that included:
- supporting research and development in vaccines, and implementing a vaccines strategy;
- launching the European Health Emergency preparedness and Response Authority (HERA), which aims to prevent, detect, and rapidly respond to health emergencies;
- participating in the COVAX initiative, a facility for fair and universal access to COVID-19 vaccines across the world;
- laying the foundation for establishing a European Health Union, based on a stronger health security framework, and more robust EU agencies.
As part of an initiative to build a stronger European Health Union, Regulation (EU) 2022/2371 of the European Parliament and of the Council of 23 November 2022 on serious cross-border threats to health aims to ensure that the EU will have:
- a robust preparedness planning and a more integrated surveillance system;
- a better capacity for accurate risk assessment and targeted response;
- solid mechanisms for joint procurement of medical countermeasures;
- the possibility to adopt common measures at the EU level to address future cross-border health threats.
Regulation (EC) No 851/2004 of the European Parliament and of the Council of 21 April 2004 establishing a European Centre for disease prevention and control was amended in November 2022 by Regulation (EU) 2022/2370 which provides for a stronger and more robust European Centre for Disease Prevention and Control (ECDC). As such, the ECDC will not only issue recommendations to EU Member States regarding health threats preparedness but also host a new excellence network of EU reference laboratories and establish an EU Health Task Force for rapid health interventions in the event of a major outbreak.
Beating Cancer Plan
EU4Health will also invest in urgent health priorities, including Europe’s Beating Cancer Plan. The President of the European Commission highlighted a ‘European plan to fight cancer, to support Member States in improving cancer control and care’ among a number of political guidelines for the period 2019–2024.
Europe’s Beating Cancer Plan was presented by the European Commission in February 2021. It is built around 10 flagship initiatives and several supporting actions and is designed to support the work of EU Member States in preventing cancer and ensuring a high quality of life for cancer patients, survivors, their families and carers. The plan aims to tackle the entire disease pathway of cancer. It is structured around four key action areas: i) prevention; ii) early detection; iii) diagnosis and treatment; and iv) quality of life of cancer patients and survivors.
European Health Insurance Card
The European health insurance card (EHIC) allows travellers from one EU Member State to obtain medical treatment if they fall ill whilst temporarily visiting another Member State, EFTA country or the United Kingdom. The EU has also introduced legislation on the application of patients’ rights in cross-border health care (Directive 2011/24/EU), which allows patients to travel abroad for treatment when this is either necessary (specialist treatment is only available abroad) or easier (if the nearest hospital is just across a border).
Horizon Europe
The research framework programme – Horizon Europe – funds vital research in health. This includes initiatives to scale-up the research effort for challenges such as those experienced during the COVID-19 pandemic, for example, the extension of clinical trials, innovative protective measures, virology, vaccines, treatments and diagnostics, and the translation of research findings into public health policy measures.
Research funding through the Horizon programme incorporates research and innovation missions to increase the effectiveness of funding by pursuing clearly defined targets. Five missions have been identified, one of which is the cancer mission. By joining efforts across the EU, the mission on cancer, together with Europe’s Beating Cancer Plan, aims to provide a better understanding of cancer, support earlier diagnosis, optimise treatment and improve cancer patients’ quality of life during and beyond their cancer treatment.
Health agencies in the EU
The European Centre for Disease Prevention and Control (ECDC) in Frösunda (Sweden) is an EU agency that provides surveillance of emerging health threats so that the EU can respond more rapidly. It pools knowledge on current and emerging threats and works with national counterparts to develop disease monitoring across the EU. The agency continues to publish a weekly overview of the situation concerning COVID-19 on its website.
The European Medicines Agency (EMA), which is located in Amsterdam (the Netherlands), helps national regulators by coordinating scientific assessments concerning the quality, safety and efficacy of medicines used across the EU. All medicines in the EU must be approved nationally or by the EU before being placed on the market. The safety of pharmaceuticals that are sold in the EU is monitored throughout a product’s life cycle: individual products may be banned or their sales/marketing suspended.
Direct access to
- Circulatory diseases killed more than COVID-19 in 2020
- How healthy did EU citizens feel in 2021?
- How many people live 15 minutes away from a hospital?
- Looking for a local doctor?
- Older people report better health status in cities
- 22 % of people in the EU have high blood pressure
- 66 % of women in the EU aged 50–69 got a mammogram
Online publications
- Health (t_hlth), see:
- Health status (t_hlth_state)
- Health care (t_hlth_care)
- Causes of death (t_hlth_cdeath)
- Regional health statistics (t_reg_hlth)
- All causes of death by NUTS 2 regions (tgs00057)
- Death due to cancer by NUTS 2 regions (tgs00058)
- Death due to ischaemic heart diseases by NUTS 2 regions (tgs00059)
- Physicians or doctors by NUTS 2 regions (tgs00062)
- Available beds in hospitals by NUTS 2 regions (tgs00064)
- Health, see:
- Health care (hlth_care)
- Health care resources (hlth_res)
- Heath care staff (hlth_staff)
- Physicians by NUTS 2 region (hlth_rs_physreg)
- Heath care staff (hlth_staff)
- Health care facilities (hlth_facil)
- Hospital beds by NUTS 2 regions (hlth_rs_bdsrg)
- Unmet needs for health care (hlth_unm)
- Self-reported unmet needs for medical examination by main reason declared and NUTS 2 regions (hlth_silc_08_r)
- Health care resources (hlth_res)
- Causes of death (hlth_cdeath)]
- General mortality (hlth_cd_gmor)
- Causes of death - standardised death rate by NUTS 2 region of residence (hlth_cd_asdr2)
- General mortality (hlth_cd_gmor)
- Regional health statistics (reg_hlth)
- Causes of death (reg_hlth_cdeath)
- Health care: resources and patients (non-expenditure data) (reg_hlth_care)
Manuals and further methodological information
- Methodological manual on territorial typologies – 2018 edition
- Statistical regions in the European Union and partner countries – NUTS and statistical regions 2021 – 2020 edition
Metadata
- Causes of death (SIMS metadata file – hlth_cdeath_sims)
- Healthcare resources (ESMS metadata file – hlth_res_esms)
- Health variables of EU-SILC (ESMS metadata file – hlth_silc_01_esms)
- European Commission – Coronavirus response
- European Commission – Directorate General for Health and Food Safety – Public health
- European Commission – Directorate General for Regional and Urban Policy – Cohesion policy and health
- European Commission – EU4Health 2021–2027 – a vision for a healthier European Union
- European Commission – Europe’s Beating Cancer Plan
- Health at a Glance: Europe (OECD)
- World Health Organization (WHO)
Maps can be explored interactively using Eurostat’s statistical atlas (see user manual).
This article forms part of Eurostat’s annual flagship publication, the Eurostat regional yearbook.