Greenhouse gas emission statistics - air emissions accounts
Data extracted in December 2023.
Planned article update: December 2024.
Highlights
This article is about emissions of greenhouse gases (GHG emissions) classified by emitting economic activities. Eurostat records and publishes these in annual air emissions accounts (AEA), one of the modules in the European environmental economic accounts (for which the legal basis is Regulation (EU) No 691/2011). AEA are suited for integrated environmental-economic analyses such as calculating emission intensities or 'footprints'.
In addition, Eurostat disseminates emissions from the EU and countries territories ('greenhouse gas inventories’). Territorial data are used to follow the development of emissions in relation to climate actions of the European Union and of the members of the United Nations according to the guidelines developed by the UN panel on climate change (IPCC). These are the official data to measure emissions in each country. Furthermore, Eurostat estimates and disseminates 'footprints' which are GHG emissions classified by final products that are demanded by households or government, or that are invested in or exported.
This article analyses the emissions of greenhouse gases (GHGs) in the European Union (EU) by emitting economic activities (industries and households). The GHGs comprise carbon dioxide (CO2), nitrous oxide (N2O), methane (CH4) and fluorinated gases (hydrofluorocarbons (HFC), perfluorocarbons (PFC), sulphur hexafluoride (SF6) and natrium trifluoride (NF3).
Full article
Greenhouse gas emissions
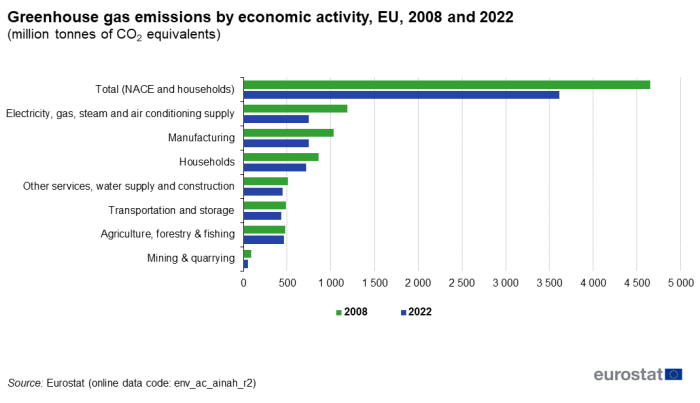
In 2022, GHG emissions generated by industries and households in the EU stood at 3.6 billion tonnes of CO2 equivalents.
Analysis by economic activity
Annual air emissions accounts offer a detailed analysis by 64 emitting industries (classified by NACE) as well as households as defined and classified within national accounts. For the purpose of this article these 64 industries have been further aggregated into six groupings.
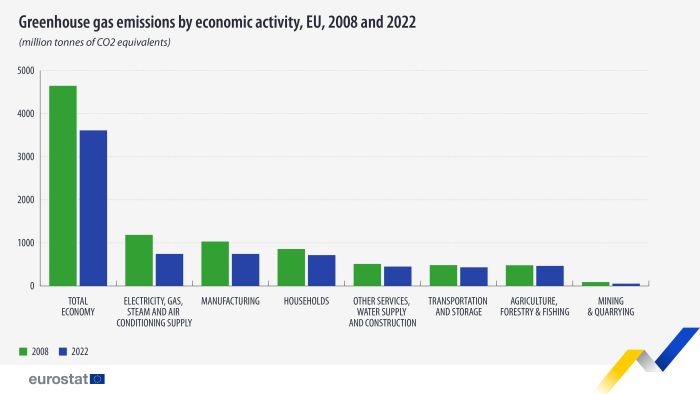
Between 2008 and 2022 the level of greenhouse gas emissions from the supply of electricity, gas, steam and air conditioning fell by 443 million tonnes of CO2 equivalents, a fall of 37 % in relative terms. In absolute terms this was the largest decrease recorded among the activity groupings studied. This activity grouping is also among the largest emitters of greenhouse gases. In 2022, it contributed 21 % to the total greenhouse gases emitted by EU industries and households, along with manufacturing, which also had 21 % share in the total. The largest relative drop was observed in mining and quarrying with 40 %. For the same period, the second largest absolute drop in greenhouse gas emissions occurred in manufacturing (-288 million tonnes of CO2 equivalents). Households in the EU reduced their emissions by 141 million tonnes of CO2 equivalents (a reduction of 16 %) between 2008 and 2022 (Figure 1).

(million tonnes of CO2 equivalents)
Source: Eurostat (env_ac_ainah_r2)
In most activities carbon dioxide was the most emitted greenhouse gas. Agriculture, forestry and fishing and mining and quarrying were the only activities where emissions of methane and nitrous oxide (expressed in CO2 equivalents) were greater than those of carbon dioxide (Figure 2).

(thousand tonnes of CO2 equivalents)
Source: Eurostat (env_ac_ainah_r2)
Analysis across EU Member States
Among the EU Member States, the GHGs emitted by the various producers and households varied considerably (see Table 1). These differences are, in part, due to different economic structures and different mixes of renewable and non-renewable energy sources. In eight EU Member States manufacturing was the main emitter of GHGs in 2022, and in another eight Member States businesses supplying electricity, gas, steam and air conditioning were the main emitters. Households and transportation and storage activities were the main source of GHGs in five Member States.

(thousand tonnes of CO2 equivalents)
Source: Eurostat (env_ac_ainah_r2)
Comparing greenhouse gas emissions with gross value added
The breakdown of production activities into 64 classes is the same as for economic statistics (national accounts), therefore enabling integrated analyses. Figure 3 compares emissions of ozone precursors with the gross value added (GVA) for the 64 production activities (NACE classification).
Figure 3 shows that the top five emitters account for about 60 % of greenhouse gas emissions of the 64 production activities, while these top five production activities only contribute to 6 % of the gross domestic product (GDP). These five production activities are: electricity, gas, steam and air conditioning supply (NACE D), crop and animal production, hunting and related service activities (NACE A01), manufacture of other non-metallic mineral products (NACE C23), manufacture of basic metals (NACE C24) and manufacture of chemicals and chemical products (NACE C20). The GDP is the sum of gross value added of the 64 production activities plus net taxes on products.

Source: Eurostat (env_ac_ainah_r2) and (naio_10_cp1610)
Source data for tables and graphs
Data sources
Eurostat's air emissions accounts (AEA) are legally based on Regulation (EU) No 691/2011 on European environmental economic accounts.
Annual data are transmitted by the EU Member States, as well as the European Free Trade Association (EFTA) countries and some candidate countries.
Each greenhouse gas has a different capacity to cause global warming, depending on its radiative properties, molecular weight and the length of time it remains in the atmosphere. The global warming potential (GWP) of each gas is defined in relation to a given weight of carbon dioxide for a set time period (for the purpose of the Kyoto Protocol a period of 100 years). GWPs are used to convert emissions of greenhouse gases to a relative measure (known as carbon dioxide equivalents: CO2 equivalents). The weighting factors currently used are the following: carbon dioxide = 1, methane = 28, nitrous oxide = 265 and sulphur hexafluoride = 23 500. Hydrofluorocarbons and perfluorocarbons comprise a large number of different gases that have different GWPs.
Eurostat calculates early estimates for greenhouse gases in air emissions accounts (timeliness: T+12 months). The developed methodology is based on the Approximated estimates for greenhouse gas emissions published by the European Environment Agency. In Figures 1, 2, 3 and Table 1 of this article, year 2022 data are the early estimates calculated by Eurostat.
In AEA, the emissions data are organised by economic activity, using the NACE classification. This arrangement makes it possible to have an integrated environmental-economic analysis to supplement national accounts. The scope encompasses production by all businesses resident in the country, including those operating ships, aircraft and other transportation equipment in other countries.
Air emissions accounts also include households as consumers. Their emissions are accounted for whenever household consumption is directly responsible for environmental pressures. For example, emissions from a privately owned car are accounted under households, whereas cars owned by transport businesses (such as taxis) are accounted under transportation and storage.
The following activity groupings are used in this article:
- agriculture, forestry and fishing — NACE Rev. 2 Section A;
- mining and quarrying — NACE Rev. 2 Section B;
- manufacturing — NACE Rev. 2 Section C;
- electricity, gas, steam and air conditioning supply — NACE Rev. 2 Section D;
- transportation and storage — NACE Rev. 2 Section H;
- other services, water supply and construction — NACE Rev. 2 Sections E to G and I to U, in other words all remaining economic activities as defined in NACE;
- households — households as consumers.
Three perspectives of greenhouse gas emission statistics
Eurostat presents three perspectives of greenhouse gas (GHG) emissions statistics:
| Perspective | Statistical framework | Purpose | Related data set | Related SE article |
|---|---|---|---|---|
| 1. GHG emissions classified by economic activities | Air Emissions Accounts (AEA) by Eurostat | tailored for integrated environmental-economic analyses | env_air_aa | this article |
| 2. GHG emissions classified by technical processes | GHG emission inventories by UN | official international reporting framework for international climate policies (UNFCCC, EU MMR) | env_air_gge | link |
| 3. 'footprints' = GHG emissions classified by final use of products | Modelling results published by Eurostat | one particular analytical application of AEA | env_ac_io10 | link |
Emissions accounts versus emission inventories
The main differences between air emissions accounts (AEA) and GHG emission inventories are:
| Air emissions accounts – greenhouse gases (residence principle) | Greenhouse gas emission inventories (territory principle) |
|---|---|
| Emissions are assigned to the country where the economic operator causing the emission is resident. | Emissions are assigned to the country where the emission takes place |
| Emissions are classified by economic activity, following the NACE classification of the system of national accounts. | Emissions are assigned to processes classified according to their technical nature (e.g. combustion in power plants, solvent use). |
| Emissions from international navigation and aviation are assigned to the countries where the operator of the ship/aircraft is resident, regardless of where the emission takes place. | Emissions from international navigation and aviation are assigned to the countries where the associated fuel is bunkered, irrespective of the operator's place of residence. |
Note: National and EU totals differ between the two approaches, as different boundaries apply. GHG inventories include international aviation and maritime transport (international bunker fuels) as memorandum items, which mean that they are excluded from national totals reported. However, they are included in air emissions accounts totals. Therefore total emissions reported in GHG inventory databases can differ significantly from the total reported in air emissions accounts for countries with a large international aircraft and/or shipping fleet. AEA reconciles totals with emission inventories through 'bridging items'.
Context
The need to supplement information on the economy with environmental indicators was recognised in a European Commission Communication titled 'GDP and beyond' (COM(2009) 433). Furthermore, similar recommendations were made within the Report by the Commission on the Measurement of Economic Performance and Social Progress, released by the Commission on the Measurement of Economic Performance and Social Progress. Such recommendations support the analysis of statistics on human well-being to supplement economic indicators such as gross domestic product, for example by including physical indicators related to the environment.
Air emissions accounts measure the interplay between the economy and the environment with respect to air emissions, in order to assess whether current production and consumption activities are on a sustainable path of development. Measuring sustainable development is a complex undertaking as it has to incorporate economic, social and environmental indicators. The data obtained from air emissions accounts may subsequently feed into political decision-making, underpinning policies that target both continued economic growth and sustainable development, for example, the European Commission's latest initiative, the European Green Deal.
Direct access to
- Quarterly greenhouse gas emissions in the EU
- Air pollution statistics - air emissions accounts
- Greenhouse gas emission statistics - emission inventories
- Greenhouse gas emission statistics - carbon footprints
- Environmental accounts - establishing the links between the environment and the economy
- National accounts and GDP
- Air emissions accounts (env_air_aa)
- env_ac_ainah_r2
- env_ac_aibrid_r2
- env_ac_aeint_r2
- env_ac_aigg_q
