GDP per capita, consumption per capita and price level indices
Data from 14 December 2023
Planned article update: 19 June 2024
Highlights
Volume of indices of GDP per capita, 2022
This article presents the most recent analysis of purchasing power parities and related economic indicators (gross domestic product (GDP) per capita, level of actual individual consumption (AIC) per capita, countries' price level indices) in the European Union (EU) and the countries mentioned below for the years 2020, 2021 and 2022, focusing primarily on the latest reference year. The countries included in the comparison are the 27 EU Member States, three EFTA countries (Iceland, Norway and Switzerland) and six EU candidate countries (Albania, Bosnia and Herzegovina, Montenegro, North Macedonia, Serbia and Türkiye).
Full article
Overview
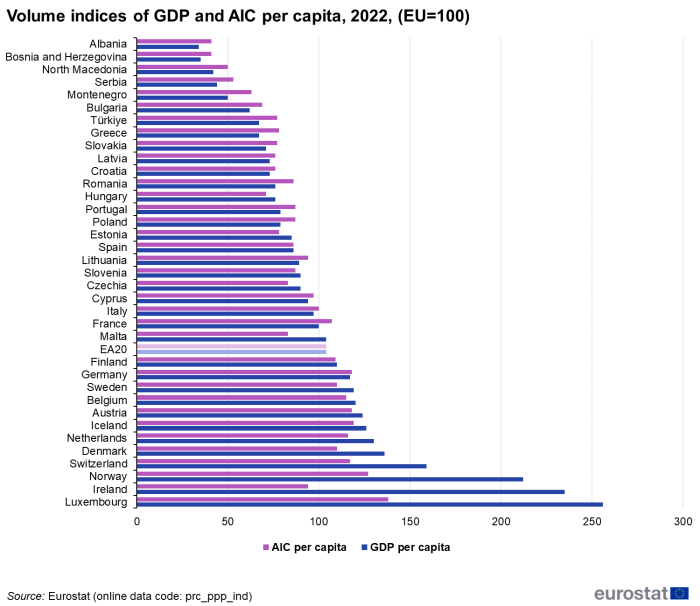
In 2022, Luxembourg and Ireland recorded the highest level of GDP per capita in the EU, at 156 % and 135 % above the EU average. Bulgaria was the EU Member State with the lowest GDP per capita, at 38 % below the EU average. Levels of actual individual consumption were somewhat more homogeneous, but still showed significant differences across Europe. Luxembourg recorded the highest level of AIC per capita in the EU, at 38 % above the EU average, as well as the highest price level, at 53 % above the EU average.
Relative volumes of GDP per capita
In international comparisons of national accounts data, such as GDP per capita, it is desirable not only to express the figures in a common currency, but also to adjust for differences in price levels. Failing to do so would result in an overestimation of GDP levels for countries with high price levels, relative to countries with low price levels.
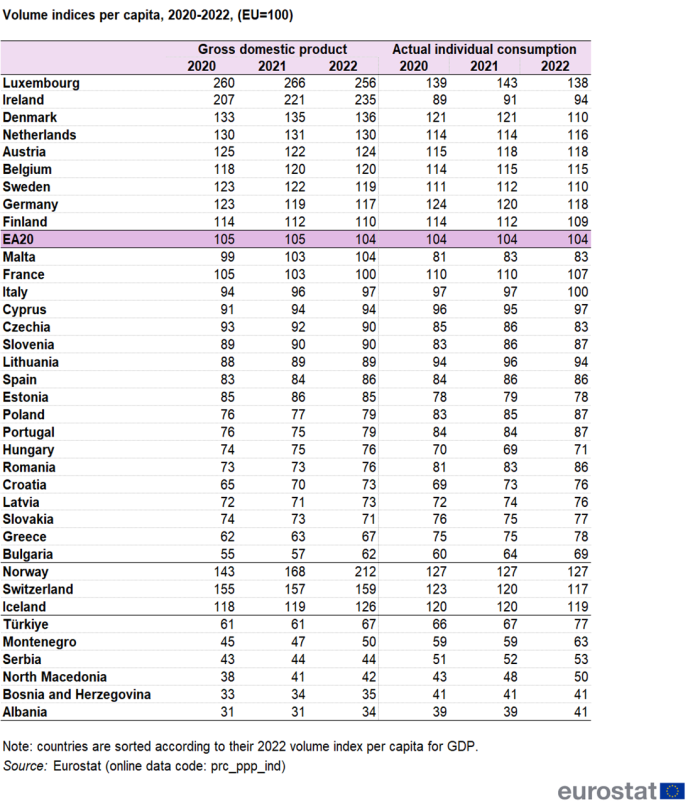
Countries' volume indices of GDP per capita are shown in the left-side of Table 1. The dispersion in GDP per capita across the EU Member States is quite remarkable. Luxembourg has by far the highest GDP per capita among all the 36 countries included in this comparison, being well above the EU average (by more than two and a half). This is partly explained by the fact that a large number of foreign residents are employed in the country and thus contribute to its GDP, while they are not part of Luxembourg's resident population. Their consumption expenditure is recorded in the national accounts of their country of residence. The high level of GDP per capita in Ireland can be partly explained by the presence of large multinational companies holding intellectual property. The associated contract manufacturing with these assets contribute to GDP, while a large part of the income earned from this production is returned to the companies' ultimate owners abroad.
Ireland comes out second among the EU Member States, at 135 % above the EU average, followed by Denmark, the Netherlands, Austria and Belgium, each with a GDP per capita more than 20 % above the average. The EFTA countries Norway, Switzerland and Iceland have a level of GDP per capita of 112 %, 59 % and 26 % above the EU average, respectively.
Sweden, Germany, Finland and Malta are the other EU Member States with a GDP per capita above the EU average, followed by France with a GDP per capita equal to the EU average. Italy, Cyprus, Czechia and Slovenia have a level of GDP per capita of less than 10 % below the EU average. Lithuania, Spain and Estonia have a GDP per capita between 10 % and 20 % below the EU average. The GDP per capita of Poland, Portugal, Hungary, Romania, Croatia, Latvia and Slovakia is less than 30 % below the average. Greece, the candidate country Türkiye, and Bulgaria have a GDP per capita of less than 40 % below the average. The candidate country Montenegro is placed at 50 % below the EU average, followed by the candidate countries Serbia, North Macedonia, Bosnia and Herzegovina, and Albania.
Relative volumes of consumption per capita
While GDP is mainly an indicator of the level of economic activity, actual individual consumption (AIC) is an alternative indicator better adapted to describe the material welfare of households.
Countries' volume indices of AIC per capita can be found in the right-side of Table 1. Generally, levels of AIC per capita are more homogeneous than GDP but still there are substantial differences across the EU Member States.
Luxembourg has the highest level of AIC per capita among all 36 countries included in this comparison at 38 % above the EU average. It is followed by the EFTA country Norway, having an AIC per capita of 27 % above the EU average. While Luxembourg and Ireland are outstanding among EU Member States in terms of GDP, this is less so for AIC. As mentioned in the previous section, one reason for this is that cross-border workers contribute to GDP in Luxembourg while their consumption expenditure is recorded in the national accounts of the country of their residence. Ireland, having the second highest level of GDP per capita in the EU, has an AIC per capita at 6 % below the EU average.
Price levels in Europe
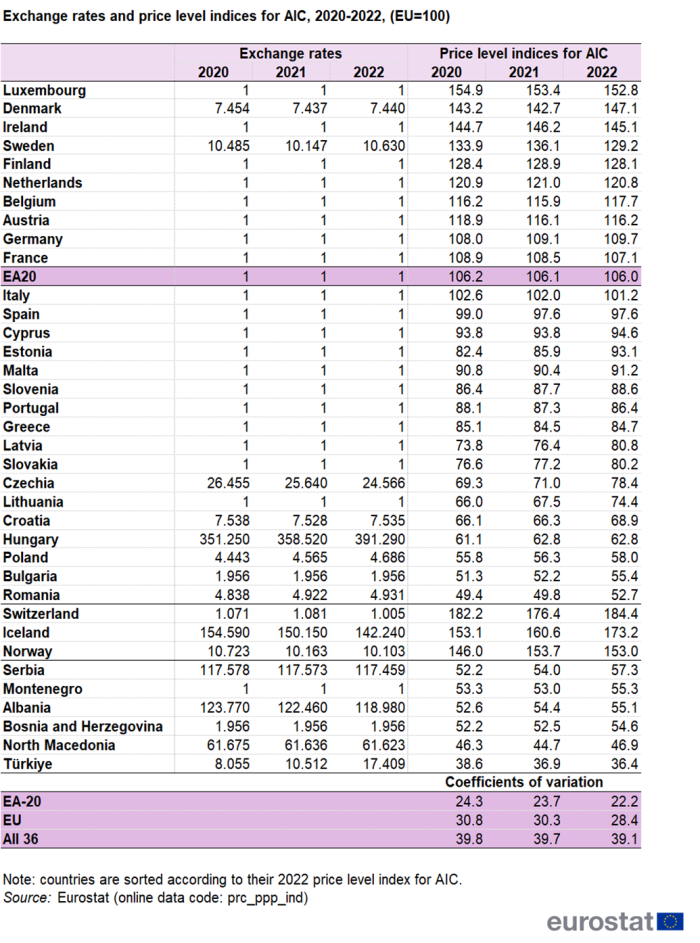
Table 2 shows countries' price levels to the right, with the EU average at 100, for AIC only. It also shows the exchange rates applied in the calculation of the price level indices (see methodology described in Data sources). In the following section, the discussion is restricted to the price levels of AIC, since this is closer to the concept of price levels that people are familiar with than a price level indicator based on GDP.

Source: Eurostat (prc_ppp_ind)
Luxembourg has the highest price levels among the Member States, 53 % above the EU average. However, the EFTA countries Switzerland, Iceland and Norway have higher price levels, at 84 %, 73 % and 53 % above the EU average, respectively. The EU Member States Denmark, Ireland, Sweden, Finland and the Netherlands have price levels more than 20 % above the EU average. Belgium, Austria, Germany, France and Italy are the other EU Member States with price levels above the EU average.
Spain, Cyprus, Estonia and Malta have a price level less than 10 % below the EU average, followed by Slovenia, Portugal, Greece, Latvia and Slovakia at less than 20 % below the EU average. Czechia and Lithuania have a price level situated less than 30 % below the EU average, followed by Croatia and Hungary with price levels less than 40 % below that average. Poland, followed by the candidate country Serbia, EU Member State Bulgaria, candidate countries Montenegro, Albania, Bosnia and Herzegovina and EU Member State Romania have price levels between 40 % and 50 % below the EU average. The candidate countries North Macedonia and Türkiye have price levels at 53 % and 64 % below the EU average, respectively.
Exchange rates are crucial in determining price levels, and exchange rate movements consequently often have a big impact on the development of price levels over time. In fact, several of the major price level changes observed between 2020 and 2022 can be at least partly explained by fluctuations of a country's currency against the euro. In 2021 and 2022, the national currency of Türkiye showed a large depreciation against the euro. Czechia shows the largest increase in price levels between 2020 and 2022.
The last three rows in Table 2 show the coefficients of variation of the price levels for three groups of countries: the euro area (EA-20), the EU Member States (EU) and the entire group of 36 countries (all 36). A time series of these coefficients can be interpreted as a rudimentary price convergence indicator.
These figures show that, firstly, and unsurprisingly, the price dispersion is much less pronounced in the euro area than in the EU as a whole and in the 36-country group, which can be partially impacted by the volatility of exchange rates. Secondly, over this three-year period, price levels are slowly converging for all 36 countries.
Data sources
The data in this article are produced by the Eurostat-OECD Purchasing power parities programme. The full methodology used in the programme is described in the Eurostat-OECD Methodological manual on purchasing power parities.
Purchasing power parities (PPPs) are currency conversion rates that are applied in order to convert economic indicators from national currency to an artificial common currency, called the Purchasing Power Standard (PPS), which equalizes the purchasing power of different national currencies and enables meaningful volume comparisons between countries. For example, if the GDP or AIC per capita expressed in the national currency of each country participating in the comparison is divided by its PPP, the resulting figures neutralise the effect of differences in price levels and thus indicate the real volume of GDP or AIC at a common price level. When divided by the nominal exchange rate of a given year, the PPP provides an estimate of the price level of a given country relative to, for instance, the EU total.
PPPs are established on an annual basis. According to the regular publication calendar, PPPs are released as preliminary estimates 12 months after the end of the reference year and revised after 24 months, while the final results are released 36 months after the end of the reference year. In addition, an early estimate of PPPs, partly based on projections, is published 6 months after the end of the reference year. This regular PPP revision and release calendar is in line with the data delivery timetable for national accounts data as given in the ESA 2010 Regulation 549/2013 of 21 May 2013. Thus, the 2020 results presented in this publication should be regarded as final, while the 2021 and 2022 results are still preliminary.
In their simplest form PPPs are nothing more than price relatives that show the ratio of the prices in national currencies for the same good or service in different countries. For example, if the price of a hamburger in Sweden is 28.60 Swedish krona and in Italy it is €2.76, the PPP for hamburgers between Sweden and Italy is 28.60 krona to €2.76 or 10.36 krona to the euro. In other words, for every euro spent on hamburgers in Italy, 10.36 krona would have to be spent in Sweden in order to obtain the same quantity and quality – or volume – of hamburgers.
The indices of relative volumes of GDP and AIC per capita published in this article have been adjusted for price level differences, and are expressed in relation to the European Union average (EU=100). Thus, for instance, if a country's volume index is below 100, that country's level of GDP (or AIC) per capita is lower than for the EU as a whole. The price level adjustment factors, referred to as purchasing power parities, can also be used in comparison of countries' price levels.
Price level indices (PLIs) as presented in this publication are the ratios of PPPs to exchange rates. They provide a measure of the differences in price levels between countries by indicating for a given product group the number of units of common currency needed to buy the same volume of the product group or aggregate in each country. They are presented relative to the European Union average: if the price level index is higher than 100, the country concerned is relatively expensive compared with the EU average and vice versa. The EU average is calculated as the weighted average of the national PLIs, weighted by the expenditures corrected for price level differences.
Volume and price level indices are not intended to rank countries strictly. In fact, they only provide an indication of the order of magnitude of the volume or price level in one country in relation to others, particularly when countries are clustered around a very narrow range of outcomes. The level of uncertainty associated with the basic price and national accounts data, and the methods used for compiling PPPs imply that differences between countries that have indices within a close range should not be over-interpreted.
In national accounts, Household Final Consumption Expenditure (HFCE) denotes expenditure on goods and services that are purchased and paid for by households. Actual Individual Consumption (AIC), on the other hand, consists of goods and services actually consumed by individuals, irrespective of whether these goods and services are purchased and paid for by households, by government, or by non-profit organisations. In international volume comparisons, AIC is often seen as the preferable measure, since it is not influenced by the fact that the organisation of certain important services consumed by households, like health and education services differs a lot across countries. For example, if dental services are paid for by the government in one country, and by households in another, an international comparison based on HFCE would not compare like with like, whereas one based on AIC would.
Context
GDP per capita volume indices (on a regional basis - see Economy at regional level) are used in the allocation of Structural Funds within the EU. Regions where real GDP per capita is less than 75 % of the EU average (taken over a period of three years) are eligible for support from the Structural Funds.
Eurostat is co-operating closely with other international institutions in the production and dissemination of PPPs. It co-operates with the OECD to produce PPP statistics for the OECD countries and with the World Bank and the International Monetary Fund (IMF) to produce global PPP data. See external links below.
Direct access to
- Comparative price levels (tec00120)
- Price and volume convergence between EU Member States (tec00121)
- GDP per capita in PPS (tec00114)
- Purchasing power parities (PPPs), price level indices and real expenditures for ESA2010 aggregates (prc_ppp_ind)
- Convergence indicators (prc_ppp_conv)
- Eurostat-OECD Methodological manual on purchasing power parities
- Purchasing power parities (ESMS metadata file — prc_ppp_esms)
- Regulation (EC) No 1445/2007 of 11 December 2007 establishing common rules for the provision of basic information on Purchasing Power Parities and for their calculation and dissemination
- Summaries of EU Legislation: Purchasing power parities
- Regulation (EU) No 549/2013 (ESA 2010 Regulation) of 21 May 2013 on the European system of national and regional accounts in the European Union
- Summaries of EU Legislation: European Union system of national and regional accounts

