Freight transport statistics - modal split
Data extracted in March 2024.
Planned article update: 16 April 2025.
Highlights
In 2022, maritime transport accounted for more than two-thirds (67.8 %) of freight transport performance in the EU, followed by road transport with one-quarter (24.9 %).
Maritime and road transport represented 92.7 % of total freight transport performance in the EU in 2022. Rail transport represented 5.5 %, inland waterway 1.6 % and air 0.2 %.
Among the EU countries, Lithuania had the highest share of rail transport in total freight transport in 2022, with 37.2 %.
Modal split of freight transport, EU, 2012-2022
This article analyses the relative importance of five main transport modes (maritime, road, rail, inland waterway and air) in the total freight transport in the European Union (EU). It explains how the modal split between the different transport modes is calculated and shows the importance of each mode for freight transport. It also presents the evolution of the modal split between these transport modes over time.
Full article
Modal split of freight transport in the EU
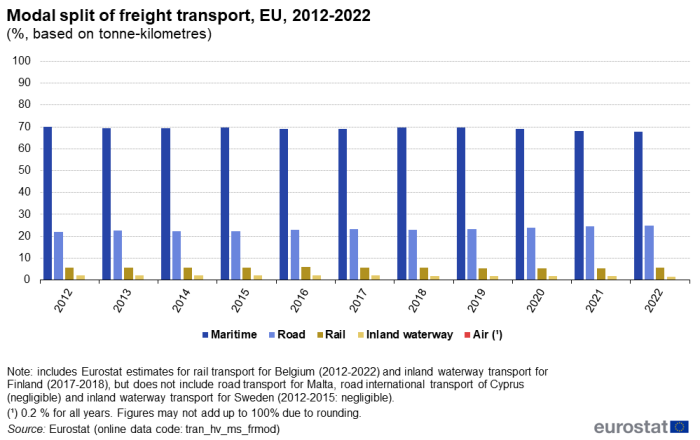
Maritime transport accounted for the largest share of EU freight transport performance (based on tonne-kilometres performed) among five transport modes: maritime, road, rail, inland waterway and air during the last decade. Figure 1 shows that the share of maritime freight transport reached its lowest point of the decade in 2022, at 67.8 % (5 087 billion tonne-km), after falling for three consecutive years. Most notably, there were decreases by 0.8 percentage points (pp) between 2020 and 2021 and 0.6 pp between 2019 and 2020. Maritime freight transport recorded its highest share in the last decade in 2012, with 69.9 %. Compared with 2012, the share of maritime transport was 2.1 pp lower in 2022. It should be noted that maritime transport has been impacted by the restrictions in freight transport due to Russia's military aggression against Ukraine since 2022.
(%, based on tonne-kilometres)
Source: Eurostat, (tran_hv_ms_frmod)
The share of road transport in the total EU freight transport performance reached a peak of 24.9 % (1 866 billion tonne-km) in 2022, after an increase of 0.4 pp compared with 2021. Over the period 2012-2022, the share of road transport had its lowest point in 2012, at 22.0 %.
The share of rail in the freight transport performance was relatively stable over the period 2012-2022. A peak was observed in 2016, at 5.8 %, while a low point was reached in 2020, at 5.2 %. In 2022, the share increased to 5.5 % (412 billion tonne-km).
The share of inland waterway in total freight transport performance was also relatively stable over the period 2012-2022. A peak was observed in 2012-2014, at 2.2 %, while was at low level of 1.7 % in 2018. In 2019, the share slightly increased to 1.8 % and remained at this level until 2021. In 2022, a low point was attained at 1.6 % (122 billion tonne-km).
The share of air in freight transport performance laid at 0.2 % (14 billion tonne-km in 2022) during the whole period 2012-2022.
It should be kept in mind that the share of each mode of transport is calculated by dividing the tonne-kilometres performed by each mode by the tonne-kilometres performed by all five modes together. This means that an increase in the share of one mode reflects drops in the shares of other modes but may not necessarily indicate drops in transport performance (tonne-kilometres) for other modes.
Modal split of freight transport by country in 2022
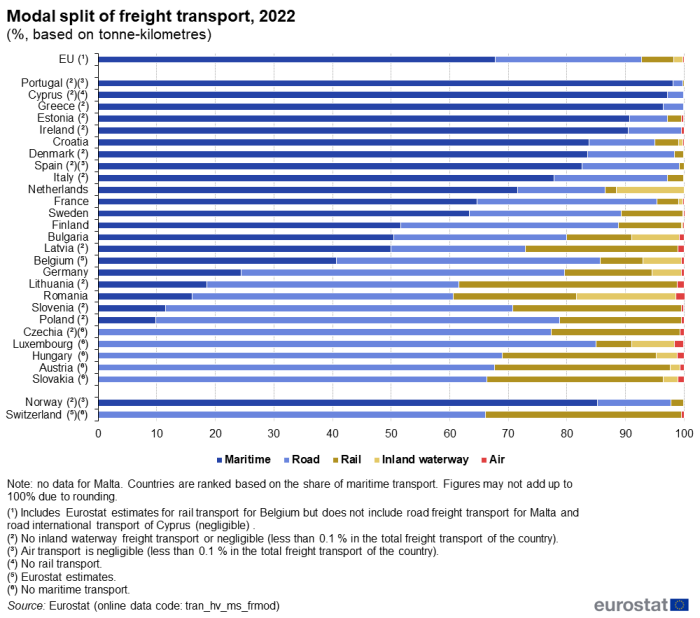
Even though the modal split between the different modes of transport does not tend to change radically from year to year at EU level, changes are sometimes more noticeable at country level. As can be seen in Figure 2, the modal split at country level varies considerably. The modal split obviously depends on the availability of a given mode. Czechia, Luxembourg, Hungary, Austria, Slovakia and the EFTA country Switzerland are landlocked countries with no coastline. Cyprus and Malta have neither railways nor navigable inland waterways. Moreover, inland waterway freight transport is applicable for only 17 of the EU countries and the EFTA country Switzerland.
In 2022, maritime freight transport was predominant in all countries with maritime ports, with the exception of Belgium, Germany, Lithuania, Romania, Slovenia and Poland. The highest shares of maritime freight transport were observed in Portugal, with 98.1 %, followed by Cyprus (97.2 %), Greece (96.4 %), Estonia (90.7 %) and Ireland (90.5 %). The lowest maritime freight transport shares were observed in Poland (9.8 %), Slovenia (11.5 %), Romania (16.0 %) and Lithuania (18.6 %), making maritime only the third or fourth largest mode of transport in these countries. It should be noted that these shares not only reflect the maritime freight transport occurring in the ports, but also the maritime traffic passing through the Exclusive Economic Zones (EEZ) of the countries. Therefore, the geographical position and the size of the EEZ of each country influence the results. For example, the high share of Portugal is influenced by traffic passing through not only the EEZ close to the mainland but also through the EEZ around the Azores and Madeira islands.
The share of road transport was the highest in Luxembourg, at 85.0 % in 2022, followed by Czechia (77.3 %), Poland and Hungary (both 69.0 %). Road transport was the first or second main mode of transport in all countries except Latvia. In Latvia, the maritime freight transport share was 50.0 %, the rail freight transport share 26.0 % and the road freight transport share 22.9 %. In 2022, the lowest road freight transport shares were observed in Portugal (1.7 %), Cyprus (2.7 %), Greece (3.5 %), Estonia (6.4 %) and Ireland (9.0 %); these were the countries where maritime transport dominated most.
(%, based on tonne-kilometres)
Source: Eurostat, (tran_hv_ms_frmod)
In 2022, rail transport was not the main mode of transport in any of the countries. Among the countries that also have maritime transport, a relatively high share of rail freight transport was recorded in Lithuania (37.2 %), Slovenia (28.8 %), Latvia (26.0 %), Romania (21.0 %) and Poland (20.8 %). Among the countries without maritime transport, Slovakia had the highest share of rail transport, at 30.1 %, followed by Austria (30.0 %), Hungary (26.3 %) and Czechia (22.0 %).
In 2022, the highest share of inland waterway freight transport was observed in Romania, at 17.0 %. This was still far below the 44.6 % share of road freight transport for this country, but close to the 21.0 % of rail freight transport and slightly greater than the 16.0 % of maritime freight transport. The Netherlands was the only other country with a share of inland waterway freight transport higher than 10 %, at 11.6 %. The comparatively high share of inland waterway freight transport in Romania is partly explained by the extensive traffic on the Danube and partly by the 'territorialisation' of the road freight transport (more information on this adjustment is given in the Data sources section below). Among the 17 countries which report inland waterway transport, the lowest shares were observed in Czechia, Italy, Lithuania, and Poland, with less than 0.1 %.
In 2022, the share of air freight transport was lower than 2 % in all countries. The highest share was recorded in Luxembourg and Romania, at 1.5 %. The lowest shares were observed in Portugal and Spain, with less than 0.1 %. The share of air transport was higher than the inland waterway freight transport share in five EU countries (Czechia, Italy, Lithuania, Finland and Sweden) out of the 17 countries reporting inland waterway transport. It was also the case in the EFTA country Switzerland.
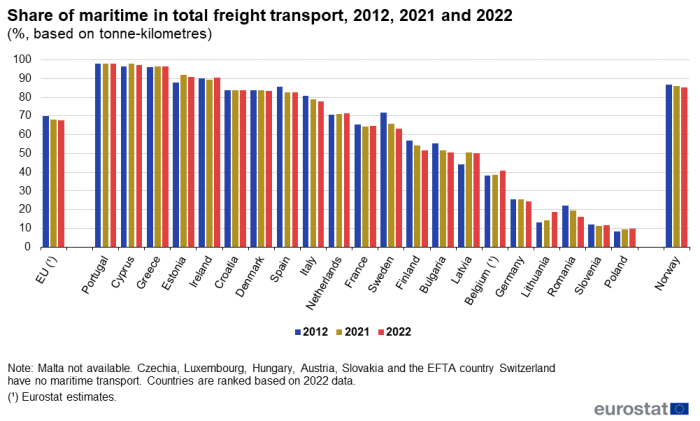
In 2022, the share of maritime transport in the total freight transport in the EU (measured in tonne-kilometres) decreased by 2.1 pp compared with 2012. When looking at the evolution of the share in the total freight transport over the last decade, the shares of maritime transport remained relatively stable in most of the EU countries (Figure 3). Only five countries saw a change of more than 5 pp (positive or negative) in 2022 compared with 2012. Latvia registered the highest growth, by 5.7 pp, followed by Lithuania (+5.5 pp). By contrast, Sweden recorded the largest drop, by 8.4 pp, followed by Romania (-6.0 pp) and Finland (-5.1 pp).
When comparing with 2021, the shares of maritime freight transport in 2022 dropped in 11 of the 22 EU countries with maritime ports and in the EFTA country Norway. Generally, these falls were marginal. Only six EU countries saw their share decreasing by more than 1 pp, but still less than 4 pp. The highest drop was observed in Romania, by 3.5 pp. By contrast, the highest increase was recorded in Lithuania (+4.3 pp), followed by Belgium (+2.1 pp).
(%, based on tonne-kilometres)
Source: Eurostat, (tran_hv_ms_frmod)
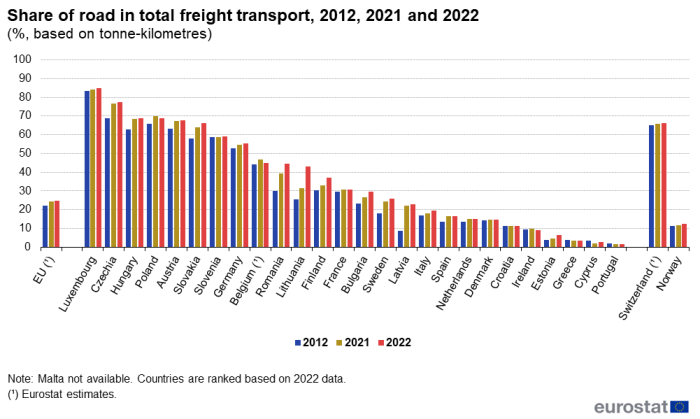
In 2022, the share of freight transport by road in the EU (measured in tonne-kilometres) increased by 2.9 pp compared with 2012. When comparing 2022 with 2012, the share of road in total freight transport performance dropped slightly in four EU countries (Figure 4). The largest fall was recorded in Ireland and Greece (-0.3 pp). It should be noted that the share of road transport in Greece was already low (from 3.8 % in 2012 to 3.5 % in 2022). By contrast, substantial increases were observed in Lithuania (+17.5 pp), Romania (+14.5 pp), Latvia (+14.1 pp), Czechia (+8.6 pp), Slovakia (+8.2 pp) and Sweden (+7.9 pp). In the case of Sweden, the growth in the share of road freight transport is close to the fall in the share of maritime freight transport, when comparing 2022 with 2012. For the other countries, except Romania, this growth was accompanied with a more or less similar drop in the share of rail transport.
When looking at the two most recent reference years, Belgium showed the strongest decrease in the share of road freight transport with -1.8 pp from 2021 to 2022. Only five other EU countries decreased over the same period (by less than 1 pp). By contrast, the share of road freight transport increased the most in Lithuania (+11.4 pp), followed by Romania (+5.3 pp), Finland (+4.0 pp) and Bulgaria (+2.8 pp). The remaining countries registered growth of less than 2.5 pp.
(%, based on tonne-kilometres)
Source: Eurostat, (tran_hv_ms_frmod)
In 2022, the share of rail transport in the EU (measured in tonne-kilometres) decreased by 0.2 pp compared with 2012. When comparing 2022 with 2012, the share of rail in total freight transport performance dropped in 14 of the 25 EU countries that have railways, as well as in the EFTA country Switzerland (Figure 5). The highest falls were recorded in Lithuania, from 60.4 % in 2012 to 37.2 % in 2022 (-23.2 pp) and in Latvia, from 46.4 % in 2012 to 26.0 % in 2022 (-20.4 pp). The decreases in the share of rail transport were noticeable also in Czechia (-8.2 pp), Slovakia (-6.1 pp) and Estonia (-5.7 pp). By contrast, the share of rail increased the most in Bulgaria (+3.9 pp). The remaining countries registered growths of less than 0.8 pp or remained the same.
When comparing with 2021, Lithuania recorded the highest fall in 2022 (-15.6 pp), followed by Slovakia (-1.7 pp) and Finland (-1.5 pp); the other countries that recorded a decrease registered a fall in the share of rail freight transport by less than 1 pp. By contrast, the highest growth was observed in Bulgaria (+1.8 pp). The remaining 17 EU countries registered growths of 1 pp or less.
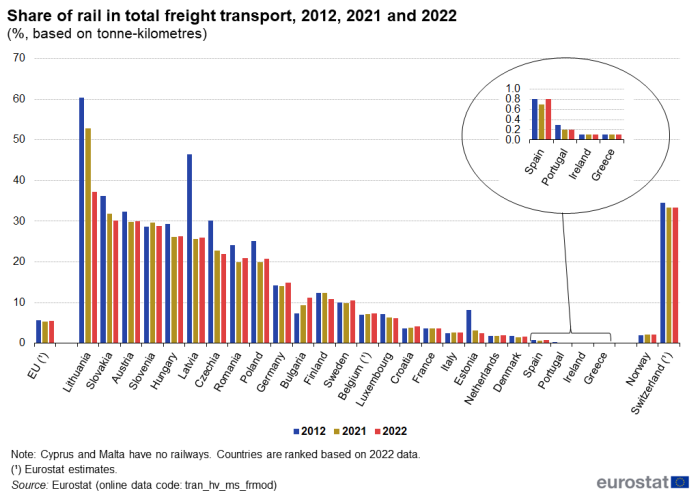
(%, based on tonne-kilometres)
Source: Eurostat, (tran_hv_ms_frmod)
When comparing 2022 with 2012, the share of inland waterways in total freight transport performance dropped in 13 of the 16 EU countries for which this mode of transport is applicable (Figure 6) and for which data are available for both years. The largest fall was recorded in Romania, by -5.4 pp, followed by Bulgaria (-5.3 pp), Belgium (-3.5 pp), Hungary (-2.8 pp), Germany (-2.4 pp), Slovakia (-2.1 pp) and the Netherlands (-2.0 pp). The other countries with a decrease registered a loss of less than a 2 pp. The shares for the three remaining countries for which data are available for both 2012 and 2022 remained unchanged.
When comparing with 2021, Bulgaria registered the highest decrease in the share of inland waterway freight transport in 2022, by -3.6 pp, followed by Romania (-2.8 pp). Nine other EU countries recorded a slight fall, each of them by less than 1 pp. The shares for the six remaining countries stayed unchanged.
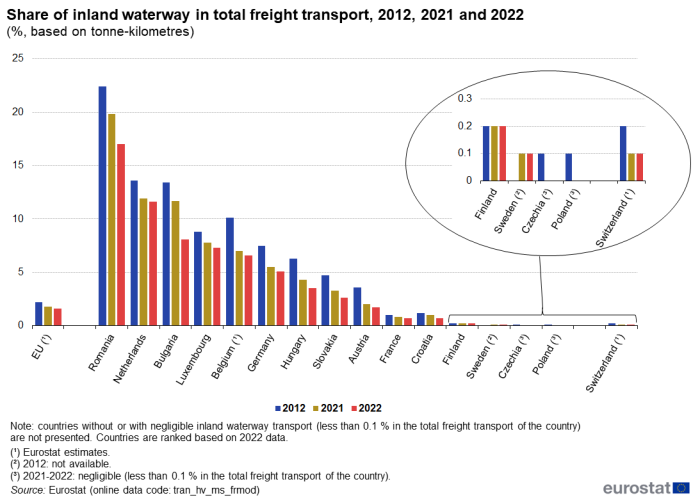
(%, based on tonne-kilometres)
Source: Eurostat, (tran_hv_ms_frmod)
The share of air in total freight transport performance was quite stable in all countries in 2022 compared with 2012 (Figure 7). The highest increases were recorded in Luxembourg, by 0.7 pp and Latvia , by 0.6 pp. The eight other EU countries with a positive trend registered a growth of less than 0.3 pp. By contrast, there was a slight decrease for four EU countries over the same period, all lower than 0.4 pp. The shares for the rest of the countries remained unchanged. However, in all EU countries, the share of air transport remained at a low level.
Between 2021 and 2022, the shares remained unchanged in 18 EU countries and in the EFTA countries Norway and Switzerland. In three EU countries, there was a slight increase by 0.1 pp By contrast, Latvia and Lithuania fell by 0.4 pp and 0.2 pp, while three EU countries slightly fall by 0.1 pp.
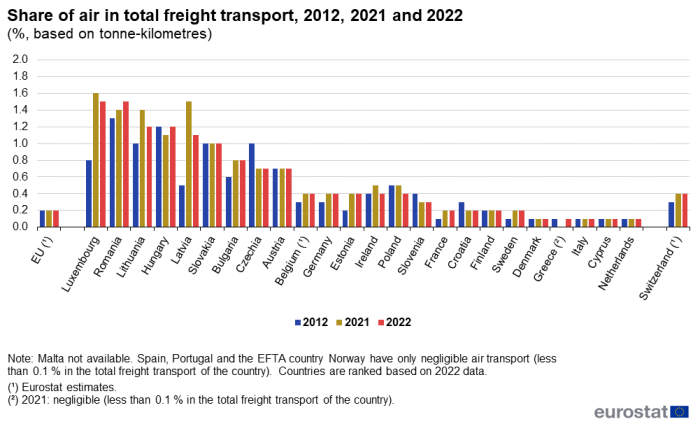
(%, based on tonne-kilometres)
Source: Eurostat, (tran_hv_ms_frmod)
Source data for tables and graphs
Data sources
The sources for the statistics in this article are from Eurostat. Statistical data have been reported to Eurostat by EU Member States in the framework of various EU legal acts. The essential legal acts are the following:
- Road: Regulation (EU) No 70/2012 on statistical returns in respect of the carriage of goods by road (recast);
- Rail: Regulation (EU) No 2018/643 recast of Regulation (EU) No 2016/2032;
- Inland waterways: Regulation (EU) No 2018/974 of the European Parliament and of the Council on statistics of goods transport by inland waterways.
- Air: Regulation (EC) No 437/2003 on statistical returns in respect of the carriage of passengers, freight and mail by air
- Maritime: Directive 2009/42/EC on statistical returns in respect of carriage of goods and passengers by sea
This article also includes data for transport modes from two EFTA countries Norway and Switzerland. Iceland and Liechtenstein (for Liechtenstein since 2013) are both granted derogations for road freight transport.
According to Regulation (EU) No 70/2012 on statistical returns in respect of the carriage of goods by road, Malta is granted derogation from reporting road freight data to Eurostat. Thus data on modal split for Malta are not available; however, maritime and air transport data are included in the EU aggregates.
Modal split is defined as the percentage of each mode of transport in the total transport performance measured in tonne-kilometres. Transport performance follows the 'territoriality principle', meaning that only freight performed within the territory of a country is considered. Thus Eurostat applied certain adjustments for road, maritime and air transport.
Adjustment of road freight data according to the 'territoriality principle'
Road freight transport, and particularly the part of international (including cross-trade) transport, needed to be 'territorialised' as it is reported by the countries on the basis of the nationality of the haulier, not on the basis of where the transport was carried out. For example, a haulier from the Netherlands might undertake a journey to Portugal. Though only a small part of this journey is in the Netherlands, the entire transport performance is accounted for by the Netherlands, as the vehicle carrying out the transport is registered there.
In order to calculate modal split shares on the basis of coherent data sets, as rail and inland waterways follow the 'territoriality principle', the international road freight transport data have been redistributed according to the national territories where the transport actually took place. This redistribution involved modelling the likely journey itinerary and projecting it on the European road network. The international road freight journeys' tonne-kilometres have been taken from the 'Tables on transport operations at regional level', computed by Eurostat on the basis of the detailed national survey data. Eurostat does not disseminate these tables but provides them to the reporting countries. There is a time lag before these tables become available due to the necessary data redistribution. Furthermore, the territorialisation of international road freight data makes sense only when the datasets of all reporting countries have been received and validated.
In order to redistribute the tonne-kilometre data proportionally to the countries concerned by the journey, the TERCET tool (territorial typologies) has been used. This tool allows the calculation of the total distance between the region of origin NUTS level 3 and the region of destination NUTS level 3 and breaks down the total distance into sections according to the countries in which this transport took place. With the help of this tool, the distances driven on the territories of the individual countries were calculated and the declared tonne-kilometres were proportionally attributed to the countries concerned.
More information on the territorialised road freight tonne-kilometres can be found in the relevant metadata on Eurostat website, here.
Calculation of tonne-kilometres for air and maritime freight transport
Within the framework of the relevant legal act, Eurostat collects maritime data of goods transported in tonnes between port pairs (port of loading and port of unloading). Nevertheless, these data cover only defined 'main ports', i.e. ports handling more than one million tonnes of goods annually. In order to calculate transport performance in tonne-kilometres for maritime transport, Eurostat has developed a distance matrix on the basis of the most likely sea routes taken by vessels. The distance matrix also contains segments of the port-to-port routes, based on the distance performed in the Exclusive Economic Zones (EEZ) of the countries crossed. This allows the calculation of passenger-km and tonne-km; when the distance between two ports is known (input in the matrix) and the number of passengers or the volume of the freight forwarded on this route is reported, the transport performance (tonne-km and passenger-km) can easily be calculated. The calculated 'territorialised' maritime transport performance is a concept intended to be used only for comparing the transport modes' activity at the EU or at country level for the purpose of modal split. More information can be found in the relevant metadata on Eurostat website, here.
Similarly to maritime transport, Eurostat collects air transport data of cargo (expressed in tonnes) forwarded between airport pairs according to the relevant legal act. The legal act defines categories of airports according to the passenger units handled per year. Passenger unit is equivalent to either one passenger or 100 kilograms of freight and mail. Three datasets are defined according to different concepts: 'Flight Stage', 'On Flight Origin Destination', 'Airport'. Air transport data used for the calculation of tonne-kilometres are based on the 'Flight Stage' concept. Air transport, as analysed in this article, covers transport to and from any airport in the reporting countries with more than 150 000 passenger units annually. In order to calculate transport performance in tonne-kilometres for air transport, Eurostat uses a distance matrix that contains great circle distances (minimum distance on a spherical line) between airport pairs. The distance matrix contains as well a so-called 'territorialisation tool' that allows attributing the calculated tonne-kilometres to the countries overflown on the route. The distance for each country is based on its national airspace, which includes territorial waters of 12 nautical miles off its coast. The calculated 'territorialised' air transport performance is a concept intended to be used only for comparing the transport modes' activity at the EU or at country level for the purpose of modal split. More information can be found in the relevant metadata on Eurostat website, here.
Definitions of terms used within transport statistics are available in the transport glossary and in the 'Glossary for transport statistics - 5th edition - 2019'.
Context
Transport is an important sector of the European Union (EU) economy and plays a vital role in today's mobile society. Transportation and mobility are also central to sustainable development. Sustainable transportation can enhance economic growth and improve accessibility while respecting the environment and improving resilience of cities, urban-rural linkages and productivity of rural areas. The transport policy of the EU aims to foster clean, safe and efficient transport, underpinning the internal market for goods and the right of citizens to travel freely throughout the EU.
The main aspects of the EU transport policy are laid down in the White Paper "Roadmap to a Single European Transport Area — Towards a competitive and resource efficient transport system". Its objective is to establish a sustainable transport sector that continues to serve the needs of the economy and the citizens while meeting future constraints: oil scarcity, growing congestion and the need to cut CO2 and pollutant emissions in order to improve air quality particularly in cities.
Moreover, the Commission adopted the European Green Deal setting a strategic framework for a climate-neutral EU economy by 2050. Priority actions of the Green Deal for a shift to sustainable and smart mobility include boosting multimodal transport, support the deployment of automated and connected mobility solutions across modes, better addressing external costs of transport activities through pricing, ramping up the production and deployment of sustainable alternative transport fuels and reducing pollution from transport, especially in cities.
Direct access to
Other articles
- Transport statistics introduced
- Transport statistics at regional level
- Maritime freight and vessels statistics
- Maritime transport of goods - quarterly data
- Maritime transport statistics - short sea shipping of goods
- Railway freight transport statistics
- Inland waterway freight transport - quarterly and annual data
- Inland waterway transport statistics by product category
- Road freight transport statistics
- Road freight transport by type of goods
- Road freight transport by journey characteristics
- Road freight transport by vehicle characteristics
- Air transport statistics
Database
- Transport, see:
- Multimodal data (tran)
- Modal split of transport (tran_hv_ms)
- Volume of transport relative to GDP (tran_hv)
- Road transport (road)
- Territorialised road freight transport (road_tert)
- Maritime transport (mar)
- Maritime transport performance (mar_tp)
- Air transport (avia)
- Air transport performance (avia_tp)
- Railway transport (rail)
- Railway transport measurement – goods (rail_go)
- Inland waterways transport (iww)
- Inland waterways transport measurement – goods (iww_go)
Dedicated section
Methodology
- Glossary for transport statistics - 5th edition - 2019
- Modal split of transport (ESMS metadata file — tran_hv_ms_esms)
- Volume of freight transport relative to GDP (ESMS metadata file — tran_hv_frtra_esms)
- Volume of passenger transport relative to GDP (ESMS metadata file — tran_hv_pstra_esms)
- Territorialised road freight transport (ESMS metadata file — road_tert_esms)
- Air transport performance (ESMS metadata file — avia_tp_esms)
- Maritime transport performance (ESMS metadata file — mar_tp_esms)