Archive:Freight transport statistics
Data extracted in July 2020.
Planned article update: July 2021.
Highlights
Modal split of inland freight transport, 2018
This article presents information on freight transport in the European Union (EU), covering the transport modes road, rail, air, maritime and inland waterways. The ability to move goods safely, quickly and cost-efficiently to markets is important for international trade, national distributive trades and economic development. The rapid increase in global trade and the deepening integration of an enlarged EU, alongside a range of economic practices (including the concentration of production in fewer sites to reap economies of scale, delocalisation, and just-in-time deliveries), may (at least to some degree) explain the relatively fast growth of freight transport across the EU.
By contrast, strains on the transport infrastructure (congestion and delays), coupled with constraints regarding technical standards, interoperability and governance issues may slow down developments within the EU’s freight transport sector.
Full article
Modal split
Road transport continues to have the largest share of EU freight transport performance among the three inland transport modes. Figure 1 shows that in 2018, road transport accounted for three-quarters (75.3 %) of the total inland freight transport (based on tonne-kilometres performed). This share increased by 0.1 percentage points (pp) compared with the previous year. Rail transport accounted for 18.7 % of the EU total, slightly higher than the previous year (+0.4 pp), while the share of inland waterways was 6.0 % of the total inland transport performance.
Even though the modal split between the different modes of transport does not tend to change radically from year to year at EU level, changes are sometimes more noticeable at country level. The modal split at country level varies considerably. In particular, the modal split obviously depends on the availability of a given mode. Only 17 of the Member States report freight data on inland waterways. In particular, Cyprus and Malta do not have either railways or navigable inland waterways; thus, for these two Member States the share of road freight transport is 100 % by default.

(% share in tonne-kilometres)
Source: Eurostat (tran_hv_frmod)
In 2018, road transport was the main inland transport mode used in all EU Member States with the exception of Lithuania and Latvia, where it represented 32.1 % and 24.2 % of total inland freight transport, respectively. In those two countries, rail transport was the main inland transport mode used in 2018 with shares of 75.8 % in Latvia and 67.9 % in Lithuania. Rail also played a major role in the other Baltic Member State Estonia, with a share of 46.2 % in 2018. In 2018, road transport accounted for more than 70 % of inland freight transport in 16 Member States and more than 90 % in Ireland, Greece and Spain. The share of inland waterways was the highest in the Netherlands (43.2 %). High shares were also recorded in Romania (27.1 %), Bulgaria (24.5 %) and Belgium (16.1 %).
It should be noted that this analysis refers only to inland freight transport; considerable amounts of freight may be transported by maritime freight services and, for some product groups, by air transport or by pipelines.
Rail transport
Concerning freight transport by rail, in 2018, the total EU performance can be estimated at around 413 billion tonne-kilometres. The main contributor among the Member states was Germany, with 117 billion tonne-kilometres, representing almost one-third of the total EU performance (Figure 2).
Compared with 2017, the largest increases in total transport performance among the EU Member States were observed for Latvia (+18.9 %), Greece (+14.1 %), Bulgaria (+13.1 %) and Estonia (+11.3 %). Substantial growth was also registered in North Macedonia (+11.0 %). By contrast, substantial decreases were registered in Hungary (-20.8 %) and Ireland (-11.8 %).
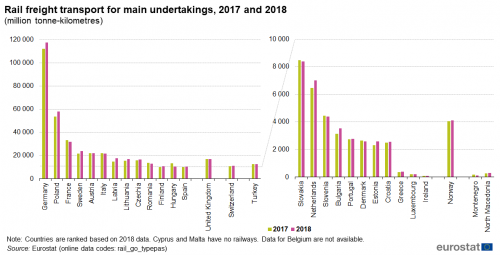
(million tonne-kilometres)
Source: Eurostat (rail_go_typepas)
Rail freight transport performance by type of transport (national, international loadings/unloadings and transit) in total tonne-kilometres performed is shown in Figure 3. The share of international transport in the various countries is strongly linked to their geographical position within Europe. For the EU as a whole, the share of national could be estimated at 48.8 % in 2018, international unloadings at 23.8 %, international loadings at 16.7 % and transit at 10.7 % (Figure 3). In this context, transit transport performance for the EU has been calculated as the sum of the transit transport performance reported by each Member State.
The Member States registering the highest share of international transport are located in key corridors within the European market. In the Baltic States of Latvia and Estonia, situated at the border between the EU and Russia, international unloadings accounted for 84.5 % and 68.0 % of the total transport performance in 2018, respectively. The Netherlands, strategically situated in the heart of the European market, registered a share of international loadings of 57.5 % in total tonne-kilometres performed. The key import port of Rotterdam, with large sea/rail transfers of goods dispatched within the European Union, strongly influences these figures. Greece registered the highest share of international transport on total transport performance in 2018, with 97.0 %.

(% share in tonne-kilometres)
Source: Eurostat (rail_go_typepas)
By contrast, countries with specific geographical characteristics (at the periphery of the EU or islands) recorded a low share of international transport by rail. No international transport has been recorded for Ireland in 2018. Small shares are observed for Denmark (10.5 %). For such countries, the preferred mode for international freight transport remains maritime transport, goods being delivered at the nearest port to the point of their destination and then being forwarded in the country mainly by road, but also by rail (accounted as national transport). Turkey also recorded a low percentage (4.4 %) which may also be linked to its peripheral position.
Regarding transit transport, Denmark registered the highest share in 2018, with 83.1 %. The EFTA country Switzerland and the candidate country North Macedonia also record substantial shares (64.9 % and 59.3 %, respectively). By contrast, seven EU Member States, the United Kingdom and the EFTA county Norway did not report any transit transport.
When looking at national transport, the highest shares in 2018 were observed in Ireland (100 %), Spain (83.8 %), Portugal (78.9 %), Bulgaria (74.9 %), Romania (73.5 %) and Poland (70.0 %). National transport represented 97.1 % in the United Kingdom and 95.4 % in the candidate country Turkey in 2018. By contrast, national transport represented only 1.9 % in Latvia, 3.0 % in Greece, 6.4 % in Denmark, 7.2 % in the Netherlands and 8.5 % in Luxembourg. In the candidate country North Macedonia, national transport was less than 1 % in 2018.
Road transport
After a long domination as one of the most significant countries for road transport in Europe, Germany (317 billion tonne-kilometres) overtook Poland (316 billion tonne-kilometres) in 2018 (Table 1). Cyprus (+8.0 %), Romania (+7.4 %), Slovenia and Croatia (both +6.8 %) were the Member States recording the highest rises in tonne-kilometres performed from 2017 to 2018. At the other end of the scale, Bulgaria (-23.3 %) and Luxembourg (-16.0 %) registered the highest falls in 2018 compared with the previous year. They were followed by Czechia (-7.2 %), Estonia (-6.7 %) and Poland (-5.8 %). Croatia and Cyprus registered increases in all transport types, while Luxembourg and Poland registered decreases in all transport types. Lithuania, Italy, Croatia and Austria recorded very strong growth for cabotage (more than 14 %), while on the other hand, Finland, Sweden, Belgium, Czechia, Ireland, Portugal, Luxembourg and Hungary recorded substantial decreases (ranging from -39 % to -13 %). In cross-trade transport, Lithuania and Slovenia experienced considerable increases (more than 10 %), while Czechia, Denmark, Italy, Hungary, Portugal, Belgium, Austria and the Netherlands recorded substantial decreases (ranging from -41 % to -11 %).
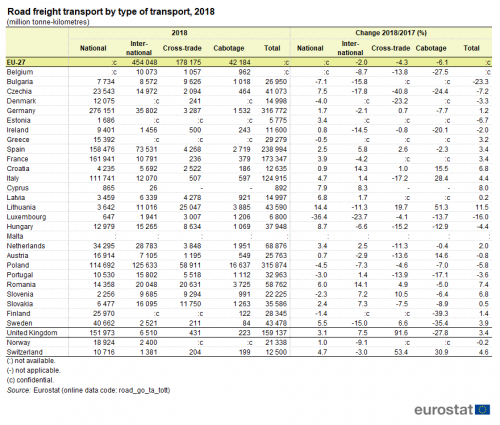
(million tonne-kilometres)
Source: Eurostat (road_go_ta_tott)
Road freight vehicles of less than 2 years old dominated the EU market in the last years, and 2018 was not an exception with more than 23 billion vehicle-kilometres (19 % of the total vehicle-kilometres). In 2018, vehicles 5 years old or less accounted for 59 % of the total vehicle-kilometres, while those over 10 years old accounted for 22 % of vehicle-kilometres (Figure 4).
Between 2012 and 2018, there was a strong decline in vehicles between 4 and 9 years old (-25.2 % in terms of vehicle-kilometres), despite the increase observed between 2008 and 2012 (+10.3 %). By contrast, transport performed by vehicles of less than 4 years old and vehicles aged 10 years or more, increased substantially from 2012 to 2018 (+57% and +49.3 % respectively). The growth between 2008 and 2012 was even stronger (+ 64.2 %). Transport performed by very old road freight vehicles (15 years old or more) has regularly increased in recent years (+67.8 % from 2012 to 2018). However, it represented only 5.5 % of the total vehicle-kilometres.
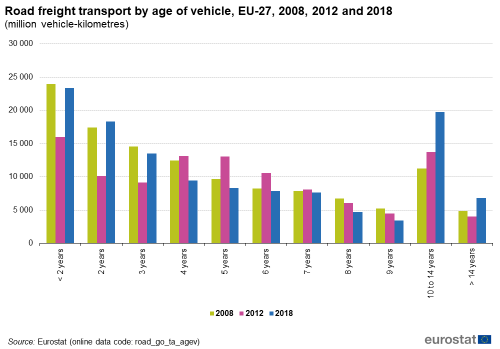
(million vehicle-kilometres)
Source: Eurostat (road_go_ta_agev)
In 2018, Poland continued to have the highest share in EU international transport (29.8 %) and saw its share decrease by 1.2 percentage point from 2017 to 2018 (Figure 5). It was followed by Spain (11.9 %), Romania (6.6 %) and Germany (6.0 %).
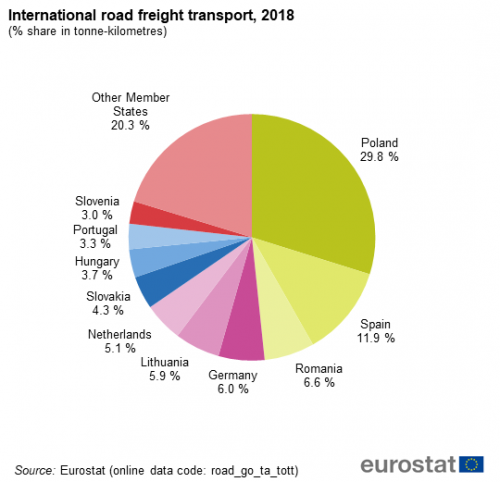
(% share in tonne-kilometres)
Source: Eurostat (road_go_ta_tott)
The EU share of cross-trade transport was 26.4 % while cabotage transport represented 6.3 %
(Figure 6). For six Member States (Lithuania, Bulgaria, Luxembourg, Slovenia, Romania and Slovakia), the share of cross-trade in international transport represented more than 40 % of international transport. For Luxembourg and Ireland, the share of cabotage is also substantial (19.6 % and 11.1 %, respectively); this can be explained by the location of the country. The EFTA country Switzerland also reported a significant share of cabotage (11.2 %).

(% share in tonne-kilometres)
Source: Eurostat (road_go_ta_tott)
The ‘average load’ was calculated by dividing annual freight transport performance (tonne-kilometres) by the corresponding laden distance travelled (vehicle-kilometres, equivalent to kilometres). This indicator provides information on the average weight in tonnes carried per road vehicle in each country and at EU level.
EU average vehicle loads for international transport were 16.1 tonnes in 2018. Cyprus had the highest international load at 26.0 tonnes, while Finland had the highest national load at 17.2 tonnes (Figure 7). Slovakia recorded the lowest average load in national transport (6.0 tonnes).
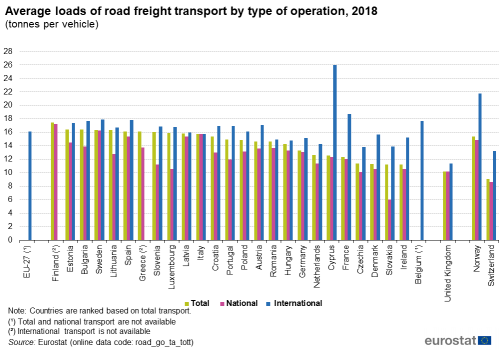
(tonnes per vehicle)
Source: Eurostat (road_go_ta_tott)
In 2018, 'metal ores and other mining and quarrying products' was the largest product group in terms of tonnage, accounting for 3 472 million tonnes (Table 2), followed by 'other non-metallic mineral products' (1 635 million tonnes). The highest rises between 2017 and 2018 were recorded for 'Coal and lignite; crude petroleum and natural gas' (+9.6 %) and 'basic metals and fabricated metal products' (+5.5 %). ‘Textiles and textile products’ saw the biggest decrease over the same period (-13.6 %), after several consecutive increases in the previous years.
In 2018, 'mixture of different types of goods which are transported together' dominated transport when measured in tonne-kilometres, accounting for 188 billion tonne-kilometres. This group of goods was followed by 'other non-metallic mineral products' (140 million tonne-kilometres), 'metal ores and other mining and quarrying products' (137 tonne-kilometres) and ' basic metals and fabricated metal products' (124 million tonne-kilometres). The highest rises between 2017 and 2018 were for 'metal ores and other mining and quarrying products' (+3.7 %), and 'equipment and material for transport of goods' (+2.9 %), while significant decreases were registered for 'textiles and textile products' (-11.7 %), 'coal and lignite; crude petroleum and natural gas' (-10.2 %) and 'coke and refined petroleum products' (-6.6 %).
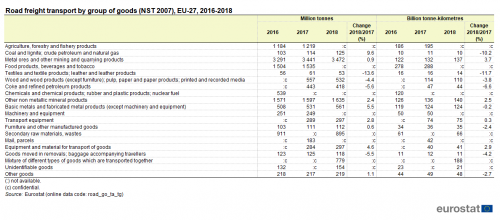
Source: Eurostat (road_go_ta_tg)
Figure 8 shows that one fifth of road freight journeys were performed by empty vehicles at EU level in 2018. The share of empty journeys was 12.1 % for international transport in 2018.
At total transport level, most Member States recorded a percentage of empty vehicle-kilometres between 15 % and 30 %. However, the figure for Cyprus was 50.0 %, probably a reflection of the journeys carrying goods imported through ports and construction traffic, which is largely one way. Empty journeys for Austria were slightly higher than the average, recording 34.2 % empty vehicle-kilometres. At the other extreme were Belgium with 6.1 % of empty vehicle-kilometres and Denmark (9.3 %).
The total figures largely reflect performance in national transport. By contrast, for international transport, all Member States reported substantially lower levels of empty runnings, only four countries being over 20 % (Luxembourg with 22.4 %, Austria with 22.1 %, the Netherlands with 21.3 % and France with 20.6 %). This shows the economic importance of finding loads for international return journeys, while empty journeys can be more present in domestic transport.

(% share in vehicle-kilometres)
Source: Eurostat (road_go_ta_tott)
Figure 9 shows the types of dangerous goods in EU road freight transport in 2018. The largest specific product group was ‘flammable liquids’, taking over more than half of the total (52.6 %). Two other groups, ‘gases (compressed, liquefied or dissolved under pressure)’ and ‘corrosives’, accounted for 13.9 % and 12.1 % respectively. There were very small changes compared with previous years, the distribution between product groups remained quite similar over time.
As dangerous goods represent a small share of all the goods transported by road, there are considerable uncertainties in the surveys’ results on this type of goods.
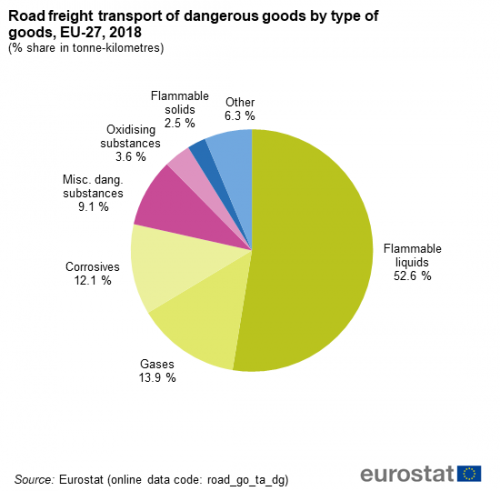
(% share in tonne-kilometres)
Source: Eurostat (road_go_ta_tg)
Inland waterways transport
When it comes to freight transport by inland waterways, the main types of goods (according to NST2007 classification) transported at EU level in 2018 were ‘metal ores’, ‘coke and refined petroleum products’ and ‘chemicals, rubber and plastic, nuclear fuel’. ‘Products of agriculture’ lost the third place compared with 2017. These top 3 categories accounted for more than half of all goods transport on EU inland waterways (Figure 10).
All types of goods recorded a decrease in 2018 compared with 2017. The largest fall was observed for ‘coal and crude petroleum’ (-14.5 %), followed by ‘products of agriculture’ (-12.7 %). Compared with 2017, the shares of ‘metal ores’ and ‘chemicals, rubber and plastic, nuclear fuel’ in total transport performance increased (by 1.2 percentage points for ‘metal ores’ and 0.1 percentage point for ‘chemicals, rubber and plastic, nuclear fuel’), while the share of ‘coke and refined petroleum products’ fell by -0.2 percentage points.
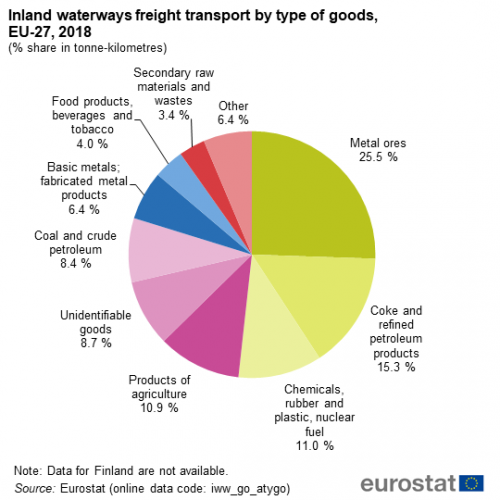
(% share in tonne-kilometres)
Source: Eurostat (iww_go_atygo)
Maritime freight
As regards seaborne freight transport, the total gross weight of goods handled in EU ports is estimated at 3.6 billion tonnes in 2018, an increase of 3.0 % from 2017.
The Netherlands reported the largest volume of seaborne freight handling in Europe in this period (Figure 11). At 605 million tonnes, the volume of seaborne goods handled in Dutch ports represented 16.9 % of the EU total in 2018. The Netherlands was followed by Italy and Spain. Their respective shares were 14.0 % and 13.9 % of the EU total.
Among other countries reporting maritime freight data to Eurostat, the United Kingdom and the candidate country Turkey handled 483 million tonnes and 454 million tonnes of goods in 2018, placing these two countries between Spain and France in terms of total tonnage of seaborne goods handled.
Compared with 2017, the largest relative increases in port freight activity among the EU Member States were recorded by Poland (+17.6 %), Malta (+10.8 %), Latvia (+6.8 %) and Romania (+6.3 %). Only four countries registered a decrease in port freight activity: Cyprus (-11.6 %), Bulgaria (-10.0 %), Portugal (-3.2 %) and Germany (-1.0 %).
All in all, nine EU Member States recorded decreases in port freight activity in the ten-year period between 2008 and 2018. The highest relative falls were observed for Croatia (-26.2 %), Cyprus (-12.7 %), and France (-12.3 %). The United Kingdom also registered a fall of -14.0 % within the same period. In contrast, Poland registered the largest relative increase (+88.0 %), followed by Lithuania (+44.2 %), Slovenia (+39.7 %), Portugal (+38.4 %), Malta (+35.2 %), Greece (+24.9 %) and Spain (+19.6 %). Turkey also reported a noticeable increase of +48.8 %.
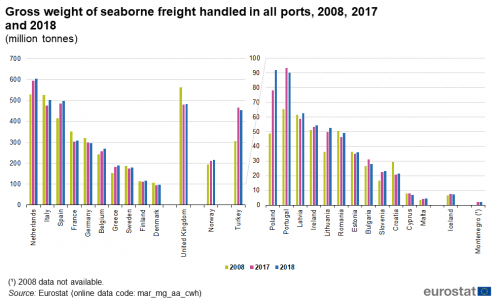
(million tonnes)
Source: Eurostat (mar_mg_aa_cwh)
Inward movements of goods to the EU countries increased by 2.8 % to more than 2.1 billion tonnes in 2018 compared with 2017, while outwards movements increased by 3.2 % to almost 1.5 billion tonnes. Nonetheless, inward movements still accounted for 59.2 % of the total tonnes of goods handled in the EU ports (Figure 12). Liquid bulk goods, such as crude oil and oil products, made up a substantial proportion of the inward tonnage.
More seaborne goods are unloaded from than loaded onto vessels in the majority of EU countries. Malta had the highest shares of unloaded goods in 2018, with 88 % of the total tonnes of seaborne goods recorded as inward movements to their ports. By contrast, the three Baltic countries, Bulgaria, Finland, Romania and the EEA country Norway all had high shares of outward movements of goods in the total movements of tonnes to their ports.
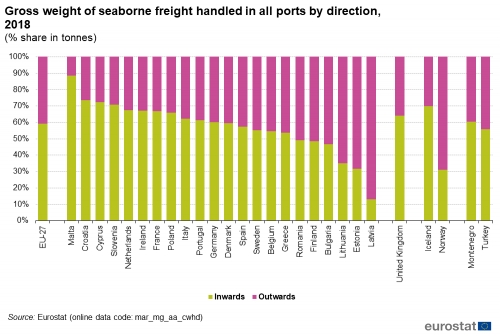
(% share in tonnes)
Source: Eurostat (mar_mg_aa_cwhd)
Rotterdam, Antwerpen and Hamburg, all located on the North Sea coast, maintained their positions as Europe's top three ports in 2018, both in terms of the gross weight of goods handled and in terms of the volume of containers handled in the ports. The 20 largest cargo ports accounted for 38 % of the total tonnage of goods handled in the reporting countries in 2018, a slight decrease compared with 2017. The largest port in Europe, Rotterdam in the Netherlands, on its own accounted for just above 9 % of the total tonnage handled in the countries reporting maritime freight data to Eurostat.
All in all, 11 of the top 20 cargo ports of the reporting countries, in 2018 were located on the Mediterranean, 8 on the North Sea coast of Europe and the remaining ports on the Atlantic coast (Map 1). The composition of the national port infrastructure will sometimes determine whether a country is represented on the top 20 list of cargo ports or not. Denmark and Finland, for instance, are countries with a large number of medium-sized ports, all handling volumes of goods lower than the 44 million annual tonnes required to make the top 20 list.
In terms of tonnage, maritime transport is the most significant mode for long distance transport of goods to or from the EU, with almost two thirds going to or from ports outside the EU (international extra-EU transport).
Map 2 illustrates the largest maritime transport flows between the EU and the main international partners (flows over 35 million tonnes). As shown in the map, all of the EU’s top 10 maritime flows of goods in 2018 were inward flows, with the exception of the outward flows from the United Kingdom and the East Coast of the USA. In descending order, these were the inward flows of goods from the Baltic Sea area of Russia (5.8 % of the total extra-EU seaborne transport), the outward and inward flows to/from the United Kingdom (5.2 % and 4.8 %, respectively), inward flows from the East Coast of the USA (4.2 %), Brazil, Norway (both 3.9 %), the Black Sea area of Russia (3.6 %), Turkey (3.3%), China (2.8 %) and the outward flow to the East Coast of the USA (2.4 %).

Source: Eurostat - Maritime transport - Goods (mar_go)
Air transport
The growing significance of the international transport segment is reflected in air freight and mail transport figures. In 2018, more than 14 million tonnes of freight and mail were transported by air in the EU (Figure 13), increasing by 2.2 % compared with 2017. This increase is mainly due to international extra-EU transport, which rose by 2.9 % from 2017 to 2018. By contrast, international intra-EU fell by 1.3 % in the same period. Compared with the previous year, domestic transport remained stable. Extra-EU transport dominates, accounting for 82 % of the total EU freight and mail transport in 2018.

(thousand tonnes)
Source: Eurostat (avia_gooc)
In 2018, airports in Germany dealt with 4.8 million tonnes of air freight and mail, representing 34 % of the total EU freight and mail transport. France and the Netherlands had the second and third highest amounts of air freight and mail transported, with 2.4 and 1.8 million tonnes, respectively. Some of the smaller EU Member States are relatively specialised in air freight and mail, notably all of the Benelux countries, in particular Luxembourg, which ranked as the sixth largest air freight and mail transporter among the EU Member States.
Source data for tables and graphs
Data sources
The development of freight transport statistics is based upon a raft of framework legislation and implementing legislation, generally organised according to the mode of transport under consideration. Statistics on inland freight transport are available with an annual frequency and time series generally begin in the early 1990s.
The majority of inland freight transport statistics are based on movements in each reporting country, regardless of the nationality of the vehicle or vessel involved (the ‘territoriality principle’). For this reason, the measure of tonne-kilometres (tkm), i.e. one tonne of goods travelling a distance of one kilometre, is generally considered a more reliable measure, as the use of tonnes entails a higher risk of double-counting, particularly for international transport. The methodology used across the EU Member States is not completely harmonised: for example, road freight statistics are generally based on all movements (in the registration country or abroad) of vehicles registered in the reporting country (the ‘nationality principle’).
The modal split of inland freight transport is based on transportation by road, rail and inland waterways, and therefore excludes air, maritime and pipeline transport. It measures the share of each transport mode in total inland freight transport and is expressed in tonne-kilometres. Note that the data on the modal split presented in this article uses road freight data that have been adjusted to be based on the territoriality principle rather than the nationality principle.
Goods loaded are those goods placed on a road vehicle, a railway vehicle or a merchant ship for dispatch by road, rail or sea. The weight of goods transported by rail and inland waterways is the gross-gross weight. This includes the total weight of the goods, packaging, and the tare weight of the container, swap-body and pallets containing goods; in the case of rail freight transport, it also includes road goods vehicles that are carried by rail. By contrast, the weight measured for maritime and road freight transport is the gross weight (in other words, excluding the tare weight of the container).
Road freight
Road freight transport statistics are collected under the framework provided by Regulation (EC) No 1172/98 on statistical returns in respect of the carriage of goods by road, substantially amended several times, and recast as Regulation (EU) No 70/2012. The data are based on sample surveys carried out in the reporting countries and record the transport of goods by road, as undertaken by vehicles registered in each of the EU Member States. It is important to note that almost all of the Member States apply a cut-off point for carrying capacity under which vehicles are not surveyed; this should not be greater than 3.5 tonnes carrying capacity, or 6 tonnes in terms of gross vehicle weight; some of the Member States also apply a limit on the age of the vehicles surveyed.
Rail freight
Rail freight data are collected under the framework provided by Regulation (EU) No 2018/643 recast of Regulation (EU) No 2016/2032 on rail transport statistics. The data are collected on a quarterly basis (usually limited to larger enterprises) and on an annual basis (covering enterprises of all sizes). Statistics for rail freight are not available for Malta and Cyprus (or Iceland) as they do not have a railway infrastructure. Rail statistics are also collected every five years in relation to a regional analysis (NUTS level 2).
Aside from the mandatory collection of data based on legal acts, Eurostat also collects rail transport statistics through a voluntary data collection exercise. The questionnaire used for this exercise provides information in relation to railway transport infrastructure, equipment, enterprises, traffic and train movements.
Maritime freight
The legal framework for the collection of statistics on maritime freight transport is Directive 2009/42/EC on statistical returns in respect of the carriage of goods and passengers by sea (Recast). Maritime transport data are available for most EU Member States from 2001 onwards, although some countries have provided data back to 1997. Statistics on maritime freight are not transmitted to Eurostat by Czechia, Luxembourg, Hungary, Austria and Slovakia as they have no maritime ports; for the same reason maritime data are not available for Liechtenstein or Switzerland.
Inland waterways freight
The legal framework for the collection of statistics on inland waterways freight transport is Regulation (EU) 2018/974 of the European Parliament and of the Council of 4 July 2018. This Regulation is a codification of Regulation (EC) No 1365/2006 on statistics of goods transport by inland waterways and includes all its amendments since 2006. Data on inland waterways are only required for those EU Member States with an annual quantity of goods transported that exceeds one million tonnes. On a voluntary basis, countries can provide only a reduced dataset. Currently, 17 Member States provide data on a mandatory or voluntary basis: Belgium (BE), Bulgaria (BG), Czechia (CZ), Germany (DE), France (FR), Croatia (HR), Italy (IT), Lithuania (LT), Luxembourg (LU), Hungary (HU), the Netherlands (NL), Austria (AT), Poland (PL), Romania (RO), Slovakia (SK), Finland (FI) and Sweden (SE). Data collection is based on an exhaustive survey of all inland waterway enterprises for all goods that are loaded or unloaded. In the case of transit, some countries make use of sampling methods in order to estimate the volume of goods transported.
Air freight
The legal framework for air transport statistics is provided by Regulation (EC) No 1358/2003 of 31 July 2003 implementing Regulation (EC) No 437/2003 of 27 February 2003 on statistical returns in respect of the carriage of passengers, freight and mail by air. Statistics on air freight are collected for freight and mail loaded and unloaded in relation to commercial air flights. The information covers national and international freight transport.
Air transport statistics are collected at the airport level by the EU Member States, United Kingdom, Norway, Iceland, Switzerland and the candidate countries. Annual data are available for most of the Member States for the period from 2003 onwards, while some countries have provided data back to 1993. Air freight statistics are also collected on a monthly and quarterly basis and with a regional analysis (NUTS level 2).
Treatment of double counting in air freight statistics: the national aggregates and total intra-EU aggregates exclude any double counting. They include all the reported departures plus a part of the reported arrivals; the reported arrivals that are included are those for which the corresponding departures of the partner airport are missing.
Context
A well-functioning transport system is vital for European Union (EU) enterprises and inhabitants. Transport services are essential for exploiting the economic strengths of all EU regions, supporting the internal market and growth, and for enabling economic and social cohesion. The EU transport policy is laid down in the 2011 White Paper ‘Roadmap to a Single European Transport Area — Towards a competitive and resource efficient transport system’. The strategy aims at fostering the development of an efficient, safe and secure single European transport area; shifting towards clean and low-emission mobility; connecting Europe with modern, multi-modal and safe transport infrastructure networks; creating an innovative transport sector through research and innovation activities; and at ensuring affordability, reliability and accessibility of transport. The White Paper was built around 10 goals and 40 initiatives. Currently, the progress towards the goals is under evaluation so that the EU can pave its future transport policy.
In order to monitor progress towards targets, answer specific questions on transport performance and propose future developments, the European Commission analyses a range of transport statistics. Eurostat’s statistics in this field describe the most important features of transport, not only in terms of the quantities of freight that are moved each year, but also the contribution of transport services to the economy as a whole. Data collection is supported by several legal acts obliging the EU Member States to report statistical data, as well as voluntary agreements to supply additional data.
More details concerning the European Commission’s policy initiatives on transport are provided in an introductory article on transport in the EU.
Direct access to
- Passenger transport statistics
- Freight transport statistics - modal split
- Air transport statistics
- Freight transported in containers - statistics on unitisation
- Inland waterway transport statistics
- Inland waterways - statistics on container transport
- Inland waterways freight transport - quarterly and annual data
- Maritime transport of goods - quarterly data
- Maritime transport statistics - short sea shipping of goods
- Railway freight transport statistics
- Road freight transport statistics
- Road freight transport by journey characteristics
- Road freight transport by type of goods
- Road freight transport by vehicle characteristics
- Road freight transport statistics - cabotage
- Transport, see:
- Regional transport statistics (t_tran_r)
- Maritime transport of freight, by NUTS 2 regions (tgs00076)
- Air transport of freight, by NUTS 2 regions (tgs00078)
- Transport, volume and modal split (t_tran_hv)
- Volume of freight transport relative to GDP (tsdtr230)
- Modal split of freight transport (tsdtr220)
- Railway transport (t_rail)
- Goods transport by rail (ttr00006)
- Road transport (t_road)
- Goods transport by road (ttr00005)
- Inland waterways transport (t_iww)
- Goods transport by inland waterways (ttr00007)
- Maritime transport (t_mar)
- Sea transport of goods (ttr00009)
- Air transport (t_avia)
- Air transport of goods (ttr00011)
- Transport, see:
- Multimodal split (tran)
- Transport, volume and modal split (tran_hv)
- Railway transport (rail)
- Road transport (road)
- Inland waterways transport (iww)
- Oil pipeline transport (pipe)
- Maritime transport (mar)
- Air transport (avia)
Reference manuals
- Reference manual on rail transport statistics, version 10.1 — January 2019
- Reference manual on air transport statistics, version 14 — September 2017
- Inland waterways reference manual version 9.1 — April 2018
- Reference manual on maritime transport statistics, version 4.0 — November 2017
- Road freight transport methodology — 2016 edition (Revised edition, August 2017)
- Methodologies used in surveys of road freight transport in Member States, EFTA and Candidate Countries — Revised — 2017 edition
ESMS metadata files
- Inland waterways transport (ESMS metadata file — iww_esms)
- Maritime transport (ESMS metadata file — mar_esms)
- Modal split of freight transport (ESMS metadata file — tran_hv_frmod_esms)
- Common Questionnaire for Inland Transport Statistics (ESMS metadata file — rail_if_esms)
- Road freight transport (ESMS metadata file — road_go_esms)
- Regulation (EU) No 70/2012 of 18 January 2012 on statistical returns in respect of the carriage of goods by road (recast)
- Summaries of EU legislation: Rules for the compilation of statistics regarding goods carried by road
- Regulation (EU) No 2018/643 recast of Regulation (EU) No 2016/2032 on rail transport statistics
- Summaries of EU legislation: EU rail transport statistics
- Directive 2009/42/EC on statistical returns in respect of the carriage of goods and passengers by sea (recast)
- Summaries of EU legislation: Statistical returns in respect of carriage of goods and passengers by sea
- Regulation (EU) 2018/974 of the European Parliament and of the Council of 4 July 2018.
- Summaries of EU legislation: EU statistics of goods transport by inland waterways
- Regulation (EC) No 1358/2003 of 31 July 2003 implementing Regulation (EC) No 437/2003 of 27 February 2003 on statistical returns in respect of the carriage of passengers, freight and mail by air
- Summaries of EU legislation: Statistics in respect of the carriage of passengers, freight and mail by air
