Forests, forestry and logging
Data extracted in December 2023.
Planned article update: 17 December 2024.
Highlights
The countries with the largest forest areas in the EU were Sweden (28 million hectares), Finland (22 million hectares) and Spain (19 million hectares), as estimated for 2021.
On average, an estimated 65 % of the net annual increment of wood in EU forests was logged in 2021.
In 2021 about 473 100 people were employed in forestry and logging; a drop of 16 % since 2000.
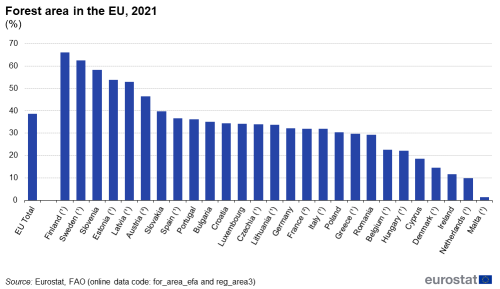
Forest area in the EU, 2021 (share of forest in total area, %)
Context
This article presents statistics on forestry and logging in the European Union (EU) and it is mostly based on Eurostat's annual data collection European Forest Accounts. Indicators combining data on forest resources and the economic and employment data are presented. In addition to the traditional production of wood and other forest-based products, forests are increasingly valued for their environmental role and as a public amenity. A wide range of EU policies and initiatives are linked to forests and the ecosystem services they provide, including biodiversity and climate change mitigation. This is recognized in the EU Forest Strategy for 2030, the EU Biodiversity Strategy, the EU Nature Restoration Law and in the Renewable Energy Directive (RED). The forest also plays an important role in the EU Bioeconomy Strategy by supporting employment in rural areas.
Full article
Forest areas in the EU are expanding
In 2021, the EU had an estimated 160 million hectares of forests (excluding other wooded land); in relative terms, this means that forests covered 39 % of the EU land area. This represents an increase of about 8 million hectares or 5.3 % since 2000 and 2.5 million hectares or 1.6 % since 2010. Forests cover more than half of the national (terrestrial) territory in five Member States: Finland (66 %), Sweden (63 %), Slovenia (58 %), Estonia (54 %) and Latvia (53 %) (Figure 1). In absolute terms, the countries with the largest forest areas are Sweden (27 980 thousand ha), Finland (22 409 thousand ha) and Spain (18 576 thousand ha), as estimated in 2021.
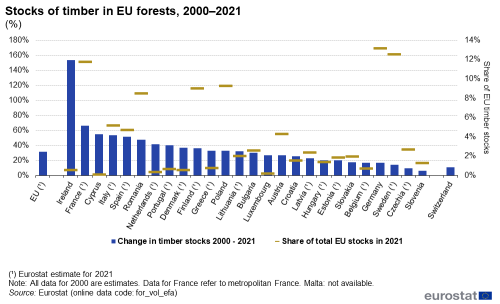
The stocks of timber in the EU's forests totalled an estimated 29 billion m3 (over bark) in 2021. Germany accounted for the largest share of this (13.1 %), followed by Sweden (12.5 %), and France (11.7 %). The stocks of timber in forests increased in every Member State, giving a 31.2 % growth at the EU level in the period of 2000–2021. The largest increase was estimated for Ireland (154 %), France (66 %), Cyprus and Italy (54%), while, at the other end of the spectrum, a much more moderate increase was estimated for Sweden (14 %) as well as Czechia (10 %) and Slovenia (6 %) (Figure 2). The increase in timber stock observed between 2000 and 2021 can be explained by the expansion of forest areas due to afforestation and natural reforestation.
In total, an estimated 65 % of the net annual increment of wood in EU forests was removed by the logging industry in 2021. The share of removals to net increment ranged between 30 and more than 100 % in EU Member States, with the exception of Cyprus, where only 6 % of the net increment was felled and removed from the forest. Removals in two countries exceeded 90 % of the net increment: Czechia (estimated at 104 %), Germany (99 %). (Figure 3). A removal share greater than 100% of annual net increment, as in Czechia, is possible when natural disturbances such as insects, wind, drought and forest fires create damaged wood that becomes available for harvest. This practice is called salvage logging and has increased in EU Member States affected by natural disturbances over the past decade.
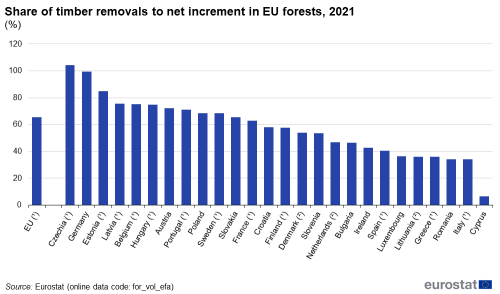
(%)
Source: Eurostat (for_vol_efa)
Economic indicators for forestry and logging
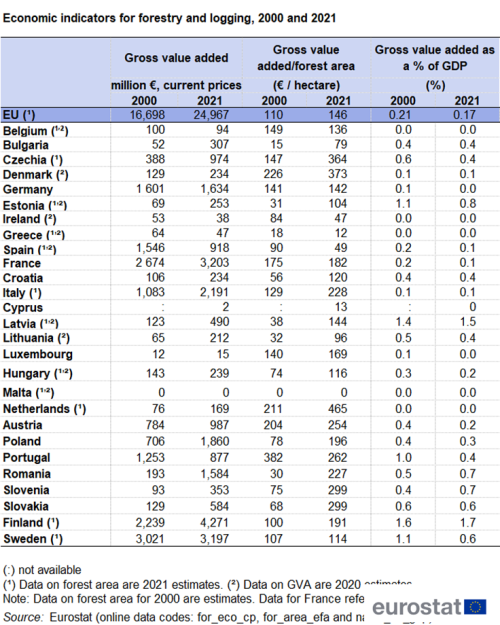
The value added of forestry and logging in economic terms is presented for the EU and Member States in Table 1. Total gross value added (GVA) generated by the forestry and logging industry in the EU was €25 billion in 2021. In absolute terms, these industries generated the greatest GVA in Finland (€4.3 billion), France and Sweden (€3.2 billion) in 2021. Please note that Table 1 shows GVA data for 2000 and 2021 in current prices (i.e. not corrected for inflation). Therefore, they cannot be used directly to make comparisons across time or comment on temporal trends. GVA values related to GDP, shown in the last columns, may better serve this purpose. They are also an indication of the economic importance of the forestry and logging industry in the total economy of the country.
Values in these latter columns show that the GVA of the forestry and logging industry represented 0.17 % of the GDP of the EU in 2021, which was 19 % less than the share of 0.21 % in 2000. The GVA generated by forestry and logging accounted for more than 1% of GDP in four Member States in 2000: Sweden, Estonia, Latvia and Finland. In 2021, it was still the case for two Member States (Latvia and Finland), and in both countries the relative contribution of the GVA of forestry and logging to the GDP increased during this period.
On average, forests of EU countries generated 146 €/ha of GVA in 2021. The largest GVA per forest area was estimated for the Netherlands (465 €/ha), Denmark (373 €/ha), and Czechia (364 €/ha) in 2021. This indicator needs to be interpreted with care when using it as a proxy to compare economic productivity of forestry and logging across the EU, as it may be affected by the types of activities performed by the forestry and logging sector.
Source: Eurostat (for_eco_cp), (for_area_efa) and (nama_10_gdp)
Employment and apparent labour productivity in forestry and logging
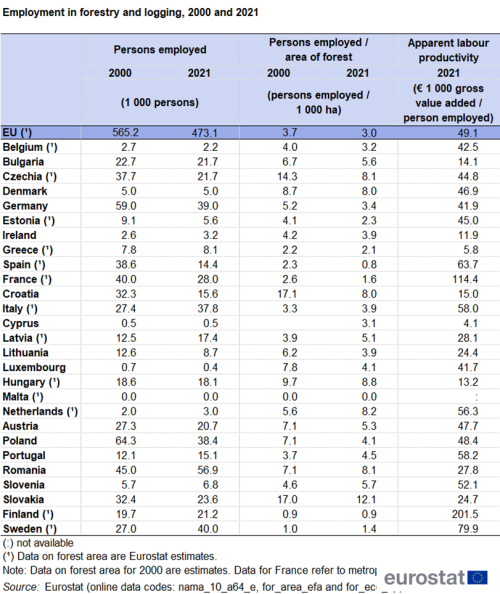
Table 2 informs about employment and apparent labour productivity within the EU’s forestry and logging sector, using National Accounts employment data. In the EU, about 473 100 persons worked in the forestry and logging sector in 2021, which represented a decrease of 16 % compared to year 2000. The largest workforce was recorded in Romania with 56900 persons, followed by Sweden (40 000 persons) and Germany (39 000 persons).
Source: Eurostat (nama_10_a64_e), (for_area_efa), (for_vol_efa) and (for_eco_cp)
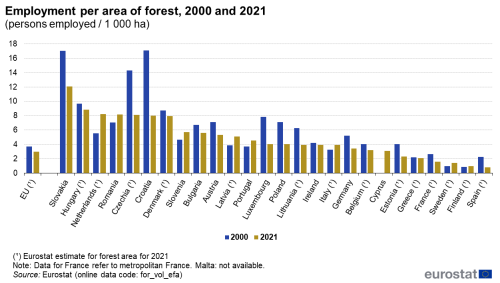
The ratio of labour input per area of forest gives an indication of the labour intensity of the sector across EU Member States. In 2021, its mean value for the EU was 3 employed persons per 1 000 hectares of forest. This indicator varied considerably between countries, ranging from around 12.1 employed persons per 1 000 hectares in Slovakia to less than one person per 1 000 hectares in Spain and Finland (see Table 2 and Figure 4) in 2021. Some of the differences across EU Member States may also reflect differences in management practices, the density of the timber stock, forest patch-size and connectivity, and the terrain.
(persons employed / 1 000 ha)
Source: Eurostat (nama_10_a64_e), and (for_area_efa)
The labour productivity of the forestry and logging sector (calculated as GVA per person employed) also varied substantially across EU Member States in 2021. Using this measure, the highest levels of labour productivity were recorded in Finland (€ 201 500 per person employed), France (€ 114 400 per person employed) and Sweden (€ 79 900 per person employed), while at the other end of the range, <10 000 € of GVA per person employed were generated in Cyprus (€ 4100 per person employed) and Greece (€ 5 800 per person employed). (see Table 2).
Source data for tables and graphs
Data sources
This article is based on Eurostat's annual data collection called European Forest Accounts (EFA). EFA collects essential data on traditional forest resources (wooded land and timber) and the economic activity of the forestry and logging industry. The data collection is voluntary and not all Member States report data annually. To estimate the values for the EU, missing data for Member States' who did not report for EFA were gap-filled - (i) data on the area of wooded from FAO - Forest Resources Assessment 2020; (ii) data on the volume of timber (stocks and flows) using the Carbon Budget Model and (iii) economic variables and employment from national accounts data.
The collection of forest accounts re-started in 2008 after a break of several years. As in the 1990s, it was known as Integrated Environmental and Economic Accounting for Forests (IEEAF). In 2016, the data-reporting questionnaire was revised with a task force of experts, to simplify the data collection and adapted to new needs, while continuing the time series on the economic aggregates of forestry and logging. The data collection was re-named to the current 'European Forest Accounts'.
In addition to EFA, Eurostat collects annual data on the production and trade in wood and wood products in the Joint Forest Sector Questionnaire (JFSQ). Statistics explained article Wood products - production and trade is based on JFSQ data.
Direct access to
- Eurostat's methodological section for forestry statistics and accounts
- Forest resources (ESMS metadata file — for_sfm_esms)
- Economics (ESMS metadata file — for_eaf_esms)
- European Forest Accounts Questionnaire (EFA)
