Archive:Fishery statistics
Data extracted in November 2020.
Planned article update: January 2022.
Highlights
This article gives an overview of recent statistics relating to fishing fleets, fish catches, fish landings and aquaculture production in the European Union (EU).
Fish are a renewable and mobile natural resource. Aside from aquaculture farming, fish are generally not owned until they have been caught. As such, fish stocks continue to be regarded as a common resource which needs to be managed collectively. This has led to a range of policies that regulate the amount of fishing at the EU level and more widely at sea basin level, as well as the types of fishing techniques and gear that can be used in fish capture.
The current common fisheries policy (CFP) of the EU [1] aims at an environmentally, economically and socially sustainable use of the common resource including aquaculture production. The CFP is a set of rules for managing EU fishing fleets and for conserving fish stocks. Designed to manage a common resource, it gives all EU fishing fleets equal access to EU waters and fishing grounds and allows fishermen to compete fairly. The current policy stipulates that between 2015 and 2020 catch limits should be set that are sustainable and maintain fish stocks in the long term. Based on EU legislation, Eurostat produces statistics on catches and landings of fishery products, aquaculture and the EU fishing fleet.
Full article
Fisheries: the factors of production
The EU’s fishing industry is managed. There is regulation on the amount of fishing at EU level and at sea basin level under the common fisheries policy (CFP). To better monitor and advise on this policy, there is interest in understanding the factors of production and how they are changing over time. These factors include the seas, fishing fleets and the labour force working in the fishing industry.
Seas and catch limits
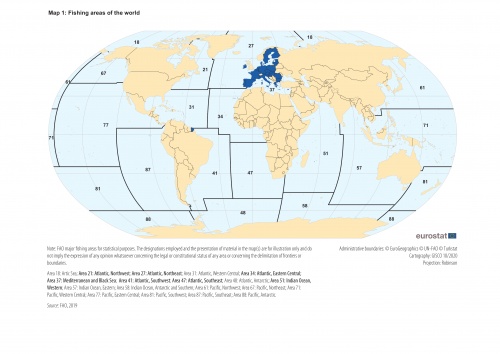
EU statistical regulations on catching fish cover seven marine areas [2]; these are the north-east Atlantic; north-west Atlantic; Mediterranean and Black Sea; eastern-central Atlantic: south-east Atlantic; south-west Atlantic; and, western Indian Ocean, within each of which are a number of seas. For example, within the north-east Atlantic region are, among others, the Barents Sea, the Norwegian Sea, the Baltic Sea, the North Sea, Iceland and Faroes Grounds, Rockall, West of Scotland, the Irish Sea, the Bay of Biscay, Portuguese Waters, Azores Grounds and East Greenland.
As a general rule, fishing vessels registered in the EU fishing fleet register have equal access to all the EU waters and resources that are managed under the CFP. Access to fisheries is normally authorised through a fishing license. The seas resources for most commercial fish species are, however, limited through total allowable catches that are set annually for various sea regions based on the scientific advice provided by advisory bodies like the International Council for the Exploration of the Sea and the Scientific, Technical and Economic Committee for Fisheries [3]. For 2018, the European Council agreed to increase or maintain the previous year’s catch limits for 53 stocks and reduce them for 25 stocks.
The proximity of a port to sea often determines the focus of fishing activities. For example, Denmark’s fishing industry focuses on the north-east Atlantic area. One exception is Spain, for whom fishing activities are spread out across the different regions of the Atlantic and Indian Ocean for which EU data are collected, as well as other seas around the world. This spread of fishing grounds reflects the search for fish that have coldwater, coolwater or warmwater requirements.
The EU fishing fleet is getting smaller in number, capacity and power
Reducing the fleet capacity is an essential tool for achieving a sustainable exploitation of fisheries resources under the CFP. The EU fishing fleet has declined steadily since the early 1990’s, in terms of both tonnage (an indicator of fish-holding capacity) and engine power (an indicator of the power available for fishing gear).
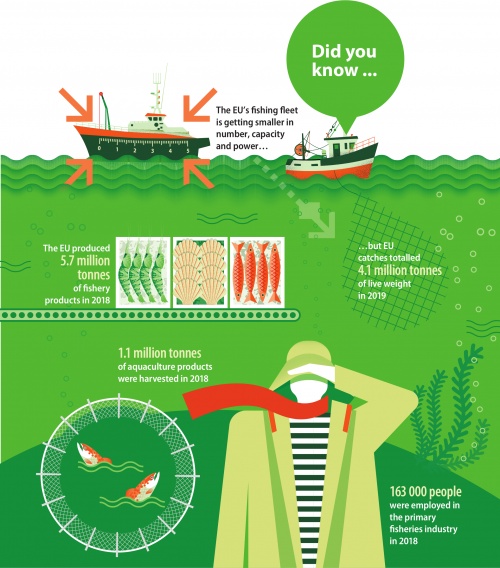
The EU fishing fleet continues to shrink. The number of active vessels in the EU-27 was 75 405 in 2019. These vessels had a combined capacity of 1.3 million gross tonnes and a total engine power of 5.3 million kilowatts (kW). Between 2013 and 2019, the number of vessels in the EU-27 declined by 6.4 %, the overall gross tonnage fell by 8.8 % and engine power was down 7.8 %.
The EU fishing fleet is diverse; Spain has the highest gross tonnage, France most power and Greece most vessels
The EU fleet is very diverse, with the vast majority of boats being no more than 10 metres long, and a small number of vessels exceeding 40 metres in length. The average size of an EU fishing boat in 2019 was 17.7 gross tonnes and the average engine power was 70.9 kW.
When measured by gross tonnage, Spain had, by far, the largest fishing fleet among Member States (24.9 % of the EU-27 total), followed by France (12.9 %) and Italy (11.0 %). When measured by engine power, however, the largest fleet was that in France (17.9 % of the EU-27 total), followed by Italy (17.4 %) and Spain (14.5 %).
When measured by the number of vessels, the largest fleet in the EU-27 was in Greece (19.8 % of all vessels), followed by Italy (16.0 %) and Spain (11.8 %). Greek vessels were generally small, with an average size of 4.7 gross tonnes, and an average engine power of 28.5 kW in 2019.

Source: (fish_fleet_alt)
By way of comparison, the overall holding capacity of the Norwegian fishing fleet was the largest in Europe (0.4 million tonnes in 2019 and +9.2 % on the capacity in 2018). It was also considerably more powerful at an average 228.7 kW per vessel than the average in the EU-27. The 1 600 fishing vessels of Iceland in 2019 were also much larger and more powerful than the EU-27 average, with an average holding capacity of 94.2 gross tonnage per vessel and 269.6 kW per vessel.
The fisheries industry provided jobs in the EU for about 163 600 people in 2018
An estimated 163 000 people were employed in the EU-27’s primary fisheries industry in 2018, of which about one third were employed in the aquaculture subsector. About one quarter (23.7 %) of employment in the primary fisheries industry of the EU-27 in 2018 was in Spain. Indeed, three quarters of EU employment in the industry was concentrated in just Spain, Italy, Greece, France and Portugal.
Italy, Greece and Portugal accounted for much higher proportions of employment in the EU fisheries industry than of fisheries production; together they accounted for 39.0 % of EU-27 employment in the industry, but only produced 13.0 % of production. Conversely, Denmark and the Netherlands had relatively low employment in fisheries (1.2 % and 1.8 % respectively of the EU total) but much higher shares of fisheries production (14.4 % and 8.2 % respectively). These contrasts highlight the differences between the fishing industries of some countries with a relatively large number of small vessels and others with a relatively small number of large vessels.
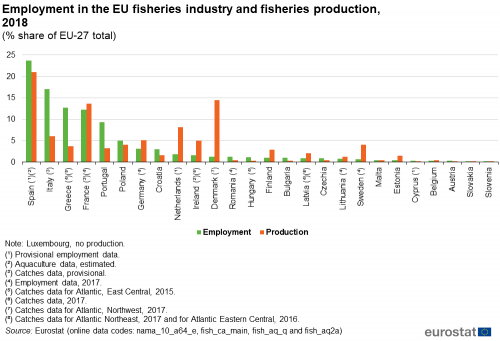
(% share of EU-27 total)
Source: Eurostat (nama_10_a64_e), (fish_ca_main), (fish_aq_q) and (fish_aq2a)
Fisheries production: catches and aquaculture
The monitoring of catches and aquaculture production is an essential tool for securing fish stocks and sustaining the common resources available in Europe’s large and rich fishing areas.
EU production of fishery products from catches and aquaculture estimated at 5.7 million tonnes in 2018
The EU-27’s [4] total production of fishery products in 2018 was an estimated 5.7 million tonnes of live weight equivalent (the mass or weight when removed from water). This represented about 3 % of the total world production of fishery products in 2018 [5].
Total production for the EU-27 in 2018 was down a little (-0.6 %) on the level in 2017 and considerably down (-18.5 %) on the corresponding level in 2000 (see Figure 3). The downward trend to 2012 and the subsequent upturn reflect parallel trends for catches, which account for four fifths of total fisheries production. This upturn in catches was despite a continued reduction in the size of the fishing fleet. The production of farmed aquatic organisms remained relatively stable.
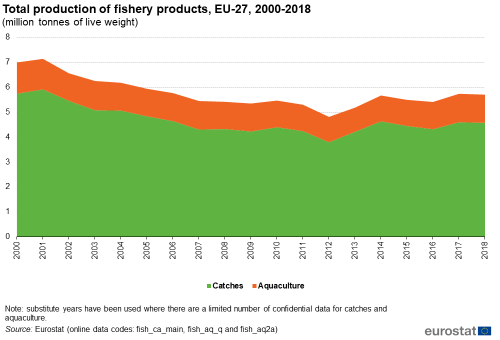
(million tonnes of live weight)
Source: Eurostat (fish_ca_main), (fish_aq_q) and (fish_aq2a)
About one half (49.0 %) of all EU-27 fisheries production from catches and aquaculture came from just three Member States in 2018; these were Spain (21.0 %), Denmark (14.4 %) and France (13.6 %). The slight decline in overall EU production in 2018, principally reflected the mixed developments in these three Member States: production in Spain was moderately lower (-1.5 %); production in Denmark fell back strongly (-12.5 %), almost entirely due to the lower catches in the Northeast Atlantic; and, production in France rose strongly (+7.8 %) driven by higher catches in the Northeast Atlantic and the Indian Ocean.
By way of comparison, it is interesting to note that total fisheries production in Norway (3.6 million tonnes of live weight in 2018) was about 80 % of that of the EU-27 as a whole. Total production in Iceland (1.3 million tonnes in 2018) was slightly higher than in Spain, the EU-27’s biggest fisheries producer. Production in the United Kingdom (0.9 million tonnes in 2018) was slightly higher than in Denmark, the EU-27’s second biggest fisheries producer.
EU catches in 2019 an estimated at 4.1 million tonnes of live weight
Fish catches cover fish, molluscs, crustaceans and other aquatic animals, residues and aquatic plants that are taken for all purposes, by all types and class of vessel, gear and fishermen, operated in all the seven marine areas legally covered by EU statistical regulations. They cover catches in high-sea fishing areas, offshore, inshore or brackish water areas. The production from aquaculture and catches in fresh water is excluded. Although figures for the total production of fishery products are only available for 2018, statistics on catches are available for 2019.
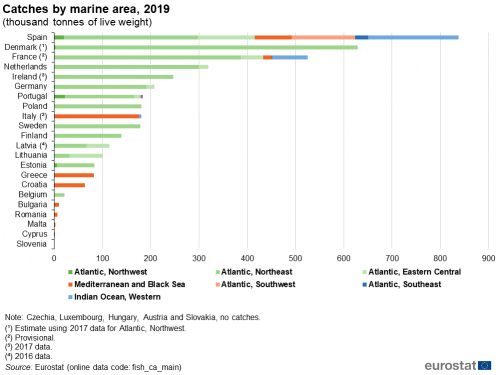
(thousand tonnes of live weight)
Source: Eurostat (fish_ca_main)
The total EU catch in 2019 was an estimated 4.1 million tonnes live weight, much less than the estimated 4.6 million tonnes in 2018. The level of catches in 2019 was back towards the low recorded in 2012.
The fishing fleets of Spain, Denmark, France and the Netherlands accounted for over one half (about 56 %) of the total amount of aquatic organisms caught by Member States in 2019 (see Figure 6.2.2). Catch levels were down in each of these countries, often sharply: they were moderately lower (-4.9 % or 43 000 tonnes less) in Spain; they were one fifth lower (-20.4 % or 160 000 tonnes less) in Denmark and in the Netherlands (-22.6 %); and, one tenth less (-10.6 %) in France. Catch levels in 2019 were lower than 2018 in many other Member States too, not least Germany (-20.7 %) and Sweden (-17.1 %). One of the main exceptions was the much higher catch level in Lithuania (+59.2 %), which was almost entirely from the higher catch in the Atlantic, Eastern Central area.
Spain and Portugal were the only Member States that took catches in all of the seven fishing areas covered by the EU catch statistics.
The vast majority of the EU catch is taken in the Atlantic, Northeast area
Although the European fishing fleet operates worldwide, about 70 % of all EU catches in the seven marine areas covered by EU statistical regulations were taken in the Atlantic, Northeast area (see Figure 5 and Map 1 for an overview of fishing areas). The key species caught in the Atlantic, Northeast area in 2019 were herring (21.3 % of the live weight caught in this region), sprat (14.8 %), blue whiting (10.1 %) and mackerel (8.4 %).
About one fifth (22.1 %) of the EU-27’s total live-weight catch in the Atlantic, Northeast area was made by the fishing fleet of Denmark. Together, France (13.6 %), the Netherlands (10.6 %) and Spain (9.8 %) accounted for another one third of catches in the region.
About one tenth of the total EU catch was taken in the Mediterranean and Black Sea, where the main species caught were sardines (23.6 % of the EU catch in the area) and anchovies (16.7 %). Two fifths of the total EU-27 catch in this area was by Italy, with Greece (18.9 %), Spain (17.4 %), and Croatia (14.7 %) accounting for the vast majority of the rest.
About 8 % of the total EU catch was taken in the Atlantic, Eastern Central area, where the main catches were skipjack and yellowfin tuna, sardines and mackerel. Among Member States, Spain (36.6 %) and Lithuania (21.4 %) together accounted for the majority of catches in the area.
About 7 % of the total EU catch was taken in the Indian Ocean, Western area, where the main catch was tuna, particularly skipjack, yellowfin and bigeye tuna. About 70 % of the EU-27 catch in the area was by Spain, and most of the rest by France.
Only 5 % of the total EU catch was taken in three remaining marine areas. The main species caught in these areas were the following: hake in the Atlantic, Southwest area; blue sharks and skipjack tuna in the Atlantic, Southeast area; and redfish, cod and halibut in the Atlantic, Northwest area.

(% share of total catches, thousand tonnes of live weight)
Source: Eurostat (fish_ca_main)
Aquaculture: 1.1 million tonnes of aquatic organisms produced in EU-27 in 2018, worth EUR 3.7 billion
Aquaculture is the production of fish and other aquatic organisms like molluscs and crustaceans under controlled conditions; it is an alternative to catching wild fish and takes place both inland and in marine areas. Aquaculture is a key component of both the CFP and the Blue Growth [6] agenda to support sustainable growth in the sector.
The EU-27 produced an estimated 1.1 million tonnes of aquatic organisms in 2018, corresponding to one fifth of the output of European fisheries as a whole. In terms of output, the EU’s aquaculture sector was the ninth largest worldwide, alongside Myanmar, with a 1.4 % share of the volume of global output in 2018 [7]. The value of aquaculture production in the EU-27 was an estimated EUR 3.7 billion in 2018, about two fifths of the total value of the EU’s total production of fishery products.
Four Member States produced about 70 % of the EU-27’s aquaculture output volume and 60 % of its value
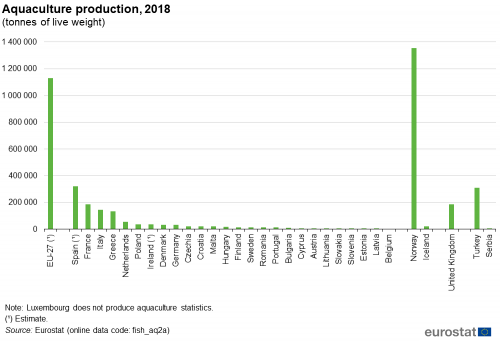
Four Member States were responsible for about 70 % of the EU’s total output in tonnes live weight of farmed aquatic organisms in 2018 (see Figure 6); Spain produced a little over one quarter (an estimated 28.2 %) of the total, followed by France (16.5 %), Italy (12.6 %) and Greece (11.7 %).
Different aquatic organisms fetch different prices. For instance, the average first sale prices for mussels were about EUR 1 per kg, for seabass were nearer EUR 6 per kg, and for tuna were about EUR 14 per kg. Among Member States, France had the highest value of aquaculture output in 2018 (an estimated EUR 687 million), representing about 18 % of the EU-27 total. The value of output was next highest in Spain (EUR 578 million in 2017), then in Greece (EUR 536 million) and Italy (EUR 439 million).
To put the EU-27’s aquaculture industry in some perspective, the value of aquaculture output in Norway exceeded that of the whole of the EU; Norway produced 1.4 million tonnes of aquatic organisms (almost exclusively salmon), worth EUR 7.1 billion in 2018. Norway was the world’s seventh largest producer in aquaculture fish production in 2018, with a 1.7 % global share. It was also the world’s second largest exporter of aquatic organisms, after China.
All fisheries production in the EU’s landlocked countries (Czechia, Hungary, Austria and Slovakia) comes from aquaculture (Luxembourg does not produce such data) and as much as 94.1 % of total fisheries production in tonnes live weight in Slovenia. In general, aquaculture plays a major role in the countries around the Mediterranean Sea and the Black Sea, where sea-fishing is generally carried out using small-scale vessels with an average capacity lower than the EU-27 average. This helps explain why aquaculture activity plays a relatively large role in the respective fisheries industries of Malta (accounting for 88.3 % of total fisheries production in tonnes live weight in 2018), Cyprus (83.3 %), Greece (63.1 %), Romania (61.4 %), Bulgaria (55.7 %) and Italy (41.4 %).
EU aquaculture production focussed on finfish species and molluscs
Finfish (particularly, trout, seabream, seabass, carp, tuna and salmon) and molluscs (particularly, mussels, oysters and clams) together accounted for almost all of aquaculture production by weight in the EU in 2018.
Rainbow trout were the most valuable species farmed in the EU in 2018, accounting for about 17 % of all aquaculture production. The farmed production of seabass, seabream, oysters and bluefin tuna were the next most valuable (see Figure 7).
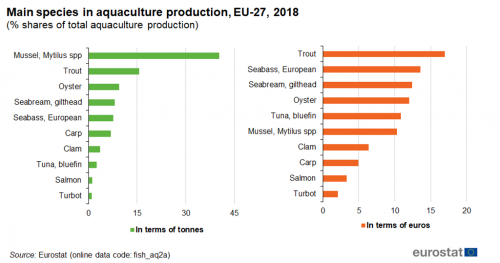
(% shares of total aquaculture production)
Source: Eurostat (fish_aq2a)
A high degree of country specialisation within the EU
Within the EU, the aquaculture sector is highly specialised at the level of EU Member States.
Spain produced about 7 in every 10 tonnes of the EU’s farmed Mediterranean mussels (Mytilus galloprovincialis) in 2018, largely due to its rafts in the estuaries of northern Spain using the ‘off bottom’ method. Blue mussels (Mytilus edulis) were farmed in the Atlantic, Northeast area by the Netherlands (about 37 % of the EU total in 2018) and France (about 36 %), and Ireland (an estimated 11 %). Both ‘off bottom’ (preferred in Ireland) and ‘on-bottom’ methods (preferred in the Netherlands) were used.
Greece produced about 61 % of the EU’s farmed production of gilthead seabream (Sparus aurata) and 55 % of European seabass (Dicentrarchus labrax) in 2018. Czechia and Poland were the leading EU producers of common carp (Cyprinus carpio), together producing about 45 % of the EU total. At world level, common carp was the third most farmed finfish species.
Within the EU, pacific cupped oysters (Crassostrea gigas) were produced mainly in France (about 86 % in 2018). Worldwide, about 30 % of all molluscs produced in 2018 were cupped oysters. Italy produced the vast majority (about 78 % in 2018) of the EU’s farmed Japanese carpet shell (Ruditapes philippinarum). At world level, it was the second most produced species among the molluscs (24 % of the total in 2018).
Atlantic bluefin tuna (Thunnus thynnus) were farmed in cages in only three Member States: Malta accounted for about 61 % of EU farmed production of bluefin tuna, the rest being produced in Spain and Croatia. While Malta and Croatia farmed Atlantic tuna in the Mediterranean Sea only, Spain also farmed a small proportion in the Atlantic, Northeast area.
Ireland was responsible for about 90 % of 13 000 tonnes of farmed salmon in the EU in 2018. However, the quantity farmed was far below the 156 000 tonnes farmed in the United Kingdom and the 1.3 million tonnes farmed in Norway. At world level, Atlantic salmon (Salmo salar) was the ninth most produced finfish species.
The production of farmed rainbow trout (Oncorhynchus mykis) in the EU is something of an exception to the general observation about country specialisation; rainbow trout were farmed in 23 EU countries. One-half of the farmed live-weight of rainbow production in the EU in 2018 came from the combined output of Italy and France (both about 19 % of the EU total) and Denmark (about 16 %). Fish were farmed either in inland freshwater (about four fifths of the total) or in the saltwater of the Atlantic, Northeast area, and mainly in tanks (about 60 %).
Steady level of EU aquaculture production volume but rising value
Between 2008 and 2018, the volume of EU aquaculture production remained relatively stable (see Figure 8). Nevertheless, the value of this output increased relatively steadily and was an estimated one third higher in 2018 than in 2008.
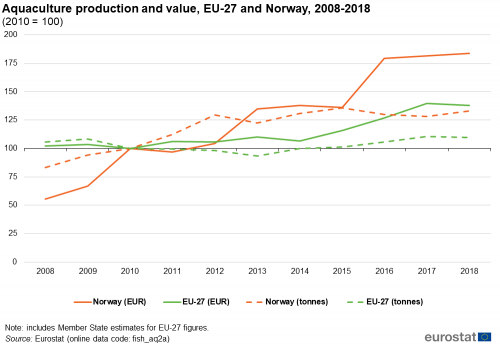
(2010 = 100)
Source: Eurostat (fish_aq2a)
During a similar period, there was a sharp increase in both the volume and value of Norwegian aquaculture production. The volume of aquaculture production in Norway bounced back in 2018 (+3.6 %) from the reduced level in 2017, which had been affected by a sea lice issue with salmon. The overall value of aquaculture production in 2018 was also higher than 2017 (+1.4 %).
Landings
Eurostat’s landings statistics relate to fishery products (product weight and value) landed by EU/EAA vessels on EU/EAA territory. Landings from non EU/EAA vessels or landings outside the EU/EAA territory are excluded. Landlocked EU countries without a marine fishing fleet are not included.
About 3.8 million tonnes (product weight) landed in EU in 2019
A mixture of confidential and, as yet, unavailable figures for 2019 concerning some of the key fishing Member States means that the estimates for the EU could be subject to considerable revision. It is for this reason that EU figures are presented in broad terms. Nevertheless, they give a clear indication of the size of the industry and its importance in some Member States.
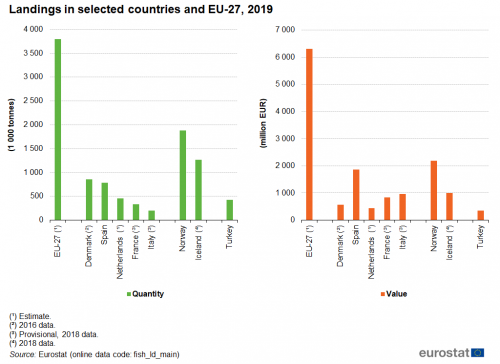
The amount of fish landed in the EU in 2019 is estimated to have been about 3.8 million tonnes product weight.
Denmark accounted for about one fifth (0.9 million tonnes in 2016) of the EU landings, Spain another fifth (0.8 million tonnes in 2019) and the Netherlands about one tenth (an estimated 0.5 million tonnes in 2019).
Among the Member States for which 2019 data are available, the quantity of landings was down considerably in the Netherlands (an estimated -17.0 % or 93 000 tonnes) and in Poland (-10.7 % or 13 000 tonnes), but higher in Portugal (+13.8 % or 18 000 tonnes) and Estonia (+27.5 % or 17 000 tonnes). By way of comparison, landings to ports in Norway were moderately lower than in 2018 (-2.9 % or 56 000 tonnes) at 1.9 million tonnes.
Quantity and value of EU landings down slightly in 2019
The estimated fall in the quantity of total fishery products landed in the EU in 2019 looks to have been accompanied by a decline in the value of landings to an estimated total of EUR 6.3 billion (see Figure 9). Nevertheless, it should be borne in mind that this figure is subject to data availability.
Among Member States for which 2019 data are available, the value of the fish landed in Spain was higher than in any other Member State, reflecting the high value attached to its landings of species like tuna, hake, swordfish, squid and pilchards. However, the value of landings in Spain fell to EUR 1.9 billion in 2019. The value of landings in the Netherlands fell sharply (-23.3 % on the value in 2018) to EUR 0.4 billion. In contrast, the value of landings in Portugal increased sharply (+16.0 % on 2018) to EUR 0.3 billion.
Source data for tables and graphs
Data sources
Fisheries statistics are collected by Eurostat from official national sources for the EU Member States and members of the European Economic Area (EEA). The statistics are collected using internationally agreed concepts and definitions developed by the Coordinating Working Party (CWP), comprising Eurostat and several other international organisations with responsibilities in fisheries statistics.
European fisheries production statistics include production from catches and aquaculture. Catches refer to fishery products taken for all purposes (commercial, industrial, recreational and subsistence) by all types and classes of fishing units (including fishermen, vessels, gear, and so on). The flag of the fishing vessel is used as the primary indication of the nationality of the catch. In addition to catches, Eurostat also collects statistics on landings which relate to all fishery products (expressed as product weight) landed in the reporting country, regardless of the nationality of the vessel making the landings. Landings by vessels of the reporting country in non-EU ports and imported into the EU are to be included as well. Aquaculture production refers to the farming of aquatic (freshwater or saltwater) organisms, under controlled conditions. Aquaculture implies some form of intervention in the natural rearing process such as regular stocking, feeding and protection from predators. Farming also implies individual or corporate ownership of the stock being cultivated.
Catch statistics are submitted to Eurostat by EEA member countries in compliance with the following EU legislation:
- Regulation (EC) No 218/2009 of the European Parliament and of the Council of 11 March 2009 on the submission of nominal catch statistics by Member States fishing in the North East Atlantic (OJ L87 of 31.03.2009);
- Regulation (EC) No 217/2009 of the European Parliament and of the Council of 11 March 2009 on the submission of catch and activity statistics by Member States fishing in the North-West Atlantic (OJ L87 of 31.03.2009);
- Regulation (EC) No 216/2009 of the European Parliament and of the Council of 11 March 2009 on the submission of nominal catch statistics by Member States fishing in certain areas other than those of the North Atlantic (OJ L87 of 31.03.2009, p.1).
The statistics are reported as the live weight equivalent of the landings (in other words, the landed weight of a product to which an appropriate conversion factor has been applied). Therefore excluded are quantities of fishery products which are caught but not landed. For statistics on landings, each country reports annual data on the quantities and values of fishery products landed in its ports under the terms of Regulation (EC) No 1921/2006 of 18 December 2006 on the submission of statistical data on landings of fishery products in EU Member States and repealing Council Regulation (EEC) No 1382/91 (OJ L403 of 30 December 2006). For aquaculture statistics, the national authorities submit aquaculture production statistics to Eurostat under the terms of Regulation (EC) No 762/2008 of 9 July 2008 on the submission by Member States of statistics on aquaculture and repealing Council Regulation (EC) No 788/96 (OJ L218 of 13.08.2008).
Concerning the fishing fleet, statistics for the EU Member States are derived from the Community Fishing Fleet Register maintained by the European Commission’s Directorate-General for Maritime Affairs and Fisheries. Statistics for Iceland and Norway are compiled from fleet files submitted by national authorities.
Symbols
In order to improve readability, only the most significant meta-information has been included under the tables and figures. The following symbols are used, where necessary:
- Italic data value is forecasted, provisional or estimated and is likely to change
- ‘:’ not available or confidential
- ‘-’ not applicable
Context
The common fisheries policy (CFP) of the EU [8] aims at an environmentally, economically and socially sustainable use of the common resource including aquaculture production. The CFP is a set of rules for managing EU fishing fleets and for conserving fish stocks. Designed to manage a common resource, it gives all EU fishing fleets equal access to EU waters and fishing grounds and allows fishermen to compete fairly. The current policy stipulates that between 2015 and 2020 catch limits should be set that are sustainable and maintain fish stocks in the long term. Based on EU legislation, Eurostat produces statistics on catches and landings of fisheries products, aquaculture and the EU fishing fleet.
The European Commission has proposed a new fund to invest in the maritime economy and support fishing communities. The European Maritime and Fisheries Fund will continue to support the European fisheries sector towards more sustainable fishing practices, with a particular focus on supporting small-scale fishermen. It will co-finance projects alongside national funding streams, with each EU Member State receiving a share of the total budget.
Direct access to
- Catches in all fishing regions (tag00076)
- Catches in the north-west Atlantic (tag00079)
- Catches in the north-east Atlantic (tag00078)
- Catches in the eastern central Atlantic (tag00080)
- Catches in the Mediterranean (tag00081)
- Aquaculture production, Total (tag00075)
- Fishing fleet, Total engine power (tsdnr420)
- Fishing fleet, Total tonnage (tag00083)
- Fishing Fleet, Number of Vessels (tag00116)
- Total fishery production (catch + aquaculture) (fish_pr)
- Catches by fishing area (fish_ca)
- Aquaculture production (fish_aq)
- Landings of fishery products (fish_ld)
- Fishing fleet (fish_fleet)
- Agriculture, forestry and fishery statistics — 2020 edition (statistical book)
- Fishery statistics — Data 1995–2008 (pocketbook)
- Statistical data on the landings of fishery products in Member States and European Economic Area countries for 2008 — Data in focus 16/2010
- The EU-27 fishing fleet continued to decline in 2008 — Data 2005–2008 — Statistics in focus 49/2009
- Aquaculture production by species (ESMS metadata file — fish_aq_esms)
- Catches by fishing area (ESMS metadata file — fish_ca_esms)
- Fishing fleet (ESMS metadata file — fish_fleet_esms)
- Catch statistics:
Regulation (EC) No 216/2009 of the European Parliament and of the Council of 11 March 2009 on the submission of nominal catch statistics by Member States fishing in certain areas other than those of the North Atlantic (Summary)
Regulation (EC) No 217/2009 of the European Parliament and of the Council of 11 March 2009 on the submission of catch and activity statistics by Member States fishing in the North-West Atlantic (Summary)
Regulation (EC) No 218/2009 of 11 March 2009 of the European Parliament and of the Council on the submission of nominal catch statistics by Member States fishing in the North-East Atlantic (Summary)
- Aquaculture:
Regulation (EC) No 762/2008 of the European Parliament and of the Council of 9 July 2008 on the submission by Member States of statistics on aquaculture and repealing Council Regulation (EC) No 788/96 (Summary)
- Landings:
Regulation (EC) No 1921/2006 of the European Parliament and of the Council of 18 December 2006 on the submission of data on the landings of fishery products in Member States (Summary)
- Fishing fleet:
Commission Regulation (EC) No 26/2004 of 30 December 2003 on the Community fishing fleet register
Commission Implementing Regulation (EU) 2017/218 of 6 February 2017 on Union fishing fleet register
Notes
- ↑ See, http://ec.europa.eu/fisheries/cfp/index_en.htm.
- ↑ Food and Agriculture Organization of the United Nations (FAO) major areas 21, 27, 34, 37, 41, 47, 51 (see Map 1).
- ↑ For further information, see the European Commission’s common fisheries policy website.
- ↑ Figures on catches and landings for the EU exclude the EU’s landlocked Member States (Czechia, Luxembourg, Hungary, Austria and Slovakia). Luxembourg does not collect aquaculture statistics.
- ↑ The state of world fisheries and aquaculture, 2020 – FAO, available at: http://www.fao.org/3/ca9229en/online/ca9229en.html#fig3.
- ↑ For more information, see the maritime affairs section on the European Commission’s website.
- ↑ The state of world fisheries and aquaculture, 2020 — FAO, available at http://www.fao.org/3/ca9229en/online/ca9229en.html#fig3, where it is noted that China dominates world aquaculture production (67.9 % of the total in 2018).
- ↑ http://ec.europa.eu/fisheries/cfp/index_en.htm.
