European Neighbourhood Policy - South - international trade in goods statistics
Data extracted in March 2023.
Planned article update: April 2024.
Highlights
All of the European Neighbourhood Policy-South countries that have reported data, recorded deficits for trade in goods since 2016, with the exception of Libya in 2017-2019 and Algeria in 2021.
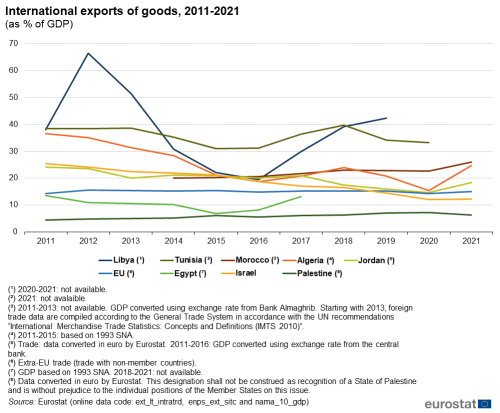
Morocco increased the ratio of exports of goods to GDP by 5.9 pp during the period 2014-2021, by far the largest increase among the European Neighbourhood Policy-South countries.
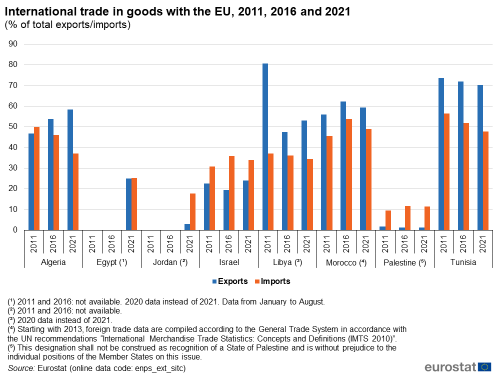
In 2021, the highest share of total exports to the EU was recorded by Tunisia (70.2 %), while the highest share of total imports from the EU was recorded by Morocco (48.9 %).
(% of total exports/imports)
Source: Eurostat (enps_ext_sitc)
This article is part of an online publication and provides data on international trade in goods for 8 of the 10 countries that form the European Neighbourhood Policy-South (ENP-South) region — Algeria, Egypt, Israel, Jordan, Libya, Morocco, Palestine [1] and Tunisia; no recent data are available for Syria or, for international trade, for Lebanon.
The article highlights some of the key indicators for tracing developments in the international trade in goods of the ENP-South region over the period 2011-2021, with information on exports, imports and the trade balance. It is followed by an examination of trade between ENP-South countries and the EU from the perspective of the ENP-South countries, using data reported by the ENP-South countries themselves. It also presents an analysis of international trade between the regions by broad product groups (based on the standard international trade classification (SITC)).
Full article
Exports, imports and the trade balance
International trade statistics track the value and quantity of goods traded between countries. They are the official source of information on exports, imports and the trade balance, i.e. the difference between imports and exports.
Long term global trends have seen trade increasing as a proportion of gross domestic product (GDP) in most countries. This has been an important element of globalisation, although far from the only one. Countries that are growing fast or are undergoing or recovering from economic difficulties may wish to run trade deficits, in which the value of imports is greater than that of exports. Countries that specialise in providing services to the rest of the world, such as tourism or business services, may also run consistent trade deficits, since services are not included in the statistics of exports and imports of goods. The balance of payments includes data on trade both in goods and in services.
Exports and imports as a percentage of GDP are often used as a measure of a country’s openness to world trade. Smaller countries tend to have higher levels of trade openness than larger ones, since there are fewer opportunities for buying and selling domestically produced goods. The relationship between trade openness and income (measured as GDP per capita) is more complicated, although low income countries generally have low trade openness.
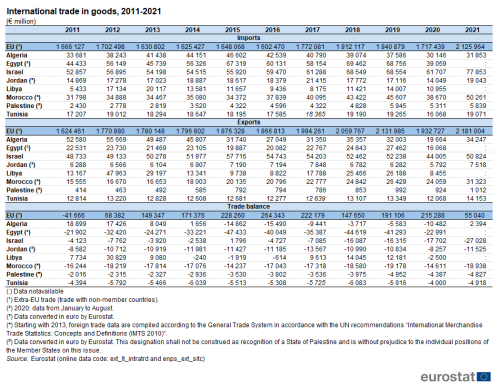
Table 1 shows the basic data on exports, imports and the balance of payments in million euro. The data in Figures 1, 2 and 3, respectively, show the trends in exports, imports and trade balance of the European Neighbourhood Policy-South countries and the EU as a percentage of GDP. They allow a focus on the relative importance of trade flows and trade balance to the size of these economies.
The main interest of Table 1 is to show the absolute sizes of the trade flows. Looking at 2021 data, the largest exporter of goods among the ENP-South countries was Israel (€50.8 billion), followed by Algeria (€34.2 billion), Morocco (€31.3 billion) and Egypt (€16.1 billion - 2020 data). The export values of Tunisia (€14.2 billion) and Libya (€8.5 billion - 2020 data) were about half the values of Algeria and Egypt, respectively, with Jordan (€7.5 billion) at an even lower level. Palestine (€1.0 billion) had considerably smaller exports than the other ENP-South countries.
Every ENP-South country for which recent data is available experienced a substantial growth in international trade in goods from 2020 to 2021, after the sharp global downturn in economic activity and trade during the first phases of the COVID-19 pandemic of the previous year. The largest growth in exports was recorded by Algeria (+74.2 %), followed with some distance by Morocco (+30.2 %), Jordan (+29.8 %) and Tunisia (+17.3 %). In Israel, exports in goods rose by 15.5 %, while Palestine experienced smaller increase (+9.6 %). Following the same trend as the ENP-South countries, the EU also saw a growth in exports of goods between 2020 and 2021, by 12.8 %.
Over the period 2011-2021, including the period of the COVID-19 pandemic, Palestine had the largest annual average export growth rate at 9.3 %, although from a low base. Morocco had the second highest growth rate over this period, at 7.3 %, although this figure may have been affected by a break in the time series in 2013 as the country adopted the general system of trade. Jordan’s annual average exports growth was 1.8 % and Tunisia’s was 1.0 %. Israel’s exports increased slightly by an annual average of 0.4 %. In contrast, Algeria’s exports decreased by an average of 4.2 %.
In 2021, the largest importer in the ENP-South region was Israel (€77.9 billion), followed by Morocco (€50.3 billion), Egypt (€39.1 billion - 2020 data) and Algeria (€31.9 billion). Smaller importers were Tunisia (€19.1 billion), Jordan (€19.0 billion), Libya (€11.0 billion - 2020 data) and Palestine (€5.8 billion).
Between 2020 and 2021, Morocco was also the ENP-South country with the largest increase in imports, with a steep growth of 30.0 %. Israel recorded the second largest increase in imports of goods, with +26.2 %. Smaller increases were observed in Tunisia (+18.7 %), Palestine (+9.9 %) and Algeria (+5.7 %). The EU also registered a notable growth in imports of goods from 2020 to 2021, by 23.8 %.
The fastest growing importer over 2011-2021 was again Palestine, albeit from a relatively low base, at an annual average increase of 9.2 %. Thereafter followed Morocco and Israel, at 4.7 % and 3.9 %, respectively, although the break in the series in 2013 in Morocco may have affected this result. Next was Jordan, at 2.5 %. Tunisia’s imports increased by an annual average of 1.0 % over 2011-2021. Algeria was the only country where imports diminished compared to 2011, falling by an annual average of 0.6 % from 2011 to 2021.
In 2021, the EU’s exports of goods were more than 13 times as large as the ENP-South as a whole (most recent data for Egypt – 2020 and Libya – 2020) and its imports more than 8 times as large. The EU’s exports grew by an annual average of 3.0 % over 2011-2021, while its imports increased by 2.5 %.
(€ million)
Source: Eurostat (ext_lt_intratrd) and (enps_ext_sitc)
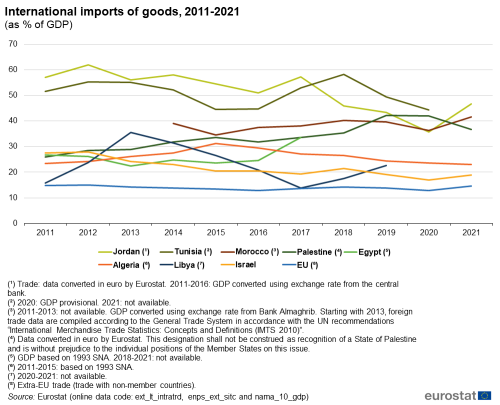
Figures 1 and 2 present exports and imports of goods as percentages of gross domestic product (GDP), respectively. These are measures of the importance of international trade flows to each economy, and are comparable both over time and between countries. Openness to trade is reported as either the sum or the average of these two ratios – the sum will be used in the following analysis.
Among the five ENP-South countries for which 2021 data are currently available, Morocco and Algeria had the highest ratio of exports to GDP, at 25.9 % and 24.8 %, respectively. Jordan had the greatest ratio of imports to GDP, at 46.7 %. Morocco had the second highest ratio of imports to GDP, at 41.6 %. Summing up the exports and imports ratios, Morocco registered the greatest openness to trade among the ENP-South countries for which data are available for 2021, at 67.6 % of GDP. It was followed by Jordan with the openness to trade at 65.1 % of GDP. Over the period 2011-2021, Palestine, Libya, and Morocco, which has the largest trade turnover, also represented the greatest increase in trade openness in the region, up by 12.7 percentage points (pp), 11.4 pp and 8.5 pp respectively.
However, even higher trade openness was recorded for Tunisia, ENP-South country for which 2021 data is not available. In 2020, Tunisia’s exports were equal to 33.2 % of its GDP and its imports to 44.3 % of GDP. Thus, Tunisia’s degree of openness was 77.5 % in 2020. However, it represented a decrease by 12.5 pp since 2011.
(as % of GDP)
Source: Eurostat (ext_lt_intratrd), (enps_ext_sitc)andTemplate:Stablelink
In 2021, Jordan’s import accounted 46.7 % of GDP, while its export equalled 18.4 % of GDP. Between 2011 and 2021 in Jordan the values of both import and export as the percentage of GDP decreased by 10.4 and 5.7 pp, respectively.
Palestine was among the countries which showed a growth in export and import values as the percentage of GDP by 1.9 and 10.8 pp, respectively, between 2011 and 2021. Palestine’s exports represented 6.4 % and imports 36.7 % of its GDP in 2021, giving a degree of openness at 43.0 % of GDP, an increase by 12.7 pp compared to 2011.
In 2021, Algeria had a ratio of imports to GDP of 23.1 % and of exports to GDP of 24.8 %, giving a trade openness of 47.8 %. Over the period 2011-2020, Algeria’s openness to trade declined each year except 2018 and 2021. Between 2011 and 2021 the trade openness of the country decreased by 12.2 pp.
Egypt’s exports were equivalent to 13.2 % of its GDP and its imports to 33.7 % in 2017 (more recent data not available). Between 2011 and 2016, Egypt’s trade openness fluctuated with growths and declines generally interchanging year-on-year. Since 2011, its degree of openness had risen by 6.5 pp, mainly caused by a rise in trade openness by 14.0 pp from 2016 to 2017. The main component was a sharp increase in imports in 2017, accompanied by a considerable rise also in exports. Egypt’s openness to trade was 46.8 % of GDP in 2017.
In 2021, Israel’s exports accounted for 12.3 % of GDP and its imports for 18.9 % of GDP, with an openness to trade at 31.2 % of GDP. This was a decrease by 21.8 pp compared to 2011, with the openness falling each year except 2021.
Data on Libya’s exports and imports are only available until 2019, with exports at 42.5 % and imports at 22.7 % of its GDP, respectively, giving a degree of openness at 65.2 % of GDP in 2019 and presenting an increase by 11.4 pp compared to 2011.
The EU’s exports of goods to the rest of the world were equivalent to 15.0 % and its imports to 14.6 % of its GDP in 2021, yielding a degree of trade openness of 29.6 %. This was an increase of only 0.6 pp compared to 2011. Over most of the period, the EU’s trade openness ranged between 28.8 % and 30.5 % of GDP, falling slightly below this level only in 2016 and 2020.
(as % of GDP)
Source: Eurostat (ext_lt_intratrd), (enps_ext_sitc)and (nama_10_gdp)
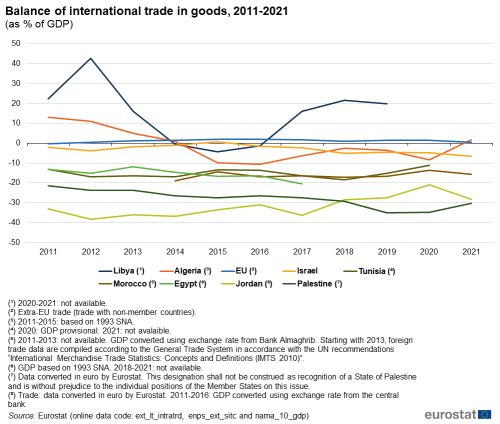
Figure 3 shows the balance of trade in goods for the ENP-South countries and the EU as a percentage of GDP during the period 2011-2021. This provides a measure of the size of trade surpluses and deficits that is comparable over time and between countries. Countries’ ability to run trade deficits depends on many factors, including their non-goods international earnings from items such as provision of services, including tourism; factor earnings, including from labour; and remittances from abroad.
Over the period 2011-2021, the ENP-South countries have generally been running trade deficits for goods, although at different levels. The only countries to run trade surpluses not stable over the period were the hydrocarbon exporters Algeria and Libya, as well as, to a more modest extent, Israel in 2015.
The largest trade deficits in the ENP-South region were registered by Jordan, with its deficit at its greatest magnitude in 2012, at 38.4 % of GDP, followed by high deficits also in the subsequent two years (36.0 % in 2013; 36.8 % in 2014). Deficits were slightly smaller but rather similar before and after this peak period, with deficits above 28 % of GDP each of these years, except in 2020. In 2021, the value of trade deficit for Jordan was 28.2 % of GDP.
Palestine experienced substantial trade deficits for goods between 2011 and 2021, with the largest deficits at 35.1 % in 2019, 34.7 % in 2020 and 30.3 % in 2021. Between 2011 and 2013 its trade deficits ranged from 21.5 % to 23.8 %, while between 2014 and 2018, they varied between 26.3 % and 29.1 %.
Trade deficits in Egypt through 2011 to 2016 remained roughly at the same level, ranging from 11.9 % in 2013 to 16.6 % in 2015, before reaching a peak at 20.5 % in 2017, the most recent data available.
Morocco also ran consistent trade deficits for goods from 2014-2021. Following deficits above 13 % of GDP over the whole period, with the largest deficit recorded in 2014 at 19.0 %, the deficits stabilised at a somewhat lower level in the subsequent years, at between 17.2 % in 2018 and 14.3 % in 2015, before falling to the smallest deficit of the period at 13.7 % of GDP in 2020, which followed by a growth to 15.7 % of GDP in 2021.
Tunisia ran a fairly consistent goods trade deficit between 2011 and 2020, the most recent data available. The smallest deficit in this period was at 11.0 % of GDP in 2020 and the largest at 18.5 % in 2018.
Algeria started the period with a surplus of 13.2 % of GDP in 2011, which decreased to a surplus of 1.0 % of GDP in 2014. A continuous decline in the trade balance occurred in the following years, with the balance turning into a deficit of 9.9 % by 2015 and reaching its lowest point with a deficit of 10.7 % of GDP in 2016. The deficit has been more moderate in the years since, ranging from 2.5 % in 2018 to 8.2 % in 2020. In 2021, Algeria recorded a surplus of 1.7 % of GDP.
Israel has maintained a modest although somewhat deteriorating trade deficit over 2011-2021. The trade balance started the period in 2011 with a 2.2 % deficit. The trade balance subsequently improved, to the only surplus of the period at 0.7 % in 2015, before moving into deficit again. The trade balance then deteriorated to a deficit of 5.0 % of GDP in 2018 and reached its peak of 6.5 % deficit in 2021. Between 2011 and 2013, Libya ran a significant trade surplus ranging from 16.0 % of GDP to its peak of 42.8 % of GDP in 2012. There was a modest trade deficit between 2014 and 2016 with its peak at -4.4 % of GDP in 2015, followed by substantial surplus during 2017-2019 ranging between 16.2 % of GDP in 2017 and 21.6 % of GDP in 2018.
The EU’s trade balance as a percentage of GDP has ranged from a deficit of 0.4 % in 2011 to a surplus of 2.1 % in 2016. In 2021, the surplus stood at 0.4 % of GDP.
(as % of GDP)
Source: Eurostat (ext_lt_intratrd), (enps_ext_sitc) and (nama_10_gdp)
Trade between the EU and ENP-South countries
Figure 4 shows each country’s exports and imports with the EU for 2011, 2016 and 2021 as shares of their total exports and imports of goods.
In 2021, the EU accounted for a majority of the exports of goods from Tunisia, at 70.2 % of Tunisia’s total trade in goods, while imports to Tunisia from the EU amounted to 47.8 % of the total. The share of imports from the EU had fallen sharply across the last decade, by 8.6 pp from a share of 56.4 % in 2011 and to 47.8 % in 2021. Morocco was the ENP-South country with the highest share of imports coming from the EU in 2021, with 48.9 % of its total imports of goods. Exports to the EU accounted for 59.4 % of the total, the second highest among the ENP-South countries. Algeria ranked third for trade in goods with the EU, importing 37.1 % of its total from the EU and exporting 58.5 % to the EU, followed by Libya importing 34.5 % of its total from the EU and exporting 53.0 % to the EU. In Egypt, the EU’s share of both imports and exports was around one quarter in 2020, at 25.3 % and 25.0 %, respectively; however, Egypt’s 2020 data relates to partial data (data for the first eight months of the year). The EU accounted for 24.0 % of Israel’s exports in 2020 and 34.0 % of its imports. The EU was the source of 11.4 % of Palestine’s imports and almost none of its direct exports (1.2 %) in 2021.

(% of total exports/imports)
Source: Eurostat (enps_ext_sitc)
Trade in goods by broad group of products
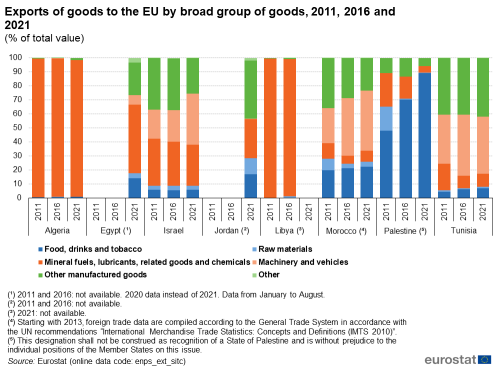
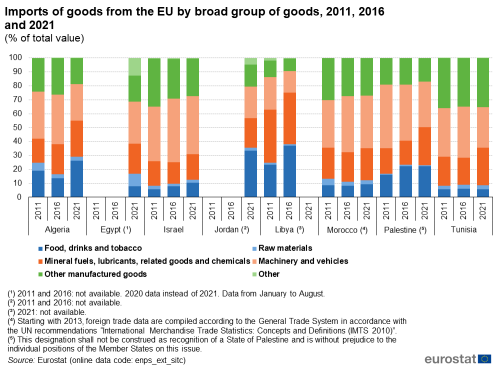
For each of the European Neighbourhood Policy–South countries, figures 5 and 6 provide a breakdown of their exports and imports to and from the EU in million euro, analysed by broad group of goods and presented as shares of total trade flows. The ten main sections of the Standard international trade classification (SITC Rev.4) have been grouped into six product groups for the purpose of this analysis.
Looking at Figure 5, exports from Algeria to the EU in 2021 almost exclusively (97.4 %) consisted of ‘Mineral fuels, lubricants, related goods and chemicals’ (SITC sections 3 and 5), although unsurprising for a hydrocarbons producer. The same group of goods entirely dominated in the exports of Libya, 97.8 % in 2016 (no later data available). The largest share of Egypt’s exports to the EU, 48.9 % in 2020 (no 2021 data available), also consisted of this product group. It has to be noted that Egypt’s 2020 data relates to partial data (data for the first eight months of the year). ‘Other manufactured goods’ (which cover SITC sections 6 and 8) accounted for a further 23.5 % of Egypt’s exports to the EU. ‘Machinery and vehicles’ (SITC section 7) provided 36.6 % of Israel’s exports of goods to the EU in 2021; ‘Mineral fuels, lubricants, related goods and chemicals’ provided further 29.1 % and ‘Other manufactured goods’ 25.5 %. ‘Other manufactured goods’ accounted for 41.3 % of Jordan’s exports to the EU in 2021, followed by ‘Mineral fuels, lubricants, related goods and chemicals’, with 27.7 %. ‘Food, drinks and tobacco’ (SITC sections 0, 1 and 4) and ‘Raw materials’ completed the picture with 17.0 % and 11.6 %, respectively. ‘Machinery and vehicles’ made up 42.9 % of Morocco’s exports to the EU in 2021, followed by ‘Other manufactured goods’ (23.4 %) and ‘Food, drinks and tobacco’ (22.3 %). ‘Other manufactured goods’ accounted for 41.7 % of Tunisia’s exports to the EU in 2021 and ‘Machinery and vehicles’ for 40.8 %. As highlighted by Figure 4, Palestine’s direct exports to the EU are marginal. Nevertheless, 89.1 % of them were made up by ‘Food, drinks and tobacco’.
(% of total value)
Source: Eurostat (enps_ext_sitc)
Figure 6 shows that 26.1 % of Algeria’s imports of goods from the EU consisted of ‘Mineral fuels, lubricants, related goods and chemicals’ in 2021, together with a further 26.1 % of ‘Food, drinks and tobacco’, 26.0 % of ‘Machinery and vehicles’ and 18.8 % of ‘Other manufactured goods’. Egypt’s imports in 2020 (no 2021 data available) from the EU included 30.1 % ‘Machinery and vehicles’, 21.7 % ‘Mineral fuels, lubricants, related goods and chemicals’ and 18.9 % ‘Other manufactured goods’. It has to be noted that Egypt’s 2020 data relates to partial data (data for the first eight months of the year). Israel’s imports of goods from the EU in 2021 were made up of 41.7 % of ‘Machinery and vehicles’, 26.9 % of ‘Other manufactured goods’ and 18.4 % of ‘Mineral fuels, lubricants, related goods and chemicals’. Jordan’s imports of goods from the EU in 2021 mainly consisted of 33.5 % of ‘Food, drinks and tobacco’, 22.5 % of ‘Machinery and vehicles’, 21.5 % of ‘Mineral fuels, lubricants, related goods and chemicals’ and 15.9 % of ‘Other manufactured goods’. ‘Mineral fuels, lubricants, related goods and chemicals’ dominated Libya’s imports of goods from the EU in 2016 (more recent data not available), with 37.1 % while ‘Food, drinks and tobacco’ closely followed with 36.9 %. Morocco’s imports from the EU consisted of 37.6 % of ‘Machinery and vehicles’, 27.1 % of ‘Other manufactured goods’ and 23.0 % of ‘Mineral fuels, lubricants, related goods and chemicals’. Palestine’s limited imports from the EU included 32.5 % ‘Machinery and vehicles’, 27.4 % ‘Mineral fuels, lubricants, related goods and chemicals’ and 22.2 % of ‘Food, drinks and tobacco’. Tunisia’s imports from the EU in 2021 comprised 35.2 % ‘Other manufactured goods’, 29.3 % ‘Machinery and vehicles’ and 26.9 % ‘Mineral fuels, lubricants, related goods and chemicals’.
(% of total value)
Source: Eurostat (enps_ext_sitc)
Source data for tables and graphs
Data sources
The data for ENP-South countries are supplied by and under the responsibility of the national statistical authorities of each country on a voluntary basis. The majority of the data presented in this article result from an annual data collection cycle that has been established by Eurostat. No recent data are available from Syria. These statistics are available free-of-charge on Eurostat’s website, together with a range of different indicators covering most socio-economic areas. More data are available from the United Nations’ Comtrade database.
Tables in this article use the following notation:
| Value in italics | data value is forecasted, provisional or estimated and is therefore likely to change; |
| : | not available, confidential or unreliable value; |
| – | not applicable. |
Context
The EU has a common international trade policy, often referred to as the common commercial policy. In other words, the EU acts as a single entity on trade issues, including issues related to the World Trade Organisation (WTO). In these cases, the European Commission negotiates trade agreements and represents Europe’s interests on behalf of the EU Member States.
The economic impact of globalisation has had a considerable effect on international trade, as well as financial flows. The EU seeks to promote the development of free-trade as an instrument for stimulating economic growth and enhancing competitiveness. International trade statistics are of prime importance for both public sector (decision makers nationally, within the EU and internationally) and private users (in particular, businesses who wish to analyse export market opportunities), as they provide valuable information on developments regarding the exchange of goods between specific geographical areas.
The European Neighbourhood Policy (ENP), launched in 2003 and developed throughout 2004, supports and fosters stability, security and prosperity in the EU’s neighbourhood. The ENP was revised in 2015. The main principles of the revised policy are a tailored approach to partner countries; flexibility; joint ownership; greater involvement of EU member states and shared responsibility. The ENP aims to deepen engagement with civil society and social partners. It offers partner countries greater access to the EU's market and regulatory framework, standards and internal agencies and programmes.
The Joint Communication on Renewed Partnership with the Southern Neighbourhood – A new Agenda for the Mediterranean, accompanied by an Economic and Investment Plan for the Southern neighbours, of 9 February 2021 further guides cooperation with the ENP-South countries.
The main objective of Euro-Mediterranean cooperation in statistics is to enable the production and dissemination of reliable and comparable data, in line with European and international norms and standards.
Reliable and comparable data are essential for evidence-based decision-making. They are needed to monitor the implementation of the agreements between the EU and the ENP-South countries, the impact of policy interventions and the reaching of the Sustainable Development Goals (SDGs).
The EU has been supporting statistical capacity building in the region for a number of years through bilateral and regional capacity-building activities. This takes the form of technical assistance to partner countries’ national statistical authorities through targeted assistance programmes, such as the MEDSTAT programme and activities such as training courses, working groups and workshops, exchange of best practice and the transfer of statistical know-how. Additional information on the policy context of the ENP is provided here.
Notes
- ↑ This designation shall not be construed as recognition of a State of Palestine and is without prejudice to the individual positions of the Member States on this issue.
Direct access to
Books
- Euro-Mediterranean statistics — 2015 edition
- Statistics on European Neighbourhood Policy countries: South — 2020 edition
Leaflets
- Basic figures on the European Neighbourhood Policy — South countries — 2019 edition
- Basic figures on the European Neighbourhood Policy — South countries — 2018 edition
- Basic figures on the European Neighbourhood Policy — South countries — 2016 edition
- Basic figures on the European Neighbourhood Policy — South countries — 2015 edition
- International trade in goods for the European neighbourhood policy-South countries — 2018 edition
- Basic figures on the European Neighbourhood Policy — South countries — 2020 edition
- Basic figures on the European Neighbourhood Policy — South countries — 2019 edition
Factsheets
- International trade in goods (enps_ext)
- Trade value in goods by SITC product group (enps_ext_sitc)
- International trade in goods - aggregated data (ext_go_agg)
- International trade in goods - long-term indicators (ext_go_lti)
- Southern European Neighbourhood Policy countries (ENP-South) (enps) (ESMS metadata file — enps_esms)
- International trade in goods statistics — European Union (ESMS metadata file — ext_go_agg_esms)
- Quality report on European statistics on international trade in goods — 2016-2019 data — 2020 edition
- User guide on European statistics on international trade in goods — 2020 edition