Archive:Europe 2020 indicators - poverty and social exclusion
- Data from May 2018. Most recent data: Further Eurostat information, Main tables. Planned article update: May 2019.
This article is part of a set of statistical articles on the Europe 2020 strategy. It provides recent findings on risk of poverty and social exclusion in the European Union (EU).
The Europe 2020 strategy is the EU’s agenda for growth and jobs for the current decade. It emphasises smart, sustainable and inclusive growth as a way to strengthen the EU economy and prepare its structure for the challenges of the next decade.
Poverty reduction is a key policy component of the Europe 2020 strategy. By setting a poverty target, the EU has put social concerns on an equal footing with economic objectives. However to achieve the Europe 2020 strategy target to reduce the number of people at risk of poverty or social exclusion the strategy's other priorities, such as providing better opportunities for employment and education, must also be implemented successfully.
Europe 2020 strategy target on the risk of poverty or social exclusion
The Europe 2020 strategy has set the target of ‘lifting at least 20 million people out of the risk of poverty or social exclusion’ by 2020 compared to the year 2008 [1].
Key messages
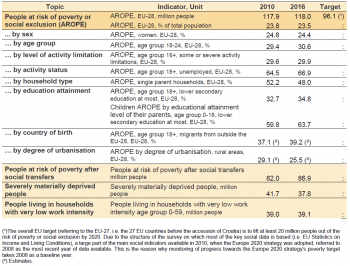
- Almost every fourth person in the EU is still at risk of poverty or social exclusion, experiencing at least one of its three forms.
- Monetary poverty is the most widespread form of poverty, affecting 17.3 % of the EU population in 2016. 7.5 % are affected by severe material deprivation, while very low work intensity concerns 10.5 % of the population aged 0 to 59.
- Of the three forms of poverty, material deprivation has shown the biggest change. While monetary poverty has been moderately but steadily increasing and very low work intensity has not changed drastically since 2010, material deprivation has been falling continuously.
- In 2016, the rate of risk of poverty after social transfers was 8.6 percentage points lower than before social transfers.
- On average, monetary poverty is lower in the EU at 17.3 % than in most other advanced economies. In most non-European OECD countries, this value was roughly between 20 % and 25 %.
- The overall EU share of people aged 0 to 59 living in households with very low work intensity has remained relatively stable at 10.5 % since 2010. However, having a job is not always enough to avoid poverty: in 2016, 7.8 % of the working EU population were at risk of poverty even though they were working full time.
- The share of women at risk of poverty or social exclusion was 1.9 percentage points higher than the corresponding share of men in 2016.
- People with activity limitations had a higher rate of risk of poverty or social exclusion, at 29.9 %, than the general population.
- 30.6 % of young people aged 18 to 24 and 26.4 % of those aged less than 18 were at risk of poverty or social exclusion in 2016. At 18.2 %, this rate was considerably lower among the elderly aged 65 or over.
- Unemployed people had a higher rate of risk of poverty or social exclusion, at 66.9 % in 2016, compared to the rest of the population.
- Almost 50 % of all single parents were at risk of poverty or social exclusion in 2016. This was double the average and higher than for any other household type analysed.
- 34.8 % of adults with at most lower secondary educational attainment were at risk of poverty or social exclusion in 2016.
- 63.7 % of children of parents with at most pre-primary and lower secondary education were at risk.
- In 2016, 39.2 % of adults born in a country outside the EU and 24.5 % of those born in a different EU country than the reporting one were at risk of poverty or social exclusion. In comparison, for native residents, only 21.6 % of the population was at risk.
- EU residents in rural areas had on average a slightly higher rate of risk of poverty or social exclusion than those living in urban areas (25.5 % compared with 23.6 %) in 2016.
Source: Eurostat online data codes (t2020_50), (t2020_51), (t2020_52), (t2020_53), (ilc_peps01), (ilc_peps03), (ilc_peps04), (ilc_peps60), (ilc_peps06) and (ilc_peps13)
Main statistical findings
How do poverty and social exclusion affect Europe?
The rate of risk of poverty or social exclusion in the EU has returned to around the 2008 level, yet progress remains limited
(million people)
Source: Eurostat online data code (t2020_50)
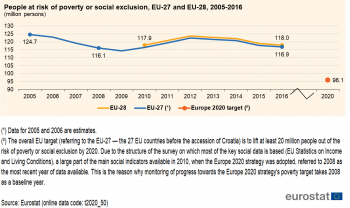
In 2016, 118.0 million people, or 23.5 % of the EU population, were at risk of poverty or social exclusion. This means roughly one in four people in the EU experienced at least one of the following three forms of poverty: monetary poverty, severe material deprivation, or are living in a household with very low work intensity. Since 2012, the number of people at risk of poverty or social exclusion has fallen each year. However, the number is still higher than in 2008[2], which is the reference year for the Europe 2020 target.
The rate of risk of poverty or social exclusion in the EU over the past decade has been marked by two turning points: in 2009, after which the number of people at risk started to rise because of the delayed social effects of the economic crisis and in 2012, when this upward trend reversed. By 2016, the number of people at risk had fallen almost to its 2008 level (see Figure 1).
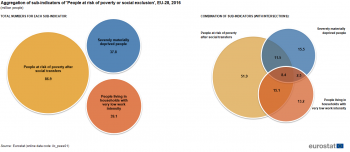
Poverty and social exclusion can manifest themselves in various forms: while household income has a big impact on living standards, other aspects, such as access to labour markets and material deprivation, also prevent full participation in society. This is reflected in the three sub-indicators that compose the ‘at-risk-of-poverty or social exclusion rate’ indicator: monetary poverty, severe material deprivation and very low work intensity. Because these sub-indicators tend to overlap and people can be affected by two or even all three of these types of poverty, a person is counted only once in the headline indicator, even if he or she falls into more than one category (see Figure 2) [3].
(million people)
Source: Eurostat online data code (ilc_pees01)
As Figure 2 shows, monetary poverty was the most widespread form of poverty in 2016, with 86.9 million people (17.3 % of the EU population) living at risk of poverty after social transfers. This was more than twice as many as those with very low work intensity (39.1 million people or 10.5 % of the EU population aged 0 to 59) and those suffering from severe material deprivation (37.8 million people or 7.5 % of the EU population).
Over 37 million people, or nearly one-third (31.7 %) of all people at risk of poverty or social exclusion, were affected by more than one dimension of poverty over the same period. Another 8.4 million people, or one in 14 of those at risk of poverty or social exclusion (7.1 %), were affected by all three forms [4].
(million people)
Source: Eurostat online data codes (t2020_51), (t2020_52) and (t2020_53)
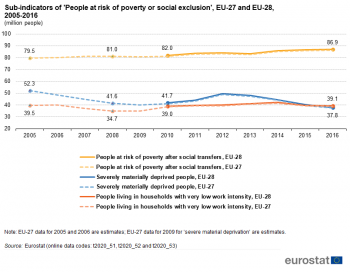
As shown in Figure 3, the three forms of poverty followed different trends between 2005 and 2016. While monetary poverty has been increasing gradually since 2005, the number of people affected by low work intensity has remained more or less constant. Since 2012 there has been a sharp decline in material deprivation, which was not only strong enough to counteract the rise in monetary poverty, but also led to an overall drop in the poverty level (see Figure 1). This means the reduction in material deprivation has been the main driver behind the headline indicator's improvement since 2012. As described later in the article, the decline in the amount of materially deprived people was mainly driven by improvements in a handful of countries.
One possible reason for the divergence between monetary poverty and the two other forms of poverty is the different nature of the indicators. While monetary poverty is measured in relative terms, material deprivation and low work intensity are absolute measures (see the section 'Data sources and availability'). The relativity of monetary poverty means the at-risk rate may remain stable or even rise even though the average or median equivalised disposable income increases. This is because the monetary poverty threshold is set at a specific percentage (60 %) of the median disposable income, which means that if the median income increases, the poverty threshold increases as well. If at the same time the inequality of the income distribution remains unchanged or even increases, the number of people below the poverty line does not decrease. Conversely, absolute poverty measures reflecting a person’s ability to afford basic goods are likely to improve during economic revivals when people are generally financially better off.
The number of people at risk of poverty or social exclusion has decreased in more than half of Member States
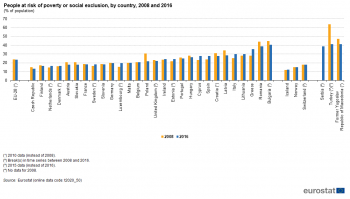
(% of population)
Source: Eurostat online data code (t2020_50)
Although on average 23.5 % of the EU population were at risk of poverty or social exclusion in 2016, the levels of individual countries varied widely, ranging from 13.3 % to 40.4 % (see Figure 4). A country’s socio-economic situation depends on many factors, but much of the current divergence in social outcomes are still a legacy of the economic and financial crisis, as seen in the European Commission’s February 2018 Quarterly Report on the Euro Area. That is to say, Member States linking flexibility in working arrangements with effective active labour market policies and adequate social protection weathered the crisis more successfully (for more information, see the European Commission's Annual Growth Survey 2018 and its Joint Employment Report 2018, and the article on ‘Employment’).
To meet the overall EU target on risk of poverty and social exclusion, Member States have set their own national targets in their National Reform Programmes. As noted in the European Council conclusions from 17 June 2010, Member States are free to set their own targets based on the most appropriate indicators for their circumstances and priorities. In 23 countries the target is expressed as an absolute number of people to be lifted out of the risk of poverty or social exclusion or one or more of its sub-indicators (European Commission, 2015) [5]. Of these countries, the Czech Republic, Croatia, Poland and Romania had already reached their national poverty targets by 2016. On the other hand, the number of people at risk of poverty or social exclusion has risen in 11 Member States since 2008, pushing them further away from their national targets.
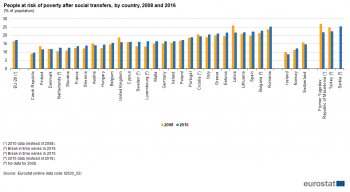
(% of population)
Source: Eurostat online data code (t2020_52)
In 2016, 17.3 % of the EU population earned less than the poverty threshold, which is set at 60 % of the national median equivalised disposable income in the country in which they live. This represents a slight increase compared with 2010, when 16.5 % fell below this threshold (see Figure 5). Most countries also experienced growth in the number of people below the monetary poverty line, regardless of whether they had low or high levels to begin with.
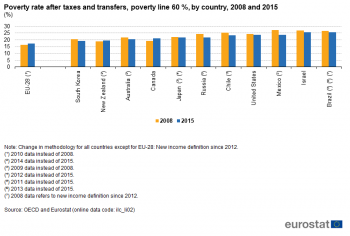
(%)
Source: OECD and Eurostat online data code (ilc_li02)
Compared with the main economies worldwide, the EU average share of people at risk of monetary poverty at 17.3 % is low, despite increases since 2008. In most non-EU OECD countries, this value is roughly between 20 % and 25 %[6] (see Figure 6). Commonwealth countries in the OECD outside the EU as well as Asian OECD countries including Russia are at the bottom end of this range, while monetary poverty is more prevalent in the Latin American OECD countries as well as the United States, Turkey and Israel. Conversely, the EFTA States and OECD Members Norway and Switzerland have poverty rates lower than the EU average but higher than the EU Member States with the lowest shares.
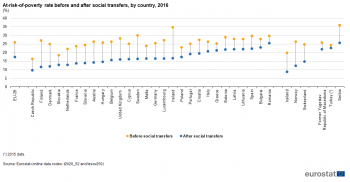
(%)
Source: Eurostat online data codes (t2020_52) and (tesov250)
To reduce the risk of poverty or social exclusion within their populations, governments provide social security in the form of social transfers, such as unemployment benefits or family-related benefits, among others. The effectiveness of monetary social provision can be evaluated by comparing the at-risk-of-poverty rate before and after social transfers (see Figure 7). In the EU, social transfers reduced the share of people at risk of poverty by 8.6 percentage points in 2016, from 25.9 % to 17.3 %. However, the extent to which this was achieved at Member State level varied greatly. For example, the share of risk of poverty before social transfers was similar in Finland and Romania. While in Finland social transfers decreased the share of monetary poor to the second lowest value among all Member States, Romania accounted for the highest share of people living in monetary poverty after social transfers.
Over time, the at-risk-of-poverty rates before and after social transfers have moved in different directions. The rate before social transfers was relatively stable in the EU between 2010 and 2016, while the rate after social transfers increased slightly over the same time. This could mean that either the amounts of social transfers paid have fallen or they have become less effective over time.
Differences in the effectiveness and efficiency of social protection expenditures depend on a variety of factors, such as the level of poverty and inequality before social transfers and differences in the size and design of these expenditures[7].
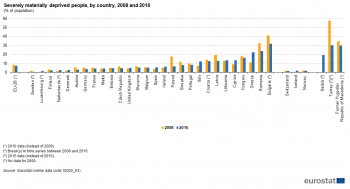
(% of population)
Source: Eurostat online data code (t2020_53)
Material deprivation covers issues relating to economic strain, durables and housing, and dwelling environment. People living in severely materially deprived conditions are greatly constrained by a lack of resources. This means they live in households unable to afford four or more items out of a list of nine considered by most people to be desirable or even necessary for an adequate life[8].
In 2016, 37.8 million people in the EU were living in conditions severely constrained by a lack of resources. This was equal to 7.5 % of the total EU population. As Figure 8 shows, this value differed widely across the EU in 2016. According to the Annual Report of the Social Protection Committee, among other factors, differences in living standards and real disposable income play an important part.
Overall, the share of the population affected by severe material deprivation decreased by 0.9 percentage points or by 3.9 million people between 2010 and 2016. The improvement becomes especially apparent when comparing it to the year 2012, when the situation was particularly dire with almost 50 million people affected.
Since 2008, the number of people living in severe material deprivation has fallen in almost two thirds of EU Member States. The most distinct improvements took place in a handful of countries, particularly Poland, Bulgaria and Romania. Because, as described earlier, falls in material depravation have tended to drive improvements in the overall headline indicator, these countries to a large extent are responsible for the decline in the share of people at risk of poverty or social exclusion in the EU.
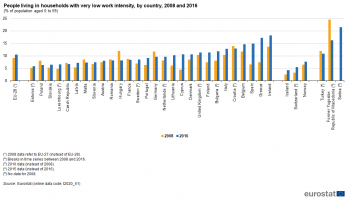
(% of population aged 0 to 59)
Source: Eurostat online data code (t2020_51)
In 2016, 10.5 % (or 39.1 million) of the EU population aged 0 to 59 were living in households with very low work intensity. This means the working-age members of a household worked no longer than 20 % of their potential working time during the previous year. Even though on average the share of the population aged 0 to 59 living in households with very low work intensity was only 1.3 percentage points higher in 2016 than it was in 2008, it has increased considerably in most Member States (see Figure 9). These increases were offset by improvements in only a handful of countries, mainly Poland, Hungary and Germany.
The three forms of poverty forming the headline indicator represent three related but distinct aspects of poverty. This means that whether these three sub-indicators correspond to each other or not depends on country-specific circumstances. Comparing the levels of the three different sub-indicators reveals the following pattern: in Poland, the Czech Republic, Slovenia and Malta as well as in all western and northern EU Member States (except the Baltic countries) either all three poverty measures were below the EU-wide average or monetary poverty and material deprivation were low despite high shares of the population living in households with very low work intensity[9]. Conversely, in many other EU-Member States either all three sub-indicators revealed a share of poverty above the EU-wide average (Bulgaria, Italy, Croatia and Greece) or poverty level were above average in two of the three sub-indicators. In this case, it was most common to have a low share of quasi-jobless households but proportionally many people suffering from material deprivation and monetary poverty (this was the case in Latvia, Romania, Portugal and Lithuania)[10]. This shows that the structure of poverty can differ across the Member States.
Poverty and social exclusion do not only affect those who are economically inactive or unemployed (for more information on employment indicators see the ‘Employment’ article). In 2016, 7.8 % of the working EU population were at risk of poverty despite working full time (the so-called working poor)[11]. With the exception of those aged between 18 and 24, men are more often among the working poor than women. This is because women are more often secondary earners, meaning the household income does not depend solely on them, and working poverty is determined by household income (for more insights, see the report on Poverty, gender and intersecting inequalities in the EU).
Which groups are at greater risk of poverty or social exclusion?
Identifying groups with a heightened risk of poverty or social exclusion, and determining the reasons behind this vulnerability, is the key to creating sound policies to fight poverty. Compared with the EU average, some population groups are at a higher risk of poverty or social exclusion. The most affected are women, children, young people, people with disabilities, the unemployed, single-parent households and those living alone, people with lower educational attainment, people born in a different country than the one they reside in, people out of work, and, in a majority of Member States, those living in rural areas.
Women and young people are particularly vulnerable to poverty and social exclusion
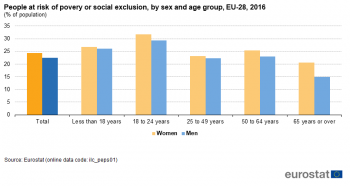
(% of population)
Source: Eurostat online data code (ilc_peps01)
People's roles and responsibilities within families and in the workplace change throughout their lives and can also be influenced by gender. Thus, it is necessary to consider the breakdown of the headline indicator by age and sex for a complete picture of the structure of risk of poverty or social exclusion.
In 2016, women had a higher rate of risk of poverty or social exclusion than men (the rate for women was 24.4 % compared wiht 22.5 % for men). Because the definition of households in the context of the SILC survey implies an equal sharing of resources between all members of the household, it is likely that the main drivers behind the gender gap are higher risk of poverty rates among single female households, mainly those with dependent children[12]. In a workshop on the main causes of female poverty, the European Parliament’s Directorate General for Internal Policies pointed out that one reason for this persisting gender gap is that single-parent households which tend to be far more often headed by women, are more likely to have very low work intensities compared with other households with children . A comparison of Member States’ performance in the European Semester Thematic Factsheet shows two policy measures that could ease this problem: child and family-support benefits and access to affordable, high-quality childcare.
Overall, between 2008 and 2016 the share of both men and women at risk of poverty or social exclusion followed a similar path as the headline indicator depicted in Figure 1. Even so, compared to 2008, the rate decreased a bit more for women than for men, slightly reducing the gender poverty gap. Most progress in reducing the gender gap was made in the years 2012 to 2015 and not in the most recent year considered.
The long-term effects of reduced work intensity among women (both single and married) become especially apparent in old age. Although women had higher rates of risk of poverty or social exclusion than men in all age groups in 2016, the largest differences could be seen in the oldest group (65 or over), displaying a gender gap of 5.6 percentage points. One explanation for the gender poverty gap among elderly EU residents is that on average women receive a lower pension income than men. As shown in the European Commission’s Pension Adequacy Report, this is mainly due to childcare-related gaps in their employment history and patterns of employment with low pension coverage.
For both men and women, young people below the age of 24 had the highest rates of risk of poverty or social exclusion (30.6 % for 18 to 24 year olds and 26.4 % for people younger than 18. For more information on this group’s employment situation see the article on ‘Employment’).
People with disabilities have higher rates of risk of poverty or social exclusion
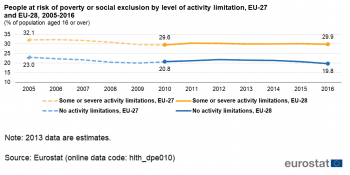
(% of population aged 16 or over)
Source: Eurostat online data code (hlth_dpe010)
In 2016, about 30 % of the population aged 16 or more in the EU and with an activity limitation were at risk of poverty or social exclusion, compared to around 20 % of those with no disability. Despite large country differences, the rate of risk of poverty and social exclusion among people with activity limitations was higher compared to the overall population in all Member States.
Across the EU, the share of people with activity limitation at risk of poverty or social exclusion followed a similar pattern as the overall indicator until around 2012. However, instead of decreasing after 2012, as was the case for the general population, the value for those with activity limitations remained stable. Some of the main challenges that people with disabilities face are limited access to quality education from an early age and impeded access to the labour market. The integration of people with disabilities into the labour market has proven especially difficult in the wake of the financial crisis (for more Information see the Progress Report by the European Commission on its European Disability Strategy).
The difference in risk of monetary poverty before and after social transfers reveals the decisive importance of social transfers to people with activity limitation. Before social transfers, 69.1 %[13] of people suffering from activity limitations were at risk of monetary poverty, but after social transfers, this rate was reduced to 20.2 %[14] across the EU[15].
Lack of work increases the risk of poverty or social exclusion
At 66.9 %, two-thirds of unemployed people in the EU were at risk of poverty or social exclusion in 2016[16]. In the same year, 43.5 % of other economically inactive people[17] were also at risk. In comparison, the share of employed people at risk was just 12.4 %. This shows that poverty or social exclusion are more likely to affect unemployed people. This is linked to the fact that the share of people living in households with low job intensity is one of the component indicators of the risk of poverty or social exclusion indicator.
However, the rate of risk of poverty or social exclusion increased for all groups regardless of their employment status between 2010 and 2016, except for retirees, where it fell by 2.1 percentage points. It is interesting that in 2016 men had a higher rate of risk of poverty and social exclusion than women across all employment statuses, except for retirees. Among those, the share of women at risk of poverty or social exclusion was 4.0 percentage points higher than that of men. This reflects an aspect discussed earlier in this article: One of the drivers behind the feminisation of poverty and social exclusion is the number of women at risk of poverty or social exclusion at retirement age.
Single parents face the highest risk of poverty or social exclusion
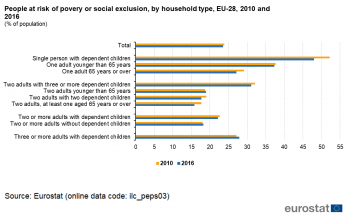
(% of population)
Source: Eurostat online data code (ilc_peps03)
In 2016, 48.0 % of single people with one or more dependent children were at risk of poverty or social exclusion. This was just over twice the average rate and higher than for other household types. However, this group also experienced the largest decline in the percentage at risk since 2010 when the rate was 52.2 % and well over double the average.
Figure 12 shows that in general households with only one adult — both with children and without — and households with many children are at a higher risk of poverty or social exclusion. In single-adult households there is no partner to help cushion temporary disruptions such as unemployment or sickness. Also, many such households are made up of young unemployed people or pensioners — often women — which have a higher-than-average risk of poverty or social exclusion [18]. Single parents also face the challenge of being both the primary breadwinner and caregiver for the family. The group with the lowest risk of poverty rate in 2016 was that of households with two adults where at least one person was aged 65 years or over.
People with low educational attainment are three times more likely to be at risk than those with tertiary education
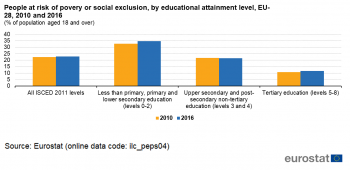
(% of population aged 18 and over)
Source: Eurostat online data code (ilc_peps04)
In 2016, 34.8 % of people with at most lower secondary educational attainment were at risk of poverty or social exclusion (see Figure 13). In comparison, only 11.7 % with tertiary education were in the same situation. This shows that the least educated people were almost three times more likely to be at risk than those with the highest education levels (also see the article on ‘Education’). This is also reflected in the data on employment, which shows that the likelihood of being employed rises in line with educational level (see the article on ‘Employment’ or the Education and Training Monitor 2017 of the European Commission for more information).
Even though the risk of poverty or social exclusion increased the most for adults with the lowest educational attainment between 2010 and 2016, people with the highest education levels also experienced an increased risk.
The risk of poverty or social exclusion due to low education is passed on to the next generation
An important aspect to consider when analysing the overall number of people at risk of poverty or social exclusion is the transmission of disadvantage from one generation to the next.
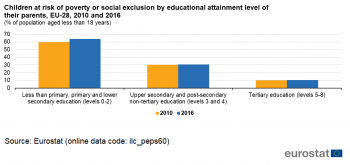
(% of population aged less than 18 years)
Source: Eurostat online data code (ilc_peps60)
At 10.3 %, children of parents who obtained the highest educational degrees had about the same rate of risk of poverty or social exclusion as the overall population with the highest educational level in 2016 (see Figures 13 and 14). Contrarily, the situation was especially severe for children of parents with at most pre-primary and lower secondary education. The risk of poverty rate for people in this group was almost six times higher than for children of parents with first or second stage tertiary education. Also, while around a third of the overall population with the lowest educational attainment was at risk of poverty or social exclusion in 2016, this rate was almost twice as high, at 63.7 %, for children of parents in this group. This implies that the risk of poverty or social exclusion particularly affects families where parents could not benefit from an extensive education.
Moreover, between 2010 and 2016 the increase in the risk of poverty or social exclusion was particularly high for children of parents with the lowest educational attainment, while the increase was minimal for other children. Thus, education, which is a strong determinant of poverty or social exclusion for adults, also strongly influences whether children are at risk of poverty or social exclusion (for more information see the Education and Training Monitor 2017 of the European Commission).
The socio-economic environment in which children grow up does not only affect the standard of living in their youth. There is also a close link between the socio-economic status of adults and the status of their parents during their childhood. For instance, the ad hoc module on Intergenerational transmission of disadvantage statistics carried out in the EU Statistics on Income and Living Conditions (SILC) in 2011[19] showed that 34.2 % of low-educated adults also had low-educated parents in their childhood. This can be explained by the parents’ inability to financially support their children’s studies and/or to pass on a perception of the importance of education to their children.
Education is not the only factor transmitted from generation to generation. In 2011, 68.9 % of adults with a low ability to make ends meet grew up in a household in the same situation. Moreover, among adults ‘not at work’, 28.6 % also grew up in a household with at least one parent not at work[20]. Thus, children growing up in unfavourable conditions are less likely than their better-off peers to do well in school, enjoy good health and realise their full potential later in life (for more information see Eurostat’s statistical book on Living Conditions in Europe).
In a Commission Recommendation, the European Commission encouraged its Member States to take action to prevent disadvantages being transmitted across generations. Specifically, it advised them to guarantee that children grow up with sufficient resources, as well as enusre they have access to quality education, along with childcare services and health services, and to enforce children’s rights to access different pastime activities.
People from outside the EU are generally worse off than people living in their home country
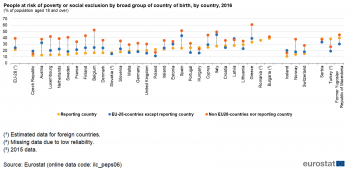
(% of population aged 18 and over)
Source: Eurostat online data code (ilc_peps06)
In 2016, people living in the EU but born in a non-EU country had a 39.2 % at risk of poverty or social exclusion rate. The risk was lower for people born in an EU-country other than the one they were living in, at 24.5 %. Among the people whose country of residence corresponded to their country of birth, 21.6 % were at risk of poverty or social exclusion. Thus, people born outside the EU had a twice higher rate of risk of poverty or social exclusion compared with native residents. Compared to migration from a country outside the EU, migration within the EU bears a far smaller risk of poverty or social exclusion.
In the majority of Member States, the rate of risk of poverty or social exclusion was highest for people born outside the EU. The Czech Republic, Poland, Hungary and Latvia form the exceptions. However, at around 10 percentage points, the difference between groups with different migration status was comparably low in these four countries. In Member States where people born outside the EU were most at risk of suffering from poverty or social exclusion, this likelihood was up to 36 percentage points higher than for those born within the reporting country.
The ’poverty origin gap’ can arise due to a number factors, such as the level of education, labour market access and employment status of foreign citizens residing in a given Member State. Difficulties in labour market access among foreign citizens can be due to migration-specific work obstacles: problems with credential recognition, language and communication barriers, or discrimination on social and religious grounds (for more information, see the Eurostat article on First and second-generation immigrants — obstacles to work and the Migrant integration statistics). Furthermore, the socio-economic outcomes of the foreign-born population may also reflect the different reasons for migrating to a specific country. For instance, in many EU countries a large share of non-EU migrants did not come to their host country primarily for work, but rather for family reasons, or for humanitarian reasons (see Employment and Social Development in Europe 2015 and the International Migration Outlook 2017 by the OECD).
Between 2010 and 2016 the risk of poverty or social exclusion increased for those living in a country other than their country of origin, both for those from outside the EU and those from inside the EU. However, for both groups, this share decreased compared to the years 2013 to 2015.
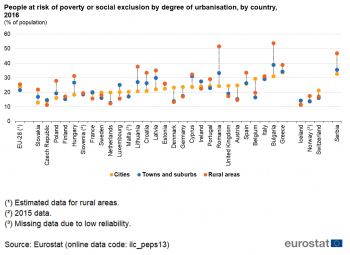
People in rural areas have slightly higher rates of risk of poverty or social exclusion, but the rate has converged across different types of settlements
(% of population)
Source: Eurostat online data code (ilc_peps13)
On average, EU residents in rural areas were slightly more likely to live at risk of poverty or social exclusion than those in urban areas (25.5 % in rural areas compared with 23.6 % in urban areas) in 2016 (see Figure 15). Those living in towns or suburbs were the least likely to be at risk (21.6 %). Despite the overall EU averages showing higher rates of risk of poverty or social exclusion in rural areas, in some northern, central and western Member States, people residing in urban areas were more often affected than in rural areas.
In a study report on poverty and social exclusion in rural areas, the European Commission identified four main categories of problems that characterise rural areas in the EU and determine the risk of poverty or social exclusion: demography (for example, the exodus of residents and the ageing population in rural areas), remoteness (such as lack of infrastructure and basic services), education (for example, lack of preschools and difficulty in accessing primary and secondary schools) and labour markets (lower employment rates, persistent long-term unemployment and a greater number of seasonal workers). At the same time, even if urban areas are often characterised by high concentrations of economic activity, they are also characterised by a range of social inequalities, where especially the costs of living can contribute to the risks of poverty .
Data sources and availability
Due to the structure of the survey on which most of the key social data is based (EU Statistics on Income and Living Conditions (EU-SILC)), a large part of the main social indicators available in 2010 (when the Europe 2020 strategy was adopted) referred to 2008 as the most recent year of data available. For this reason, 2008 is used as the baseline year for monitoring progress. For the headline indicator, ‘People at risk of poverty or social exclusion’, the target value for 2020 continues to be based on EU-27 data from 2008 because EU-28 aggregated data are only available starting from 2010. This is also why the analysis of the headline indicator and the three sub-indicators refers to both EU-27 data (from 2005) and EU-28 data (from 2010).
Indicators presented in the article:
- People at risk of poverty or social exclusion (AROPE) (t2020_50)
- Breakdown by age and sex (ilc_peps01)
- Breakdown by level of activity limitation (hlth_dpe010)
- Breakdown by activity status (ilc_peps02)
- Breakdown by household type (ilc_peps03)
- Breakdown by educational attainment level (ilc_peps04)
- Breakdown by educational attainment of one's parents (ilc_peps60)
- Breakdown by broad country of birth (ilc_peps06)
- Breakdown by degree of urbanisation (ilc_peps13)
- People at risk of poverty after social transfers (AROP) (t2020_52)
- At-risk-of-poverty rate before social transfers (tesov250)
- Severely materially deprived people (t2020_53)
- People living in households with very low work intensity (t2020_51)
- In-work-at-risk-of-poverty rate (ilc_iw07)
Context
Poverty and social exclusion harm lives and limit the opportunities for people to achieve their full potential by affecting their health and well-being and lowering educational outcomes. This, in turn, reduces their ability to lead a successful life and further increases the risk of poverty. Without effective educational, health, social, tax-benefit and employment systems, the risk of poverty is passed on from one generation to the next. This causes poverty to persist, creating more inequality that can lead to the long-term loss of economic productivity from whole groups of society and hamper inclusive and sustainable economic growth.
To prevent this downward spiral, the European Commission has made ‘inclusive growth’ one of the three priorities of the Europe 2020 strategy. It has set a target to lift at least 20 million people out of the risk of poverty or social exclusion by 2020. To further reinforce the social dimension of the EU, the European Pillar of Social Rights has been jointly signed by the European Parliament, the Council and the European Commission.
To reach the Europe 2020 poverty goal, particular focus will need to be placed on groups that are at high risk of poverty or social exclusion. With the Social Investment Package, the European Commission has set forth an integrated policy framework aiming to reach out to various vulnerable target groups, for example, with a specific recommendation on Investing in children: breaking the cycle of disadvantage. Also, between 2014 and 2020, at least 20 % of the European Social Fund is earmarked for measures combating poverty and social exclusion.
Further specific actions to reduce poverty or social exclusion among young people and the unemployed, particularly vulnerable groups, have been outlined in the Youth Guarantee Programme. Also, the European Commission's recommendation on the Integration of Long-Term Unemployment in the Labour Market aims to simplify and improve access to support for people out of work for long periods. Finally, the Fund for European Aid to the Most Deprived (FEAD) supports EU countries' actions in providing food, clothing, and other essential goods as well as non-material social inclusion measures to the poorest in society.
Measures to reduce the amount of people living in dire conditions are often intertwined with measures that aim to achieve other Europe 2020 strategy goals. For example, many initiatives that try to tackle poverty also aim to boost employment. Enhancing education and training, and reducing the number of people leaving school early, will not only help to lift the current generation out of poverty, but may also stop poverty being passed on to the next generation.
See also
Further Eurostat information
Publications
Main tables
Dedicated section
Methodology / Metadata
- Towards robust quality management for European Statistics - Communication from the Commission COM(2011) 211 final
Other information
- Regulation (EC) No 223/2009 of 11 March 2009 on European statistics
External links
Notes
- ↑ Due to the structure of the survey on which most of the key social data is based (EU Statistics on Income and Living Conditions), a large part of the main social indicators available in 2010, when the Europe 2020 strategy was adopted, referred to 2008 as the most recent year of data available. This is why 2008 data for the EU-27 are used as the baseline year for monitoring progress towards the Europe 2020 strategy's poverty target. Since 116.1 million people were at risk of poverty or social exclusion in the EU-27 in 2008, the target value to be reached is 96.1 million by 2020.
- ↑ This number refers to EU-27; see footnote 2 of Figure 1.
- ↑ The indicator ‘very low work intensity’ is limited to people aged 0 to 59. People over the age of 59 are considered at risk of poverty or social exclusion only if the criteria of one of the two dimensions ‘monetary poverty’ or ‘severe material deprivation’ are met.
- ↑ The year of reference differs for the three sub-indicators. The risk of poverty after social transfers and whether or not someone lives in a household with very low work intensity are based on data from the previous year. The extent to which an individual is severely materially deprived is determined based on information from the year of the survey.
- ↑ This corresponds to the base year also used for the overall EU target.
Germany and Sweden use targets based on different forms of unemployment, Ireland defined a combined poverty target, the Netherlands aims to reduce the amount of jobless households , and the United Kingdom based its numerical targets on a nationally launched Child Poverty Act. - ↑ These values are taken from the OECD dataset on Income Distribution and Poverty and correspond to the newest data available in this set (2014: New Zealand, Australia and Mexico, 2013: Brazil, 2012: Japan, 2011: Russia). All data is based on the OECD’s new income definition, which includes the value of goods produced for own consumption as a component of self-employed income, an element not considered in the SILC income definition.
- ↑ For more information see: European Commission, European Semester Thematic Factsheet. Social Inclusion, 2016.
- ↑ These items are the following: to pay their rent, mortgage or utility bills; to keep their home adequately warm; to face unexpected expenses; to eat meat or proteins regularly; to go on holiday; a television set; a washing machine; a car; a telephone.
- ↑ Slovakia, Hungary and Estonia also experienced a lower than average share of poverty in two dimensions of the headline indicator and an above average share in a third.
- ↑ Spain and Cyprus also experienced a proportionally high share of poverty in two of the three dimensions of the headline indicator and a comparably low share in a third dimension.
- ↑ Source: Eurostat (online data code: (ilc_iw07)).
- ↑ Given that the data does not reveal systematic differences in the risk of poverty or social exclusion between single female and single male households without dependent children, the gender gap is expected to be caused by single households with dependent children.
- ↑ Eurostat (online data code: (hlth_dpe030)).
- ↑ Eurostat (online data code: (hlth_dpe020)).
- ↑ To assess the importance of social transfers, the analysis focuses on the sub-indicator ‘at risk of poverty’ without the dimensions of material deprivation and very low-work intensity.
- ↑ Eurostat (online data code: (ilc_peps02)).
- ↑ The inactive population can include pre-school children, school children, students, pensioners and housewives or -men, for example, provided that they are not working at all and not available or looking for work either; some of these may be of working-age.
- ↑ European Centre, Poverty Across Europe: The latest evidence using the EU-SILC Survey, 2008.
- ↑ The data on intergenerational transmission of disadvantages will be updated in the EU-SILC ad hoc module 2019.
- ↑ Parents ‘not at work’ include unemployed, in retirement or in early retirement or had given up business, fulfilling domestic tasks and care responsibilities, other inactive person, and those answering “don’t know”.