Archive:Europe 2020 indicators - education
- Data from March 2016. Most recent data: Further Eurostat information, Main tables. Planned article update: May 2017.
This article is part of a set of statistical articles on the Europe 2020 strategy. It provides recent statistics on education in the European Union (EU).
The Europe 2020 strategy is the EU’s agenda for growth and jobs for the current decade. It emphasises smart, sustainable and inclusive growth as a way to overcome the structural weakness in Europe’s economy, to improve its competitivenes and productivity and to underpin a sustainable social market economy.
Education is a key policy component of the Europe 2020 strategy. The EU’s education targets are interlinked with the other Europe 2020 goals: higher educational attainment improves employability, which in turn reduces poverty. The tertiary education target is furthermore interrelated with the research and development (R&D) and innovation target — investments in the R&D sector is likely to raise the demand for highly skilled workers.
Europe 2020 strategy target on education
The Europe 2020 strategy sets out a target of ‘reducing the share of early leavers of education and training to less than 10 % and increasing the share of the population aged 30 to 34 having completed tertiary or equivalent education to at least 40 %’ by 2020 [1].
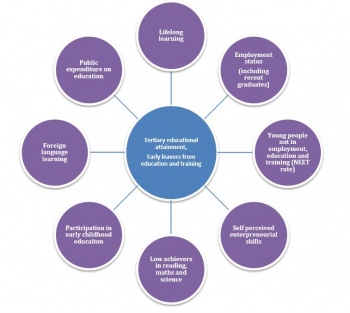
The analysis in this article builds on the headline indicators chosen to monitor the Europe 2020 strategy's education targets: 'early leavers from education and training' and 'tertiary educational attainment'. The analysis follows the typical educational pathway, starting with early childhood education, followed by the acquisition of basic skills (reading, maths and science) and foreign languages, leading to tertiary education and lifelong learning in adulthood. It then switches to the ‘outcome’ side, looking at educational attainment in the EU labour force and the impacts of low levels of attainment. The input in the form of public expenditure on education is investigated as well.
Key messages
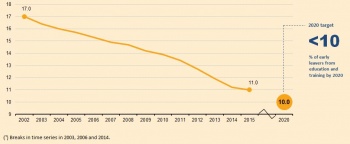
- Early leaving from education and training has been falling continuously in the EU since 2002, for both men and women. The fall from 17.0 % in 2002 to 11.0 % in 2015 represents steady progress towards the Europe 2020 target of less than 10 %.
- Young men, foreign-born residents and ethnic minorities are more likely to leave education and training with at most lower secondary education.
- In 2014, 94.3 % of children between the age of four and the starting age of compulsory education participated in ECEC, compared with 87.7 % in 2002. This is a considerable move towards the ET 2020 benchmark of at least 95 %.
- In 2012 about one fifth of 15 year olds showed insufficient abilities in reading, maths and science. This means the number of people with poor abilities needs to fall by almost a quarter to reach the ET 2020 benchmark.
- Between 2002 and 2015, the share of 30 to 34 year olds having completed tertiary education grew continuously from 23.6 % to 38.7 %. Growth was considerably faster for women, who in 2015 were already clearly above the Europe 2020 target at 43.4 %. In contrast, among 30 to 34 year old men the share was 34.0 % in 2015.
- In 2013, 7.5 % of all EU students were studying in a country other than the one where they had completed their secondary education. Most of the mobility took place at doctorate level.
- The share of adults participating in lifelong learning does not seem to be increasing fast enough to meet the ET 2020 benchmark of raising participation to at least 15 % by 2020. In 2014, the share reached a high of 10.8 %, before falling slightly to 10.7 % in 2015.
- In 2015, 58.2 % of 18 to 24 year old early leavers from education and training were either unemployed or inactive. Of the total population of 18 to 24 year olds, 19.1 % were neither in employment nor in any further education or training (NEET) and thus at risk of being excluded from the labour market.
- The employment rate of recent graduates (20 to 34 year olds having left education and training in the past three years) has dropped considerably due to the economic and financial crisis. It fell from 82.0 % in 2008 to 75.4 % in 2013. However, it has increased slightly since 2013, reaching 76.9 % in 2015.
Main statistical findings
Early leaving from education and training is declining
(% of population aged 18 to 24 with at most lower secondary education and not in further education or training)
Source: Eurostat online data code (t2020_40)
The headline indicator ‘Early leavers from education and training’ measures the share of the population aged 18 to 24 with at most lower secondary education and who were not involved in further education or training during the four weeks preceding the survey. Figure 2 shows that the share of early leavers has fallen continuously from 17.0 % in 2002 to 11.0 % in 2015. This trend mirrors reductions in almost all EU Member States for both men and women.
Young men, foreign-born and ethnic minorities are more likely to leave education and training earlier
Overall, men were more likely to leave education and training earlier than women in the EU. This gap has been narrowing since 2010, reaching 2.9 percentage points in 2015. This was the first time it had fallen below three percentage points. The share for women is already below the headline target, at 9.5 %.
At the country-level, Bulgaria was the only Member State in 2015 where men were more likely to stay in education and training longer. A similar situation could be observed in the candidate countries Turkey and FYR Macedonia [2]. Gender differences were particularly strong in Spain, Latvia, Malta, Portugal and Italy.
Young foreign-born residents in the EU also have a higher tendency to abandon formal education prematurely. In the EU, the share of early leavers among migrants in 2015 was almost twice as high as for natives (19.0 % compared with 10.1 %) [3]. Language difficulties, leading to underachievement and lack of motivation, are one possible reason. Increased risk of social exclusion due to lower socioeconomic status is another. Educational systems may also exacerbate these circumstances if they are not set up to respond to the special needs of pupils from vulnerable groups (Dale et al., 2010, p. 30).
In a number of Member States, the proportion of early leavers is especially high among ethnic minority groups, such as Roma. The report ‘The situation of Roma in 11 EU Member States’, states that in 2011 the share of early leavers among young Roma aged 18 to 24 years ranged from 72 % in the Czech Republic to 82–85 % in Bulgaria, Hungary, Italy, Poland and Slovakia. In France, Greece, Portugal, Romania and Spain more than 93 % of Roma aged 18 to 24 have not completed upper secondary education.
Ethnic minorities are likely to be excluded from education due to a combination of factors including parental choices, poverty, discriminatory practices, residential segregation and language barriers. In response to persistent marginalisation and social exclusion of Roma minorities, in 2011 the European Commission adopted in 2011 the ‘EU Framework for National Roma Integration Strategies up to 2020’. The framework reflects the EU’s commitment to ensuring Roma inclusion in four key areas, including access to education.
Southern European countries showed strongest reductions in early leaving from education and training
(% of the population aged 18 to 24 with at most lower secondary education and not in further education or training)
Source: Eurostat online data code (t2020_40)
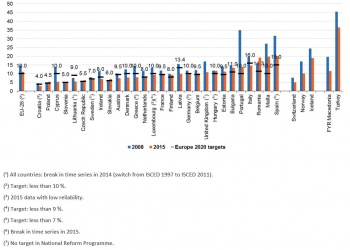
Reflecting different national circumstances, the common EU target for early leavers from education and training has been transposed into national targets by all Member States except the United Kingdom. National targets range from 4 % for Croatia to 16 % for Italy. In 2015, 13 countries had already achieved their targets: Austria, Croatia, Cyprus, Denmark, France, Greece, Ireland, Italy, Lithuania, Luxembourg, Latvia, Slovenia and Sweden. The Czech Republic had achieved its target in 2013 but dropped out again in 2015. On the other end of the scale, Malta was the furthest away by some 10 percentage points.
In 2015, rates of early leaving varied by a factor of six across Member States. The lowest proportion of early leavers was in Croatia, Cyprus, Lithuania, Poland and Slovenia with less than 6 %. The share was highest in Spain, Malta and Romania with 19 % or more.
At the same time, southern European countries experienced strong falls in early leaving from education and training between 2008 and 2015, especially Portugal (from 34.9 % to 13.7 %), Spain (from 31.7 % to 20.0 %), Malta (from 27.2 % to 19.8 %), Greece (from 14.4 % to 7.9 %) and Cyprus (from 13.7 % to 5.3 %). In 2015, 17 Member States were already below the overall EU target of 10 %.
Looking at the European Free Trade Association (EFTA) and candidate countries, Switzerland was on a level with the best performing EU Member States. However, the share of early leavers was slightly lower than in the EU in Norway and higher than in the EU in Iceland. The highest share of early leavers, three times as high as in the EU, was in Turkey.
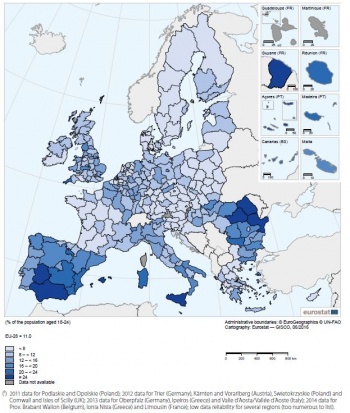
(% of population aged 18-24 with at most lower secondary education and not in further education or training)
(edat_lfse_16)
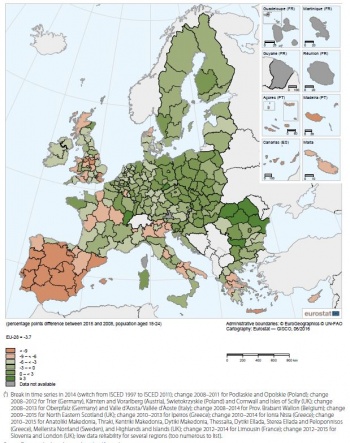
(percentage points difference between 2015 and 2008, population aged 18 to 24 with at most lower secondary education and not in further education or training)
(edat_lfse_16)
Variations in early leaving from education and training across Member States are also mirrored in the indicator’s regional dispersion (see Map 1). The predominance of regions with a very low share of early leavers (below 8 %) in some central and eastern European countries, such as Poland, the Czech Republic, Slovenia, Slovakia and Croatia, corresponds to the overall low proportion of early leavers in these countries.
In contrast, regions in Spain, Portugal, Italy and Romania stand out with above average rates of early leavers from education and training. In 2015, 20 NUTS 2 regions had a share of early leavers higher than 20 %. Half of these regions were in Spain (10 regions), while there were three in Romania, two in each of Italy, France and Portugal, and one in Belgium. The highest proportions of 18 to 24 year olds who were classified as early leavers in 2015 were found in French Guyane (36.1 %) and the Spanish Ciudad Autónoma de Ceuta (29.8 %). According to the Education and Training Monitor 2015 the share of early leavers is often relatively high in peripheral and remote areas, where students may be forced to leave home if they wish to follow a particular specialisation, while those who remain may be presented with few opportunities for higher education.
The two Member States with the largest within-country dispersion of early leaving rates in 2015, by a factor of five or higher, were the Czech Republic and France. This means the worst performing regions in these countries had early leaving rates that were about five times higher than in the best performing regions. In 2015, the French region Picardie had early leaving rates 6 times higher than Bretagne, the best performing region in France. In contrast, Slovenia, Denmark, Finland and Sweden were the most ‘equal’ countries, showing almost no difference in rates across their regions.
Map 2 shows the change in regional rates of early leaving from education and training since 2008. The share of early leavers in the EU-28 fell by 3.7 percentage points between 2008 and 2015. Nearly four fifths (78.5 %) of the 265 NUTS 2 regions for which data are available have experienced a fall in their share of early leavers aged 18 to 24 over the six years from 2008 to 2015.
The biggest regional reductions were recorded in Portuguese and Spanish. The largest falls were in the Norte region and the Região Autónoma dos Açores in Portugal, where the proportion of early leavers fell by around 25 percentage points. Four other Portuguese regions as well as four Spanish regions recorded declines of at least 15 percentage points.
In contrast, early leaving rates increased in 57 regions over the period from 2008 to 2015. Five regions had increases of more than five percentage points; three of which were in Romania (Nord-Est, Sud-Est and Centru), one was in Bulgaria (Severozapaden) and one in the United Kingdom (Cumbria).
Early childhood education and care is improving
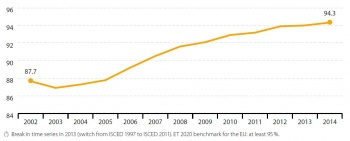
(% of the age group between four years old and the starting age of compulsory education)
Source: Eurostat online data codes (tps00179) and (educ_uoe_enra10)
Early childhood education and care (ECEC) can bring wide-ranging social and economic benefits for individuals and for society as a whole. Quality ECEC provides an essential foundation for effective lifelong learning and future educational achievements. It also helps personal development and social integration. The EU therefore aims to ensure that all young children can access and benefit from high-quality education and care (European Commission, 2014).
Participation in ECEC is considered a crucial factor for socialising children into formal education. This is especially important for children from disadvantaged backgrounds. The aim is to reduce the incidence of early school leaving, addressing one of the Europe 2020 headline targets on education. Investment in pre-primary education also offers higher medium- and long-term returns and is more likely to help children from low socio-economic status than investment at later educational stages.
ET 2020 recognises ECEC’s potential for addressing social inclusion and economic challenges. It has set a benchmark to ensure that at least 95 % of children aged between four and the starting age of compulsory education participate in ECEC. As Figure 4 shows, participation has been rising more or less continuously in the EU since 2002. Several countries had already exceeded the ET 2020 benchmark in 2014, implying almost universal pre-school attendance. France had already achieved a 100 % pre-school attendance, while in Luxembourg, the United Kingdom, Denmark and Belgium participation rates were above 98 %. At the opposite end of the spectrum, the lowest pre-school attendances were observed in Croatia (72.4 %) and Slovakia (77.4 %).
Integrating foreign-born population and ethnic minorities into early childhood education remains a challenge
Gender differences in early childhood education are negligible across the EU. However, children with a migrant background or from ethnic minorities are in a very disadvantaged position. For example, a recent study of 11 Member States revealed a large gap between Roma and non-Roma children attending pre-school and kindergarten in nine of the countries. The EU has since identified accessibility to early childhood education and care for children from ethnic minorities as a priority area within the ECEC participation framework. This reflects the growing consensus at policy level that early pre-schooling has an important role to play in addressing disadvantages and reducing the risk of poverty and social exclusion.
Acquiring skills for the knowledge society
A key objective of all educational systems is to equip people with a wide range of skills and competences. This encompasses not only basic skills such as reading and mathematics, but also more transversal ones such as information and communication technology (ICT) and entrepreneurship.
Basic skills: poor reading, maths and science affect one-fifth of EU pupils
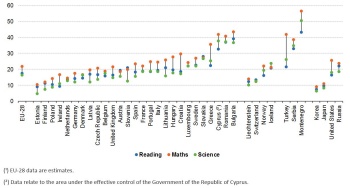
(share of 15-year-old pupils who are below proficiency level 2 on the PISA scales for reading, maths and science)
Source:OECD/PISA, Eurostat online data code (t2020_30)
Basic skills, whether reading simple text or performing easy calculations, provide the foundations for learning, gaining specialised skills and personal development. The ET 2020 framework acknowledges the increasing importance of individual skills in the era of the knowledge-based economy. In response, it has set a target to reduce the share of 15 year olds achieving at most low levels of reading, mathematics and science to less than 15 % by 2020.
In 2012, about one sixth to almost one fourth of 15 year old EU citizens showed insufficient abilities in reading, mathematics and science as measured by the OECD’s PISA study [4]. The test results were best for science, with a 16.5 % share of low achievers, followed by reading with 17.8 % and maths with 22.0 %. Figure 5 shows how the overall performance in reading, mathematics and science varied significantly across countries. The share of pupils failing to acquire competences in the key subjects surpassed 36 % in Bulgaria and Romania. However, Estonia, Finland, Poland and the Netherlands had the lowest share of low achievers in reading, mathematics and science with levels below 15 %.
Compared with international competitors, the overall EU’s share of low achievers in reading, maths and science was similar to that of the United States. However, it was higher than for Japan and Korea, where the shares of low-achieving pupils in 2012 were below 12 % and 10 % respectively.
Achievement in science has shown the strongest progress at the EU level since 2000, while improvement in mathematical competences has been the slowest. For the EU as a whole, the ET 2020 benchmark implies that the share of low achievers needs to be reduced by a tenth (for science) to almost a third (for maths) compared with 2012 levels.
A large gender gap in reading performance can be seen. In 2012, the share of low achieving OECD pupils was about twice as high among boys (23.6 %) than among girls (11.7 %). This means girls have already reached the ET 2020 framework’s 15 % reading benchmark and that effort needs to be focused on boys to balance performance levels. Gender differences are considerably smaller in the other key subject areas. Boys slightly outperform girls in maths and girls slightly outperform boys in science.
Wide variations in foreign language learning across Member States
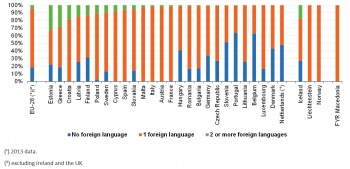
(% of pupils at ISCED level 1)
Source: Eurostat online data code (educ_uoe_lang02)
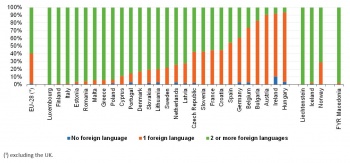
(% of pupils at ISCED level 2)
Source: Eurostat online data code (educ_uoe_lang02)
The ability of citizens to communicate in at least two languages besides their mother tongue has been identified as a key priority in the EU’s ET 2020 framework. The European Commission has proposed monitoring student proficiency in the first foreign language and the uptake of a second foreign language at lower secondary level. Member States must ensure the quantity and quality of foreign language education is scrutinised and that teaching and learning are geared towards practical, real-life application [5]. Foreign language skills should be taken into account in the effort to equip young people with the competences needed to meet labour market demands.
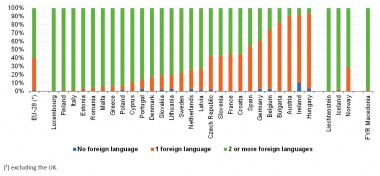
Schools teach foreign languages in all Member States, making language learning a central element in every child’s school experience across Europe. Figure 6 shows the number of modern foreign languages studied in primary education (ISCED level 1) in 2014. In Austria, Croatia, Cyprus, Italy and Malta the study of a second language was almost universal at this level. Nonetheless, on average, 18 % of pupils across the EU were not engaged in language learning at this level in 2013. This number was higher in 2010 with 23.1 %.
Figure 7 shows that the share of students learning no foreign language dropped below 2 % in lower secondary education (ISCED level 2) across the EU. On the other hand, students learning two or more foreign languages reached almost 60 %. In Luxembourg, all of the students learned two languages, followed by Finland and Italy with shares of 98 %.
English was the most studied foreign language across the EU, with 97.3 % of students learning it in 2014 (at ISCED level 2). This represents a substantial increase in its popularity, compared with 75.4 % a decade earlier. French, German and especially Spanish have also been steadily gaining popularity over that time.
ICT skills: enhancing digital competences
Enhancing digital competences to exploit the potential of information and communication technologies (ICT) is a key priority under the Europe 2020 strategy. Its flagship initiative ‘Digital Agenda for Europe’ aims to help achieve this goal. The lack of digital literacy and skills is seen as ‘excluding many citizens from the digital society and economy. It is also holding back the large multiplier effect of ICT take-up on productivity growth’. ICT skills are also relevant to the Europe 2020 strategy’s headline indicator on R&D expenditure. An analysis of European citizens’ computer and internet skills is provided in the ‘R&D and innovation’ article.
Tertiary education and lifelong learning on the rise in the EU
The proportion of tertiary graduates is growing rapidly
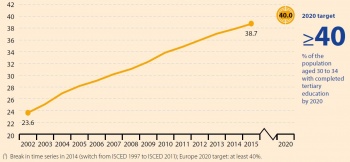
(% of the population aged 30 to 34 with completed tertiary education)
Source: Eurostat online data code (t2020_41)
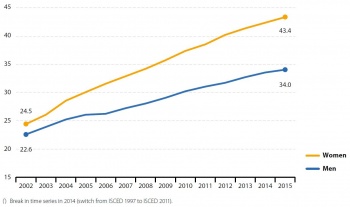
(% of the population aged 30 to 34 with completed tertiary education)
Source: Eurostat online data code (t2020_41)
Raising the share of the population aged 30 to 34 that have completed tertiary or equivalent education to at least 40 % is the second of the two Europe 2020 education targets. It is monitored with the headline indicator that follows tertiary educational attainment of the same age group [6].
Figure 8 shows a steady and considerable growth in the share of 30 to 34 year olds who have successfully completed university or other tertiary-level education since 2002. The share of 38.7 % in 2015 implied a growth of 15.1 percentage points since 2002.
Women significantly outnumber men in tertiary educational attainment
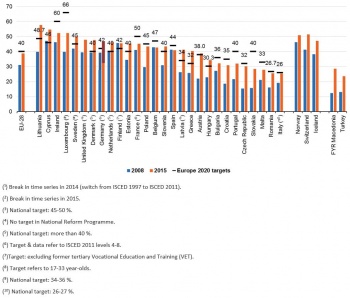
(% of the population aged 30 to 34 with completed tertiary education)
Source: Eurostat online data code (t2020_41)
Figure 9 shows a significantly widening gender gap among tertiary education graduates across the EU. While in 2002 the share was similar for both sexes, the increase up to 2015 was almost twice as fast for women. In 2015, women outnumbered men significantly in terms of tertiary educational attainment in almost all Member States. In fact, 21 countries showed a gender gap of more than 10 percentage points in 2015. In Estonia, Latvia, Lithuania and Slovenia the differences were more than 20 percentage points. Germany was the most ‘equal’ country with a gender gap of only 0.2 percentage points.
Gender differences can also be seen in the fields studied. A significantly higher proportion of men than women graduate in STEM fields (science, technology, engineering, mathematics). Women tend to dominate social sciences, humanities and teaching [7].
Northern and central Europe show the highest tertiary educational attainment
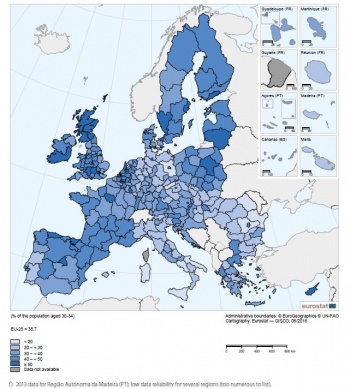
(% of population aged 30 to 34 with completed tertiary education)
Source: Eurostat online data code (edat_lfse_12)
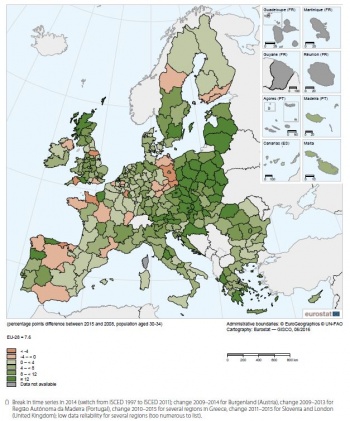
(percentage points difference between 2015 and 2008, population aged 30 to 34 with completed tertiary education)
Source: Eurostat online data code (edat_lfse_12)
The trend in the EU as a whole mirrors increases in tertiary educational attainment levels across all Member States. T This reflects to some extent the Member States’ increased investment in higher education to meet demand for a more skilled labour force. Moreover, the increases can also be ascribed to the shift to shorter degree programmes following implementation of Bologna [8] process reforms in some countries.
National targets for tertiary education range from 26 % for Italy to 66 % for Luxembourg. Germany’s target is slightly different from the overall EU target because it includes post-secondary, non-tertiary attainment (ISCED level 4). For France the target definition refers to the age group of 17 to 33 year olds while for Finland the target excludes former tertiary vocational education and training (VET).
Figure 10 shows that in 2015, 13 countries had already achieved their national targets: Austria, Cyprus, Denmark, Estonia, Finland, Germany [9], Greece, Hungary, Latvia, Lithuania, the Netherlands, Slovenia and Sweden. Italy, Poland and Romania were less than two percentage points away from their national targets. Luxembourg and Slovakia were the most distant, at some 10 percentage points or more below their targets.
In 2015, levels of tertiary educational attainment varied by a factor of about 2.3 across Europe. Northern and central Europe had the highest percentage of tertiary graduates, with 18 countries exceeding the overall EU target of 40 %. The lowest levels could be observed in Italy and Romania, which were both around 25 %.
At the same time, some eastern European countries experienced the strongest increases over the period 2008 to 2015. Changes were most pronounced in Lithuania, Austria, Latvia, Greece and the Czech Republic where the shares almost doubled. Looking at non-EU Europe, the EFTA countries Norway, Switzerland and Iceland were at the level of the best performing Member States in 2015. However, the candidate countries FYR Macedonia and Turkey showed tertiary educational attainment levels similar to southern and eastern European Member States.
The regional differences in tertiary educational attainment across Europe shown in Map 3 are to a large extent in line with general country differences (see Figure 10). In 2015, many regions in Belgium, Finland, France, the Netherlands, Poland, Sweden and the United Kingdom had above average rates. On the other hand, most regions in the Czech Republic, Italy, Hungary, Romania and Slovakia showed a small proportion of tertiary graduates.
Romania and the Czech Republic had the biggest internal dispersion of tertiary educational attainment rates: their worst performing regions had a rate that was three times lower than in the best performing regions. In the Czech Republic, the region of Praha had a share three times as low as the region with the highest rate — Severozápad. In contrast, Austria, Finland and Italy were more ‘equal’ countries, with relatively small disparities in tertiary educational attainment rates across their regions. Only the differences in Croatia and Slovenia were smaller. One possible explanation could be the small number of regions in these countries.
Map 4 shows the change in regional tertiary educational attainment rates since 2008. Of the 269 NUTS 2 regions for which data are available, 86.6 % (or 233 regions) experienced an increase between 2008 and 2015. Among the regions with the highest increases were Peloponnisos [10] and Notio Aigaio (Greece) and Niederösterreich and Burgenland (Austria) [11].
In contrast, tertiary educational attainment rates fell in 33 regions over the period from 2008 to 2015. Eight had falls of more than five percentage points. Three of these were in Spain (Ciudad Autónoma de Ceuta, Ciudad Autónoma de Melilla and Cantabria), two of these were in Germany (Brandenburg and Dresden) and the remaining three in the United Kingdom (Devon), France (Basse-Normandie) and Belgium (Prov. Luxembourg).
Low levels of student mobility in higher education
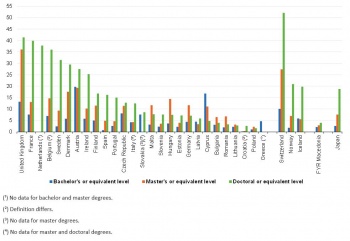
(Share of mobile students from all over the world except for the reporting country)
Source: Eurostat online data code (educ_uoe_mobs03)
Apart from providing valuable academic and cultural benefits, educational mobility is increasingly important for improving young people’s employability and labour market access. Increased mobility in higher education — of students, researchers and staff — is a key priority of the Bologna Process. In 2009, European ministers responsible for higher education met to take stock of the achievements of the Bologna Process. They agreed on the benchmark that ‘in 2020 at least 20 % of those graduating in the European Higher Education Area should have had a study or training period abroad’ (see the corresponding ‘Communiqué’). The benchmark refers to two main forms of mobility: degree mobility (undertaking a full degree programme in another country) and credit mobility (taking part of a study programme in a university abroad). Direct assessment of Member States’ progress towards the EU mobility benchmark cannot be made because the current data on students going abroad do not provide information on graduates’ degree and credit mobility. Nevertheless, statistics on student enrolment in higher education provide a useful indication of general mobility trends.
In 2013, around 1.4 million people undertaking tertiary level studies in Member States were from abroad. This corresponded to 7.5 % of all EU students in 2013. These students were studying in a country other than the one where they had completed their secondary education, regardless of whether this was another Member State or a non-member country. Mobility particularly takes place at the doctorate level, where students specialise at a high level in a specific topic (see Figure 11). Rates are lower at master’s and bachelor’s level.
Most countries in central and eastern Europe host relatively few students from abroad. By contrast, the United Kingdom, France, Austria and the Scandinavian countries show higher shares of mobile students. The range was especially high at doctorate level with student mobility at around 40 % in France, the Netherlands and the United Kingdom and less than 3 % in Croatia, Lithuania and Poland.
Inbound mobility can generally be seen as a sign of the attractiveness of a country’s higher education and its financial and institutional capacity for enrolling foreign students. Outward mobility, on the other hand, might be a result of policies encouraging students to spend part of their studies abroad (credit mobility in particular).
Participation in lifelong learning remains at a distance to the ET 2020 benchmark
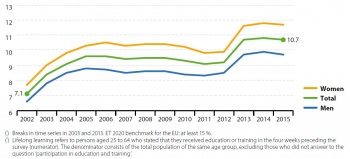
(% of population aged 25 to 64) (2)
Source: Eurostat online data code (tsdsc440)
In addition to tertiary educational attainment, lifelong learning is also crucial for providing Europe with a highly qualified labour force. Adult education and training covers the longest time span in the process of learning throughout a person’s life. After an initial phase of education and training, continuous, lifelong learning is crucial for improving and developing skills, adapting to technical developments, advancing careers or returning to the labour market (also see the Europe 2020 indicators – Employment article). In recognition of this, lifelong learning plays a crucial role in the Europe 2020 flagship initiative 'An Agenda for new skills and jobs' and played an important role in the concluded initiative 'Youth on the move'. In addition, the European Council in 2011 adopted a Council Resolution on a renewed European agenda for adult learning (2011\C 372\01)]. The EU’s ET 2020 framework also includes a benchmark that aims to raise the share of adults participating in lifelong learning to at least 15 %. This benchmark refers to persons aged 25 to 64 who stated that they received education or training in the four weeks preceding the survey.
After growing between 2003 and 2005, the share of EU adults participating in lifelong learning fell slightly to 9.2 % in 2012. It increased to 10.7 % in the following year, but this rise was mainly influenced by a methodological change to the French Labour Force Survey [12]. In 2014, the share reached its highest point of 10.8 %, before falling back to 10.7 % in 2015.
In most Member States participation in lifelong learning stagnated or changed marginally from 2014 to 2015. The largest difference was observed in Hungary, where the rate increased from 3.3 % in 2014 to 7.1 % in 2015 [13]. Over the period 2002 to 2015, nine countries experienced a substantial increase of more than five percentage points: Denmark, Sweden, Finland, Estonia, Portugal, Luxembourg, Spain, Austria and France. The largest increase of 15.9 percentage points was observed in France [14]. In contrast, the largest decrease of 5.6 percentage points was observed in the United Kingdom. In 2015, only seven countries (Denmark, Sweden, Finland, the Netherlands, France, Luxembourg and the United Kingdom) exceeded the ET 2020 benchmark. In 13 Member States, participation in lifelong learning was less than half the required level of 15 %. In 2015, participation rates in lifelong learning in Bulgaria (2.0 %), Romania (1.3 %), Slovakia and Croatia (both 3.1 %) were significantly lower than in Finland (25.4 %), Sweden (29.4 %) and Denmark (31.3 %).
Women participate in lifelong learning more often
Women are more likely to participate in lifelong learning than men. In 2015, the share of women engaged in lifelong learning was 2.0 percentage points higher than that of men (11.7 % compared with 9.7 %). Women recorded higher participation rates in all Member States except for Luxembourg and Germany, where a slightly higher share of men were engaged in lifelong learning. No difference between the sexes could be observed in Greece and Romania. The largest differences were observed in Sweden with 14.4 percentage points and in Denmark with 12.0 percentage points.
The foreign-born population also tends to be slightly more involved in lifelong learning (12.1 % in 2015). This may reflect participation in targeted learning activities such as language courses. It may also be linked to higher unemployment rates among migrants in some countries, resulting in a greater participation in labour market integration programmes (see article on ‘Employment’).
There is a clear correspondence of participation in lifelong learning and a person’s educational attainment. In 2015, people with at most lower secondary education were less engaged in lifelong learning (4.3 %) than those with upper secondary (8.8 %) or tertiary education (18.8 %). In relation to labour status, employed people in general show a slightly higher participation rate in lifelong learning. Some 11.6 % of employed 25 to 64 year olds took part in lifelong learning in 2015. Among unemployed people, the rate was slightly lower than the total participation rate, at 9.5 %.
How do education levels affect labour market participation?

(%)
Source: Eurostat online data code (edat_lfse_03)
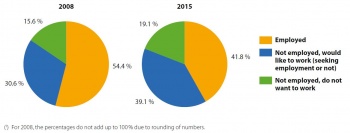
(% of the population aged 18 to 24 with at most lower secondary education and not in further education or training) (1)
Source: Eurostat online data code (edat_lfse_14)
Younger people show higher educational attainment levels
Educational attainment is the visible output of education systems. Achievement levels can have major implications for many issues touching a person’s life. This is reflected in participation in lifelong learning as well as in other aspects presented in the articles on ‘[ '%5b%20http:/ec.europa.eu/eurostat/statistics-explained/index.php/Europe_2020_indicators_-_employment%20Employment%5d' Employment]’ and ‘Poverty and social exclusion’.
Upper secondary education is now considered the lowest desirable attainment level for European citizens leaving the education and training system. This is reflected in the Europe 2020 headline indicator on early leavers from education and training. Figure 13 shows the share of the population that has completed upper secondary or tertiary education, broken down by sex and age groups.
In 2015, 83.4 % of 25 to 34 year olds had completed at least upper secondary education, while the share for the age group 55 to 64 was lower, at 68 %. This difference reflects the growing demand for a more highly skilled workforce in most parts of Europe over the past few decades. A more skilled workforce is expected to emerge as older groups steadily leave the workforce and are replaced by a younger, more highly educated generation. If labour markets do not provide adequate jobs, this may result in certain levels of over-qualification and youth unemployment. For older workers aged 55 to 64, lower educational attainment levels, especially among women, highlight the importance of lifelong learning to increase their employability and help meet the Europe 2020 strategy’s employment target (see the article on ‘Employment’).
Educational attainment was highest in eastern European countries, such as Croatia, Slovakia, the Czech Republic, Slovenia and Poland, where levels range from 93 % to 95 % for the age group 25 to 34. Southern European countries, in contrast, showed the lowest education levels. In 2015, between 61 % and 66 % of the population aged 25 to 34 living in Spain and Malta had completed more than lower secondary education. However, these countries have shown the strongest improvements over time, with education levels among 20 to 24 year olds being about twice as high as among those close to retirement.
Figure 13 also shows how women have overtaken men in educational attainment. While in the age group 45 to 64 years attainment was higher for men, the situation was turned around in the population aged 44 and younger. This trend illustrates the gender differences observed for a number of the indicators analysed in this article, such as early leavers from education and training, tertiary education and participation in lifelong learning.
Growing difficulties in finding a job for early leavers
Low educational attainment — at most lower secondary education — is usually negatively linked with other socioeconomic variables. The most important of these are unemployment and the risk of poverty or social exclusion. Some of these relationships are also analysed in detail in the respective articles (see the articles on ‘Employment’ and ‘Poverty and social exclusion’).
Early leavers from education and training and poorly educated young people face particularly severe problems in the labour market. As shown in Figure 14, about 60 % of 18 to 24 year olds with at most lower secondary education and who were not in further education or training were either unemployed or inactive in 2015. Of these, two-thirds stated they would like to work. At the same time, the EU’s overall youth unemployment, covering the age group 15 to 24 years, stood at 20.3 %. This implies that unemployment levels among early leavers from education and training are much higher than among the total population of the same age group. For a further analysis on youth unemployment see the articles on ‘Employment’.
Compared with the overall decline in early leaving from education and training, Figure 14 shows it is becoming more difficult for early school leavers to find work. Between 2008 and 2015, the share of 18 to 24 year old early leavers who were not employed but wanted to work grew from less than one-third to nearly 40 %.
Young people neither in employment nor in education and training face a high risk of being excluded from the labour market
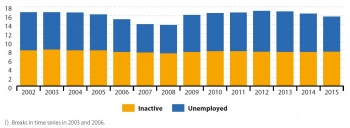
(% of population aged 18 to 24)
Source: Eurostat online data code (edat_lfse_20)
The indicator monitoring young people neither in employment nor in education and training (NEET) covers people aged 18 to 24 years. Low educational attainment is one of the key determinants of young people entering the NEET category. Other factors include having a disability or coming from a migrant background.
In 2015, 15.8 % of 18 to 24 year olds were in the NEET status, putting them at risk of being excluded from the labour market and becoming dependent on benefits. This represents a decrease from 2012 when the NEET rate peaked at 17.2 %, but it was still higher than in 2008, when the NEET rate stood at a low of 14.0 %.
The EU’s NEET rate has been largely influenced by changes in unemployment for 18 to 24 year olds (see Figure 15). In comparison, the share of inactive youths has remained stable at or slightly below 8 %. The rate was slightly higher for women than for men, although the gender gap has closed slightly since the economic crisis began in 2008. In 2015, the NEET rate for 18 to 24 year old women was 16.3 %, with 60.5 % of them being economically inactive. At the same time, the NEET rate for men of the same age group was 15.4 %, but 57.1 % of them were unemployed.
Low educational attainment reduces quality of life
The negative impacts of low educational attainment described here and in the articles on ‘Employment’ and ‘Poverty and social exclusion’ also influence other aspects of a person’s perceived quality of life. Across the EU, the perception of being in good or very good health in 2012 was highest among people who had completed tertiary education (81.6 %). Only slightly more than half (55.1 %) of those with at most lower secondary educational attainment shared this perception.
Matching skills with labour market needs
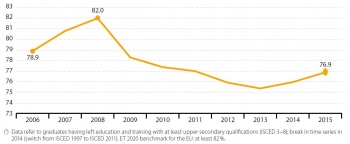
(share of employed graduates (20 to 34 years old) having left education and training in the past one to three years)
Source: Eurostat online data code (edat_lfse_24)
The EU’s ET 2020 framework acknowledges the important role of education and training in raising employability. It has set a benchmark that at least 82 % of recent graduates (20 to 34 year olds) should have found employment no more than three years after leaving education and training.
Figure 16 shows that recent graduates have been affected particularly strongly by the economic crisis. Between 2008 and 2013, employment rates among 20 to 34 year olds who had left education and training in the past one to three years fell by 6.6 percentage points. In comparison, the decline in the overall employment rate for 20 to 64 year olds was ‘only’ 1.9 percentage points over the same period. However, 2013 seems to mark a turnaround in this trend, with the share of employed recent graduates increasing in the two following years, reaching 76.9 % in 2015.
The data in Figure 16 refer to graduates having left education and training with at least upper-secondary qualifications (ISCED levels 3 to 8). Disaggregation by educational attainment reveals that the fall in the employment rate had been stronger for the lower educated cohort (– 6.3 percentage points from 2008 to 2015) than for those with tertiary education (– 5.0 percentage points from 2008 to 2015). This is in line with overall employment rate trends (see the article on ‘Employment’) and underlines the importance of educational attainment for employability.
Investment in future generations: public expenditure on education=
Public expenditure on education as a percentage of GDP is often considered to be an indicator of how committed a government is to developing skills and competences.
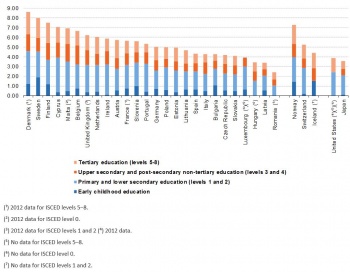
(% of GDP)
Source: Eurostat online data code (educ_uoe_fine06)
Figure 17 shows the total public expenditure on education as a share of GDP in 2013. Data for all four education levels are available for 23 Member States. Nonetheless, all 26 Member States for which data are at least partly available have been included in the following analysis [15].
The highest share of public expenditure on education can be observed in Denmark (8.6 % of GDP), followed by Sweden (8.0 %) and Finland (7.5 %). The lowest proportions were observed in Romania (2.4 %), Latvia (3.4 %) and Hungary (3.4 % both), however, in Romania and Hungary data for one education level are missing, therefore the real proportions might be higher. Latvia was the country with the lowest share of 3.4 % with data for all four education levels. This share was more than half of the share observed in Sweden.
In all 26 Member States, where data were available for primary and lower secondary education (levels 1 and 2), most education funding went to primary and lower secondary education. As a share of GDP, this ratio ranged from 1.0 % in Romania to 3.5 % in Cyprus. By contrast, in nearly all countries, the smallest share of public expenditure on education went to early childhood education [16]. This ratio ranged from 0.1 % in Ireland to 1.9 % in Sweden. In general, in nine of the 24 Member States, public expenditure on this level of education was less than 0.5 % of GDP.
For the two remaining categories (upper secondary and post-secondary non-tertiary education (levels 3 and 4) and tertiary education (levels 5 to 8), the differences were not as high as for the two lower categories. For the upper secondary (including also post-secondary non-tertiary levels), public expenditure ranged from 0.6 % of GDP in Romania to 1.9 % of GDP in Belgium. The proportion of financial resources devoted to the tertiary level varied between the 25 Member States for which data are available, ranging from 0.7 % in Latvia to 2.3 % in Denmark.
Outlook towards 2020
Knowledge of current student cohorts and demographic projections allow educational trends to be estimated up to 2020. This can help identify priority issues that may need particular political attention on the path to meeting the Europe 2020 targets. For example, students who are now in their mid-20s will fall within the scope of the Europe 2020 headline indicator on ‘tertiary educational attainment’, which looks at education levels of the population aged 30 to 34 years.
The flagship initiative ‘An Agenda for new skills and jobs’ addresses the challenge of early leaving from education and training. In 2011, the European Council published recommendations on policies to reduce early leaving from education and training, giving guidance to Member States on the implementation of strategies and measures tackling this problem. Vocational Education and Training (VET) systems are seen as important for improving the employability of young people and reducing early leaving from education and training, by offering an interesting alternative to general education.
Additionally, the Europe 2020 strategy puts particular effort into making sure that higher education programmes develop the skills relevant to the world of work, both for meeting future labour demand and for ensuring the long-term attractiveness of higher education. Moreover, the European Council’s Resolution on a renewed European agenda for adult learning addresses the challenge of raising participation rates of adults in lifelong learning activities.
Data sources and availability
Indicators presented in the article:
- Early leavers from education and training’ (t2020_40)
- Breakdown by NUTS 2 regions (edat_lfse_16)
- Breakdown by sex and labour status (edat_lfse_14)
- Participation in early childhood education (tps00179)
- Pupils between 4 years and the starting age of compulsory education - as % of the corresponding age group (educ_uoe_enra10)
- Low achievers in reading, maths and science: OECD/PISA and (tsdsc450)
- Foreign language learning in general upper secondary education (educ_thfrlan)
- Pupils by education level and number of modern foreign languages studied (educ_uoe_lang02)
- Tertiary educational attainment (t2020_41)
- Breakdown by sex (t2020_41)
- Breakdown by NUTS 2 regions (edat_lfse_12)
- Population aged 30-34 by educational attainment level, sex and NUTS 2 regions (edat_lfse_12)
- Share of mobile students from abroad by education level, sex and country of origin (educ_uoe_mobs03)
- Participation in lifelong learning (tsdsc440)
- Population by educational attainment level, sex and age (edat_lfse_03)
- Young people either in employment nor in education by sex and age (NEET rates) (edat_lfse_20)
- Employment rate of recent graduates (tps00053)
- Total public expenditure on education by education level and programme orientation (educ_uoe_fine06)
Context
Education and training lie at the heart of the Europe 2020 strategy and are seen as key drivers for growth and jobs. The recent economic crisis along with an ageing population, through their impact on economies, labour markets and society, are two important challenges that are changing the context in which education systems operate (also see the Europe 2020 indicators — Employment article). At the same time education and training help boost productivity, innovation and competitiveness.
Nowadays upper secondary education is considered the minimum desirable educational attainment level for EU citizens. Young people who leave education and training prematurely lack crucial skills and run the risk of facing serious, persistent problems in the labour market and experiencing poverty and social exclusion. Early leavers from education and training who do enter the labour market are more likely to be in precarious and low-paid jobs and to draw on welfare and other social programmes. They are also less likely to be ‘active citizens’ or engage in lifelong learning (European Commission, 2016).
In addition, tertiary education, with its links to research and innovation, provides highly skilled human capital (see the article on ‘R&D and innovation’). A lack of these skills presents a severe obstacle to economic growth and employment in an era of rapid technological progress, intense global competition and labour market demand for ever-increasing levels of skill. The Europe 2020 strategy, through its ‘smart growth’ priority, therefore aims to tackle early school leaving and to raise tertiary education levels (European Commission, 2016).
The analysis in this article builds on the headline indicators chosen to monitor the strategy’s education targets: ‘Early leavers from education and training’ and ‘Tertiary educational attainment’. Contextual indicators are used to provide a broader picture and insight into drivers behind changes in the headline indicators. Some are also used to monitor progress towards additional benchmarks set under the EU’s Strategic Framework for Education and Training 2020 (ET 2020). These indicators include early childhood education, basic reading, maths and science skills and adult participation in lifelong learning. The benchmarks are listed in the section 'Data sources and availability'.
ET 2020 — the EU’s Strategic Framework for Education and Training 2020
The two Europe 2020 education targets also feature as EU benchmarks under the Strategic Framework for Education and Training 2020 (ET 2020). ET 2020 aims to foster European cooperation in education and training, providing common strategic objectives for the EU and its Member States for the period up to 2020. ET 2020 covers the areas of lifelong learning and mobility; quality and efficiency of education and training; equity, social cohesion and active citizenship; and creativity, innovation and entrepreneurship at all levels of education and training. To support the achievement of these objectives ET 2020 sets EU-wide benchmarks. In addition to the two Europe 2020 targets for education, there are another five benchmarks:
- An average of at least 15 % of adults should participate in lifelong learning.
- The share of low-achieving 15 year olds in reading, mathematics and science should be less than 15 %.
- At least 95 % of children between the age of four years and the age for starting compulsory primary education should participate in early childhood education.
- An EU average of at least 20 % of higher education graduates and of at least 6 % of 18 to 34 year olds with an initial vocational qualification should have had some time studying or training abroad [17].
- The share of employed graduates (20 to 34 year olds) having left education and training no more than three years before the reference year should be at least 82 %.
See also
Further Eurostat information
Publications
Main tables
Dedicated section
Methodology / Metadata
- Towards robust quality management for European Statistics - Communication from the Commission to the European Parliament and the Council COM(2011) 211 final
Other information
- Regulation (EC) No 223/2009 of 11 March 2009 on European statistics
External links
Notes
- ↑ European Commission, Taking stock of the Europe 2020 strategy for smart, sustainable and inclusive growth, COM(2014) 130 final, Brussels, 2014.
- ↑ The Former Yugoslav Republic of Macedonia.
- ↑ According to the Education and Training Monitor 2015, Data for foreign-born individuals have to be interpreted with some caution, as they are only available for a number of Member States, with many of them yielding sample sizes too small to be fully reliable.
- ↑ PISA is an international study that was launched by the OECD in 1997. It aims to evaluate education systems worldwide every three years by assessing 15-year-olds’ competencies in the key subjects: reading, mathematics and science. For further details see http://www.oecd.org/pisa/
- ↑ The Member States play an important role in the development of national assessments of language learning. See in particular the May 2014 Council Conclusions on Multilingualism and the development of language competence.
- ↑ Educational attainment is defined according to the International Standard Classification of Education (ISCED). Tertiary educational attainment refers to ISCED 2011 level 5–8 (for data as from 2014) and to ISCED 1997 level 5–6 (for data up to 2013).
- ↑ For more information, see The education and training monitor 2015, p. 44.
- ↑ The Bologna process put in motion a series of reforms to make European higher education more compatible, comparable, competitive and attractive for students. Its main objectives were: the introduction of a three-cycle degree system (bachelor, master and doctorate); quality assurance; and recognition of qualifications and periods of study. (source: Education and training statistics introduced (accessed 25 April 2016).
- ↑ Germany: Target & data including ISCED level 4.
- ↑ Increase between 2010 and 2015.
- ↑ The rise in Austria was mainly influenced by a methodological change. Increase for Burgenland between 2009 and 2015.
- ↑ INSEE, the French Statistical Office, has carried out an extensive revision of the questionnaire of the Labour Force Survey. The new questionnaire was used from 1 January 2013 onwards. It impacts significantly the level of various French LFS-indicators. Detailed information on these methodological changes and their impact is available in INSEE’s website http://www.insee.fr/fr/themes/info-rapide.asp?id=14 Box ‘Pour en savoir plus’.
- ↑ It has to be mentioned that the increase in Hungary may be partly due to a methodological change.
- ↑ This rise was mainly influenced by a methodological change to the French Labour Force Survey, see the previous footnote.
- ↑ There is no data available for Croatia and Greece.
- ↑ The analysis takes in consideration all ISCED0 (i.e. early childhood education development - ISCED01 and pre-primary - ISCED0.2). Early childhood education development is not obligatory by the EU Regulation, therefore not provided by all countries.
- ↑ For futher information, see: http://ec.europa.eu/programmes/erasmus-plus/
