Environmental tax statistics
Data extracted in July 2023
Planned article update: 24 July 2024
Highlights
In 2021, total environmental tax revenue in the EU amounted to €331.3 billion, representing 2.2 % of EU GDP and 5.5 % of total EU government revenue from taxes and social contributions.
Taxes on energy in the EU accounted for more than three-quarters of the total revenues from environmental taxes (78 % of the total) in 2021, well ahead of taxes on transport (18 %) and pollution and resources (3.6 %)
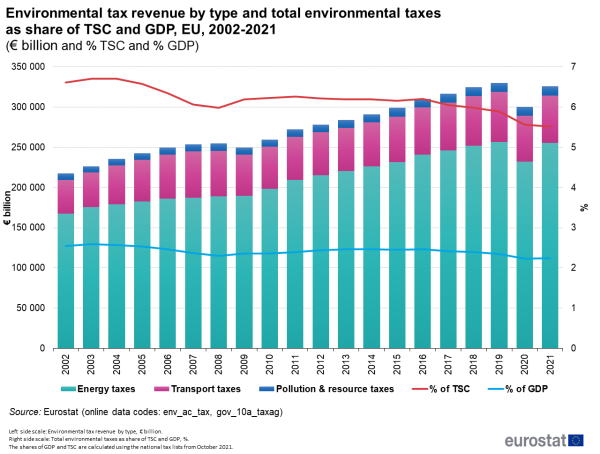
(€ million, %)
Source: Eurostat (env_ac_tax)
This article provides an overview of environmental taxes in the European Union (EU). According to Regulation (EU) N° 691/2011 on European environmental economic accounts, an environmental tax is a tax whose tax base is a physical unit (or a proxy of it) of something that has a proven, specific negative impact on the environment and which is defined in the European system of accounts (ESA 2010) as a tax. European statistics distinguish four different categories of environmental taxes relating to energy, transport, pollution and resources. For more detailed information, see Environmental tax statistics - detailed analysis[1].
Full article
Environmental taxes in the EU
In 2021, the governments in the EU collected environmental tax revenue of €331.3 billion. The value represented 2.2 % of the EU gross domestic product (GDP) and 5.5 % of the EU total government revenue from taxes and social contributions (TSC)[2] (see Table 1).
Table 1 presents the breakdown of environmental tax revenue by type of tax and payer.
A very large portion of the 2021 EU environmental tax revenue – 78 % - came from energy taxes. Transport taxes accounted for 18 %, and the share of taxes on pollution and resources was very small (3.6 %) in the EU.
The tax burden varied by environmental tax category and sector (see also Table 1 and Figures 4 and 5). While corporations paid the highest share of energy taxes (49.3 % in 2021[3]) the share levied on households was almost as high as on corporations (47.1 %). Households were however the main payer of transport taxes (68.3 % in 2021), and they paid a larger portion of pollution and resource taxes (54.5 %). Residents paid a very large majority of the environmental taxes, with a relatively small share (3.4 %) payable by non-residents.
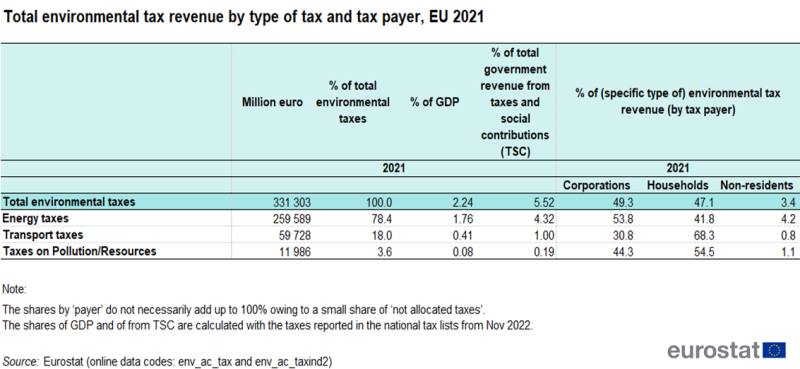
Source: Eurostat (env_ac_tax) and (env_ac_taxind2)
Since 2002, the environmental tax revenue's share in total government revenue from taxes and social contributions has slightly decreased
The 2021 value of the EU environmental taxes was around €108.2 billion higher than in 2002 (see Figure 1). Relative to GDP, its level has, however, decreased (from 2.6 % to 2.2 % of GDP). Over the same period, the share of the environmental taxes in TSC decreased by 1.1 percentage points (pp), from 6.6 % in 2002 to 5.5 % in 2021.
Still, the evolution of the environmental tax revenue relative to GDP and TSC seems to have changed its pattern in 2008, and again in 2016. After five years of consecutive decreases, it started to increase in 2009 (presumably due to the economic recession and drop in both nominal GDP and government revenue, as a result of the financial crisis) and it remained relatively stable for seven subsequent years. Starting from 2017, the ratios have again been slightly falling.
For the first COVID-19 crisis year of 2020 the majority of the countries reported significant decreases in energy taxes compared with 2019. EU registered a 9 % decrease between 2019 and 2020 and five countries (Estonia, Luxembourg, Malta, Austria and Slovenia ) had a decrease of energy taxes over 15 %. In 2021 the total EU energy taxes raised by 12 % compared with 2020. Looking only at the total for Industries, the EU registered a 9 % decrease between 2019 and 2020 and four countries (Estonia, Greece, Luxembourg and Austria) had a decrease of energy taxes over 20 %. In 2021, only Cyprus and Finland recorded a small decrease, respectively of -1.5 % and of -0.6 %, of the energy taxes, compared with 2020. The EU total for Industries for energy taxes rose by 18 % in 2021, compared with 2020.
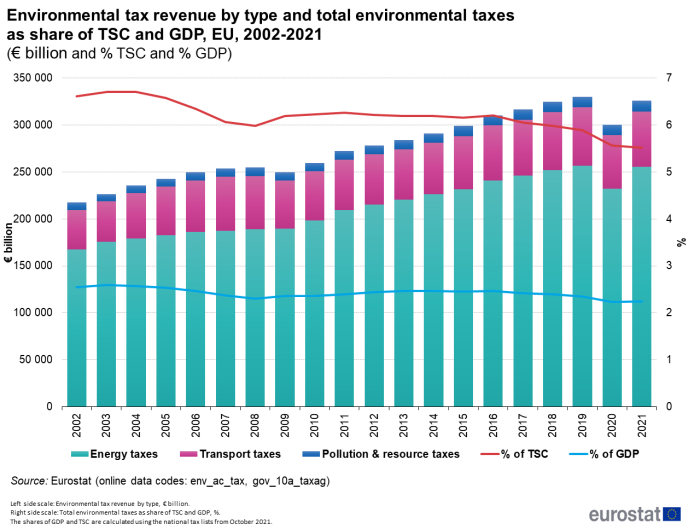
(€ million, %)
Source: Eurostat (env_ac_tax)
Environmental tax revenue varied across the EU Member States, but energy taxes remained the main source in most of the countries
Figure 2 shows the 2021 environmental tax revenue by country both as a percentage of GDP and of TSC, presenting for the latter also the split by type of tax.
Across the EU, the environmental tax revenue-to-GDP ratios ranged in 2021 from 1.2 % (Ireland) to 3.9 % (Greece). The environmental taxes to TSC ratios also varied across the EU Member States, with Greece (9.5 %) reporting the largest shares of environmental taxes in TSC, and Germany (4.2 %) and Luxembourg (3.6 %) the lowest.
Taxes on energy accounted for over half of the environmental tax revenue in all EU Member States in 2021, being by far the largest source of environmental taxes in Czechia, Luxembourg, Romania, Estonia, Poland and Slovakia (with more than 90 % share of the total environmental tax revenue).
Transport taxes were the second-largest component of the environmental tax revenue for all EU Member States but Estonia. The contribution of transport taxes to the total was particularly high in Denmark (41 %), Austria (38 %), Malta, Ireland, Netherlands and Portugal (with slightly more than 20 %).
Pollution and resource taxes account for a very small portion of the environmental tax revenue. They group a variety of taxes, levied e.g. on waste, water pollution and abstraction. In many European countries, such taxes were introduced later than energy or transport taxes and only small values of this category of taxes are reported up to now. As yet, no taxes of this category have been reported for Germany. Other countries like Malta, the Netherlands and Hungary recorded shares of pollution and resource taxes that, albeit small, are larger than in other EU Member States.
The breakdown of the environmental tax revenue by category is also available for three EFTA countries. For details, see Figure 2.
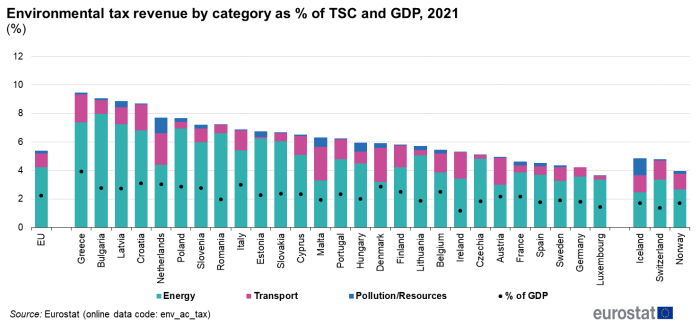
(%)
Source: Eurostat (env_ac_tax)
Between 2020 and 2021, environmental tax revenue dropped as % of GDP and of TSC in 20 EU Member States
Most of the EU Member States recorded a lower share of environmental tax revenue in TSC in 2021, although for the majority the drop remained marginal (below 0.5 pp). Larger decreases were observed in Malta, Bulgaria and Latvia (respectively 1.2 pp and 0.8 pp). Seven EU Member States showed an increase in the share of environmental tax revenue in TSC, the highest being recorded for Greece and Poland with 0.36 pp and 0.7 pp respectively.
Although the changes in the environmental tax revenue-to-GDP ratios between 2020 and 2021 are not quite as significant, differences can be noted between EU Member States. Some countries kept or slightly increased their 2020 environmental tax revenue-to-GDP ratio, but for 20 countries, the ratio decreased in 2021, with the largest decreases recorded by Malta, Latvia and Denmark (more than 0.3 pp). For details, see Figure 3.
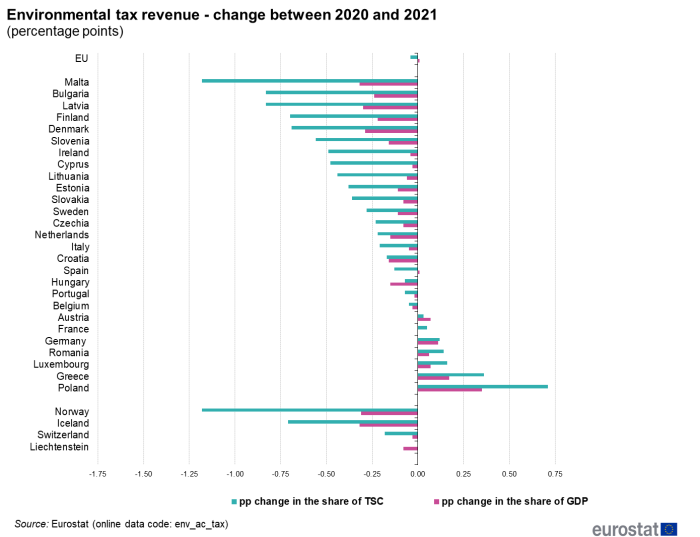
(percentage points)
Source: Eurostat (env_ac_tax)
Environmental taxes by payer
Corporations contribute half to the total energy tax revenue
In 2021 corporations in the EU paid more than half of all energy tax revenue collected by governments. The contribution of households was 41.8 % and the remainder related to the amounts payable by non-residents or that could not be allocated to a specific group of payers.
Among the EU Member States, Luxembourg stands out with the largest share of the energy tax revenue (57 %) collected from non-residents, largely due to non-resident purchases of petrol and diesel. In Malta, non-residents also made a substantial contribution to the energy tax revenue of the country (43.3 %).
In 2021, households paid 61.4 % of total energy taxes in Denmark and 57.9 % in Cyprus (see Figure 4).
Services (including transportation and trade) accounted for 25.8 % of the EU energy tax revenue, with Croatia and Latvia recording shares of over 40 %. Manufacturing, construction, mining and utilities generated over 25.2 % of the EU energy tax revenue.
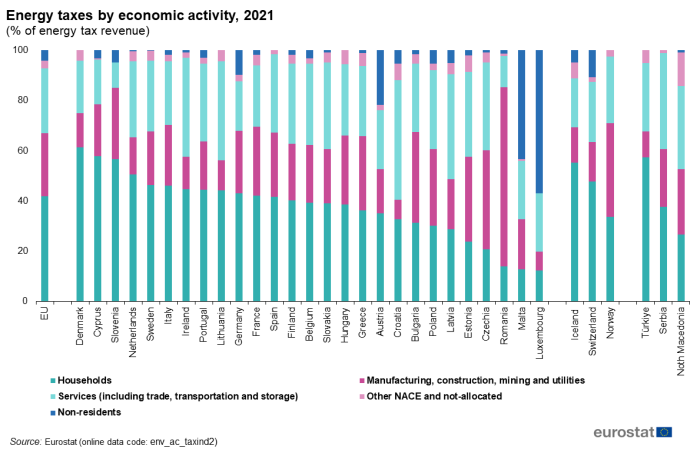
(% of energy tax revenue)
Source: Eurostat (env_ac_taxind2)
Households paid over two-thirds of the EU transport taxes
On average, transport taxes paid by households accounted in 2021 for a larger share (68.3 %) of the EU transport taxes than those paid by the business sector (31 %) (see Figure 5). This is because households are the main payer of the motor vehicle tax revenue (an important component of transport tax revenue) in the EU.
In six EU Member States – Austria, Germany, Spain, Finland, Italy and Malta – the households' share in transport taxes exceeded 75 %.
However, in some EU Member States the structure of transport tax revenue by payer differed considerably from the EU average, e.g. households contributed only marginally to transport tax revenue in Czechia (with the share of 3.5 %) and in Slovakia (9.7 %).
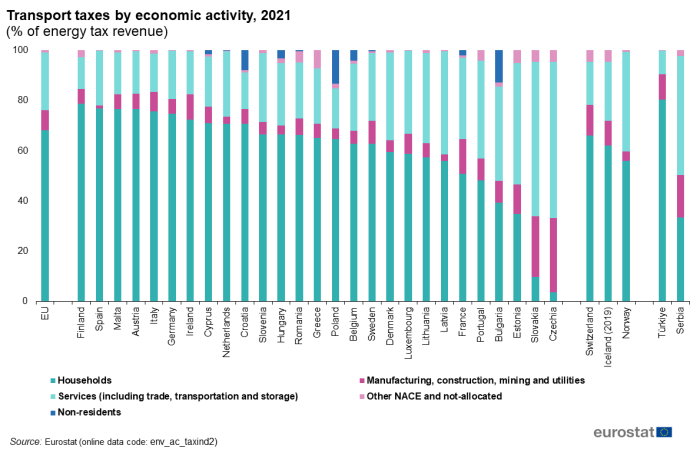
(% of energy tax revenue)
Source: Eurostat (env_ac_taxind2)
Implicit tax rate on energy
The implicit tax rate on energy is defined as the ratio of energy tax revenue to final energy consumption calculated for a calendar year. Energy tax revenues are measured at constant price euros (deflated with the implicit GDP deflator, prices of year 2010 ) and final energy consumption is measured in tonnes of oil equivalent (toe); as such the implicit tax rate on energy is expressed in terms of euro per tonne of oil equivalent (€ per toe). The implicit tax rate on energy is not influenced by the size of the tax base and provides a measure of the effective average level of energy taxation. It is a very broad indicator, capturing information on a variety of energy products with different tax rates.
From 2002 to 2021, the implicit tax rate on energy increased by 13.5 % in real terms (in other words, after deflating the energy tax revenue), changing from €205.8 per toe to €233.5 per toe (at 2010 prices). Between 2002 and 2008, the implicit tax rate on energy decreased. From 2008 to 2014, overall, strong annual increases were observed (except in 2010). From 2014 to 2019, implicit tax rate increased only very slightly (by €2.3 per toe), but in 2020, there was a sharp decrease of €14.2 per toe compared with the previous year.
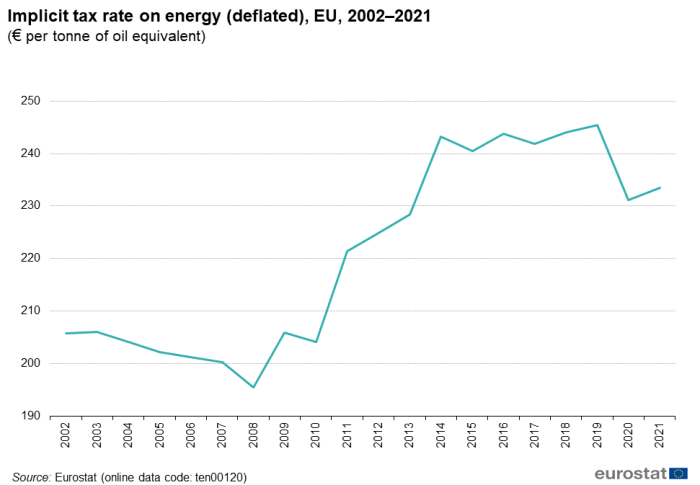
(€ per tonne of oil equivalent)
Source: Eurostat (ten00120)
Source data for tables and graphs
Data sources
Using the 'National Tax List', a supporting dataset to Table 9 from the ESA transmission programme, Eurostat gathers data on environmental taxes for three categories - energy, transport, pollution/resource taxes; the data are then validated and published.
Eurostat also collects data on environmental taxes at a more detailed level, by economic activity, under Regulation (EU) N° 691/2011 on European environmental economic accounts. The Eurostat publication titled 'Environmental taxes — a statistical guide' constitutes the methodological basis for this data collection.
Data relating to environmental taxes can be used to analyse the revenue stream from such taxes and to provide a relative measure of the importance of these taxes through the calculation of ratios relative to GDP or to the total revenue from all taxes and social contributions. In the first case (ratio relative to GDP), the comparison helps to provide an understanding of the tax burden. In the second case, the comparison helps to assess whether or not the tax burden is shifting from other tax bases (for example, labour income) towards environmental taxes. It has to be noted that the total revenue of taxes and social contributions used to compute the ratio does not include imputed social contributions. For further information concerning various tax aggregates, see 'Main national accounts tax aggregates'.
Environmental tax revenue can also be allocated according to the different economic activities paying the taxes. Eurostat collects data on environmental taxes using a categorisation by economic activity (based on the NACE Rev. 2 classification supplemented by information for households, non-residents and a residual category for taxes that could not be allocated).
Increasing revenue from environmental taxes should be interpreted with caution. The increases may be caused by the introduction of new taxes or an increase in tax rates, or alternatively may be linked to an increase in the tax base caused, for instance, by a higher consumption of energy products.
Context
Economic instruments for pollution control and natural resource management are an important part of environmental policy in the EU Member States. The range of instruments that are available includes, among others, environmental taxes, fees and charges, tradeable permits, deposit-refund systems and subsidies.
The European Green Deal creates the context for well-designed tax reforms which boost economic growth and resilience to climate shocks and help contribute to a fairer society and to a just transition. Environmental taxes play a direct role by sending the right price signals and providing the right incentives for sustainable behaviour by producers, users and consumers.
The use of economic tools for the benefit of the environment is also promoted in Goal 17 of the EU sustainable development goals.
Direct access to
- Environmental tax revenues (ten00141)
- Energy taxes (ten00139)
- Implicit tax rate on energy (ten00120)
- Environmental tax revenues (ESMS metadata file — env_ac_tax_esms)
- Environmental taxes by economic activity (NACE Rev. 2 ) (ESMS metadata file — env_ac_taxind2_esms)
- Implicit tax rate on energy (ITR) (ESMS metadata file — ten00120_esmsip)
- Regulation (EU) No 691/2011 of 6 July 2011 on European environmental economic accounts
- Summaries of EU legislation: European environmental economic accounts
Notes