Entrepreneurship - statistical indicators
Data extracted in February 2020
Planned article update: July 2024
Highlights
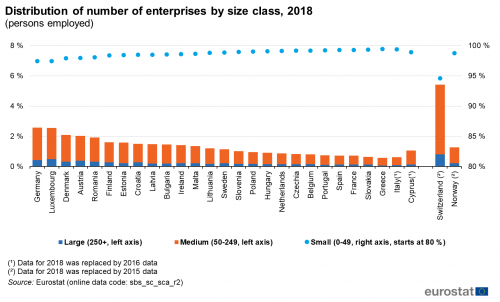
In 2018, the majority of enterprises in the EU were small enterprises, with shares of 97 % or above among the EU countries.
Source: Eurostat (sbs_sc_sca_r2)
This article highlights aspects of entrepreneurship in the European Union (EU) using data from structural business statistics (SBS), business demography (BD), and international trade in goods statistics by enterprise characteristics (TEC).
Full article
Small, medium-sized and large enterprises
Small enterprises make up vast majority of enterprises
Small enterprises are defined as having fewer than 50 persons employed. Figure 1 shows that in 2018 they made up the vast majority of enterprises in the EU, ranging from 97 % in Germany and Luxembourg, 95 % in the EFTA country Switzerland, to 98 % and above in the remaining EU Member States (only countries for which data are available are shown in the figures in this article). By contrast, large enterprises, with 250 or more persons employed account for 0.5 % or less of all enterprises in all EU Member States. Medium-sized enterprises, which employ between 50 and 249 persons, are generally more predominant in countries with a greater proportion of large enterprises.
![A stacked bar chart showing the distribution of the number of enterprises in the EU by size class for the year 2018. Data are show as percentage of persons employed for the EU Member States and some of the EFTA countries]](/eurostat/statistics-explained/images/thumb/b/b2/Distribution_of_number_of_enterprises_by_size_class%2C_2018_%28persons_employed%29.png/500px-Distribution_of_number_of_enterprises_by_size_class%2C_2018_%28persons_employed%29.png)
Source: Eurostat (sbs_sc_sca_r2)
Small enterprises account for about half of employment
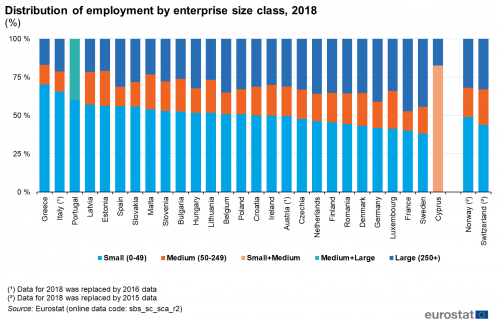
The distribution of total employment across small, medium-sized and large enterprises is shown in Figure 2. In 2018, small enterprises typically accounted for between 40 % and 60 % of total employment. Greece, at the higher end, had 70 % of employment in small enterprises, while the same share in Sweden, at the lower end, was 38 %. Looking at Figures 1 and 2 together, small and medium-sized enterprises typically account for 99.5 % or more of enterprises but account for approximately two thirds of total employment.
Source: Eurostat (sbs_sc_sca_r2)
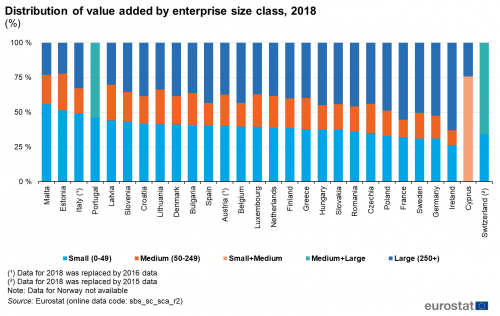
The distribution of value added by size class in 2018 is shown in Figure 3. Small enterprises generally account for around 35 % to 50 % of the total value added. However, the lowest shares of value added by small enterprises are found in Ireland (26 %), Germany (31 %), Sweden (31 %), France (32 %) and Poland (33 %); the highest share is found in Malta (56 %).
Source: Eurostat (sbs_sc_sca_r2)
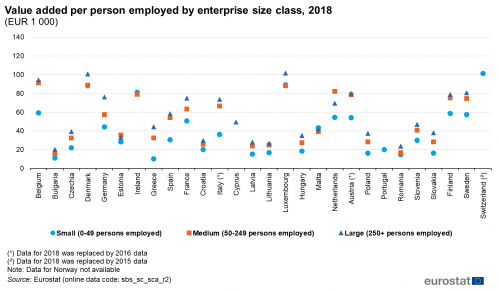
Due to economies of scale, value added per employed person is generally higher in large enterprises than in small enterprises (see Figure 4). However, in several countries value added per person appears to be the same in medium-sized and large enterprises, while small enterprises show somewhat lower value added per employed person.
Source: Eurostat (sbs_sc_sca_r2)
Business Demography
Enterprises average size tends to grow with age
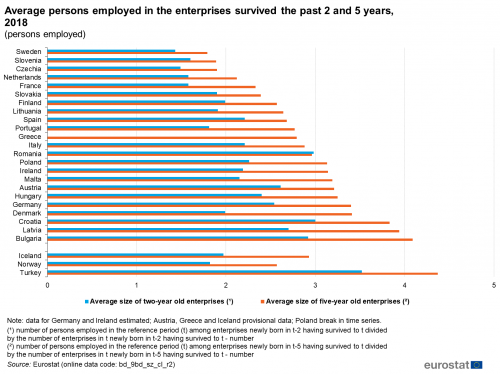
Business demography tracks employment in enterprises that are established in a certain year and survive for between 1 to 5 years. Based on these statistics, Figure 5 shows the average size of enterprises in terms of employment. The data points to two-year-old enterprises and five-year-old enterprises in reference year 2018. It clearly indicates that the five-year-old enterprises operating in 2018 had a substantially higher average employment than the two-year-old enterprises of the same year. This growth in the average size of enterprises is probably intensified due to the fact that a number of poorly performing enterprises established 5 years previously have more frequently ceased their operation compared to the two-year-old enterprise population. This observed pattern is valid for all countries except for Romania.
The average employment of the population of five-year-old enterprises still operating in 2018 was the lowest (fewer than 2 persons) in Sweden Slovenia and Czechia. On the other hand, the highest average employment of five-year-old enterprises was recorded for Bulgaria and Latvia, where these enterprises accounted for an average of 4 persons employed in the business sector.
Source: Eurostat (bd_9bd_sz_cl_r2)
Employment contribution of two-year-old enterprises dominant over five-year-old enterprise population
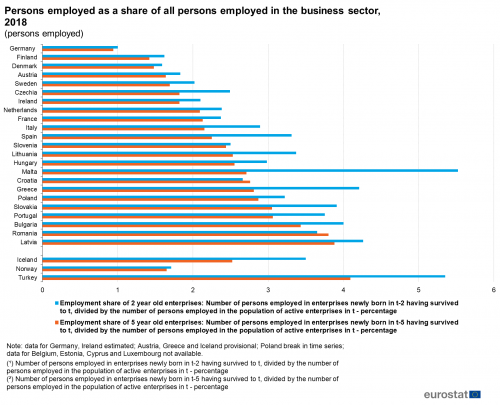
An analysis of the role of the two-year-old and five-year-old survivor enterprises results in a different outcome if looking at the absolute employment contribution of these enterprises instead of the growth in average size. Based on Figure 6, it is quite clear that in all countries - except in Romania and Croatia - the employment share of the two-year-old enterprise population is dominant over the population of five-year-old enterprises. This can be partly explained by the fact that the population of five-year-old enterprises has been reduced every year, since not all enterprises that started up 5 years previously have survived during the period. However, typically in half of the countries the employment shares of two-year-old and five-year-old enterprises are quite close, while the other half of the countries show a considerable dominance in employment of two-year-old enterprises over the five-year-old ones.
The employment contribution of two-year-old and five-year-old enterprises is generally between 1 % to 4 % of all persons employed in the business sector. The lowest share for these young enterprise groups was recorded for Germany, followed by Finland, Denmark and Austria as well as the EFTA country Norway, where these enterprises accounted for a share of between 1 % and 2 %. At the other end, Latvia and Romania recorded the highest employment contribution of these groups, around 4 %.
Source: Eurostat (bd_9bd_sz_cl_r2)
High-Growth enterprises connected to entrepreneurship
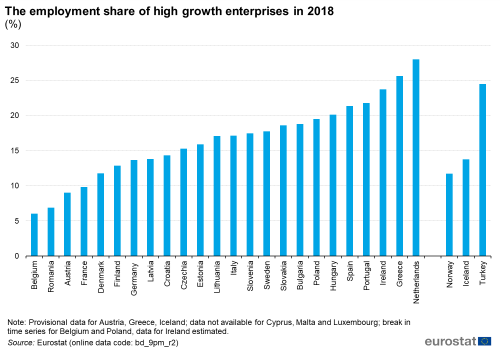
High-growth enterprises are often considered to have a key role for economic growth. Very often these enterprises are micro or small enterprises and therefore close to the concept of entrepreneurship. High-growth enterprises are defined as having an average annualised growth in employment greater than 10 % over a three-year period. An additional condition is that they employ a minimum of ten persons at the beginning of the growth.
The overall contribution of high-growth enterprises to employment is considerable, as shown in Figure 7. The range varies from as low as 6 % in Belgium to as high as 28 % in the Netherlands. The central role of high-growth enterprises is emphasised as these enterprises typically account for around 15 % of the total persons employed in the business sector. More information on high-growth enterprises can be found in the recent news item on high-growth enterprises in the EU.
Exports of goods by enterprise size class
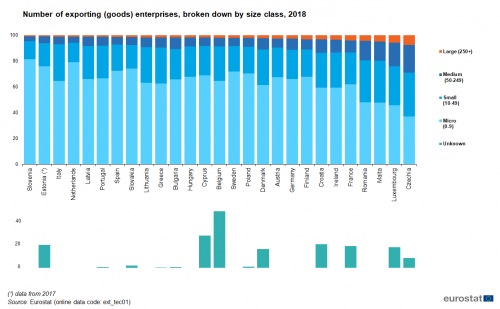
Figure 8 shows the share of exports by enterprise size class. For many countries, the enterprise size class for a relatively large share of exports is unknown (represented by the green bar at the bottom of the graph), impacting somewhat the country comparisons. An overall conclusion is that, in terms of the number of enterprises, the micro enterprises with less than 10 persons employed dominate the exports of goods. Typically, these micro enterprises represent around 60 % to 70 % of all exporting enterprises, although Sweden, Spain, Estonia, the Netherlands, Slovenia, Slovakia and Poland are above this, and Croatia, Romania, Luxembourg, Czechia, Malta and Ireland are below. Small enterprises with 10 to 49 employees, together with micro enterprises, generally account for around 90 % of the exporting enterprises. The highest shares of these enterprises were recorded in Slovenia (95 %), followed by the Netherlands and Estonia (each 94 %), while the lowest shares were recorded in Luxembourg ((76 %) and Czechia (71 %).
Source: Eurostat (ext_tec01)
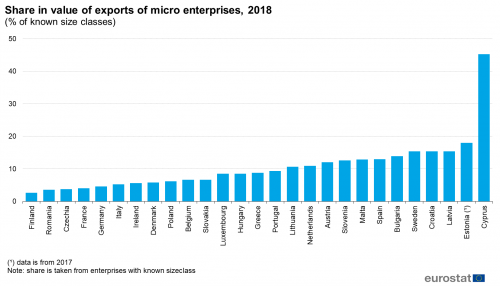
Even though small and micro enterprises are dominant when measured by the number of enterprises, they generally account for a rather modest share of the exports value. Micro enterprises employing less than 10 persons is obviously the most relevant size class when dealing with entrepreneurship. Figure 9 shows the share micro enterprises have in exports of goods, but note that in some countries the share of unknown enterprise size was significant. The export share of micro enterprises in the majority of the countries is between 5 % and 18 %. The exceptions to this are Cyprus, with shares of around 45 %; at the other end, Finland, Romania and Czechia showed a low export share of less than 4 % for micro enterprises.
Source: Eurostat (ext_tec01)
Source data for tables and graphs
Data sources
The data used is in this article comes from five different sources:
- Structural Business Statistics (SBS),
- Business demography (BD),
- International trade in goods by enterprise characteristics (TEC).
Data for some countries are missing due to data not being available or confidentiality reasons. Only countries for which data are available are shown in the figures of the article.
Context
Small and medium-sized enterprises (SMEs) are the backbone of Europe’s economy, providing the majority of all new jobs. The European Commission aims to promote entrepreneurship and improve the business environment for SMEs to allow them to realise their full potential in today’s global economy. COSME, the EU programme for the Competitiveness of Small and Medium-sized Enterprises is running from 2014 to 2020, with a planned budget of EUR 2.3 billion.
In recognition of the importance of the issue, the Organisation for economic co-operation and development (OECD) and Eurostat are collaborating in the joint Entrepreneurship Indicators Programme (EIP) and, in this context, have taken steps to improve policy-relevant measurement of entrepreneurial activity.
Direct access to
