Energy statistics - an overview
Data extracted in May 2023
Planned article update: 31 May 2024
Highlights
Gross available energy, EU, 1990-2021
This article provides an overview of the energy economy in the European Union (EU) in 2021, based on annual data from each Member State. It provides trends for the main energy commodities for primary energy production, imports and exports, gross available energy and final energy consumption.
Gross available energy in the European Union in 2021 increased compared with 2020 (+6.0 %). Oil (crude oil and petroleum products) continued to be the most significant energy source for the European economy, despite a long-term downward trend, while natural gas remained the second largest energy source. Both oil and natural gas increased by 5.3 % and 4.0 %, respectively in 2021 compared with 2020. This was mostly due to an increase of activities after the COVID-19 pandemic. The contribution of renewable energy sources continued to increase. Renewables already surpassed solid fossil fuels in 2018 and 2019, and gained further ground in 2020 and 2021. Solid fossil fuels increased by 15.7 % in 2021, partially recovering after the lowest value ever achieved in 2020. However, solid fossil fuels did not increase sufficiently to recover to 2019 levels.
Full article
Primary energy production
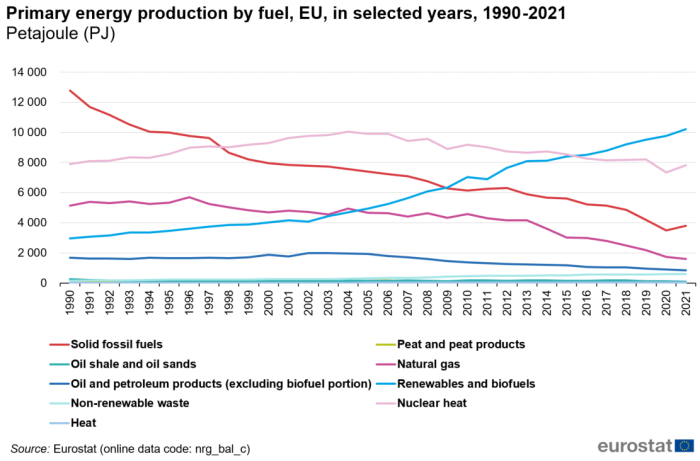
Primary production of energy within the EU in 2021 accounted for 25 020 petajoules (PJ), which is 4.3 % higher than in 2020, but still lower than in 2019. Primary production increased for most of the fuels from 2020 to 2021. However, they decreased from 2019 to 2021 (comparing with pre-COVID-19 pandemic period). The main exception is renewables and biofuels, which continued its long-term increasing trend (Figure 1). Renewable energies accounted for the highest share in primary energy production in the EU in 2021 (40.8 %), followed by nuclear heat (31.2 %), solid fossil fuels (15.2 %), natural gas (6.4 %), oil and petroleum products (3.4 %), and non-renewable waste (2.3 %).
Over the past decade (2011-2021), the trend in primary energy production was generally negative for solid fossil fuels, oil, natural gas, and nuclear energy. The production of natural gas saw the sharpest decline (-63.1 %), followed by solid fossil fuels and oil and petroleum products (with a drop of 39.1 % and 36.0 %, respectively). The production of renewable energies followed a clear positive trend over the same period, with a 48.2 % increase, similarly to waste (non-renewable), which saw a 24.5 % increase.
Imports and exports
The decrease in primary energy production in the EU over the past decades resulted in increased imports of primary and secondary energy products. This increase slowed down in 2020 due to a weaker demand caused by the COVID-19 pandemic and increased again in 2021. The quantity of imported natural gas almost doubled over the period 1990-2021, reaching 13 012 PJ (Figure 2). This makes natural gas the second largest imported energy product. The figure is, however, 6.9 % lower than in 2019, when record import levels of natural gas were registered. Crude oil again ranked first in terms of quantities imported, with 18 915 PJ in 2021, which is 9.6 % lower compared with a decade ago, and 11.9 % lower compared with 2019 (last year before the COVID-19 pandemic).
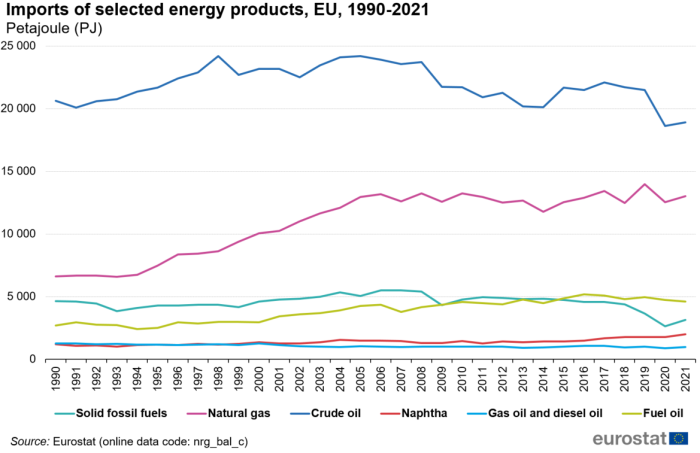
(petajoule)
Source: Eurostat (nrg_bal_c)
Export levels were much lower than import levels (Figure 3). In 2021, gas oil and diesel oil (around 4 063 PJ) ranked highest, followed by motor gasoline (3 059 PJ) and fuel oil (2 378 PJ).
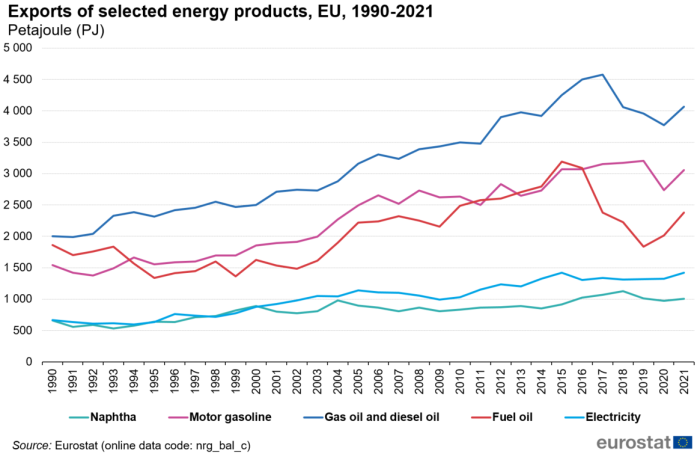
(petajoule)
Source: Eurostat (nrg_bal_c)
It should be noted that data for imports and exports include intra-EU trade.
Gross available energy
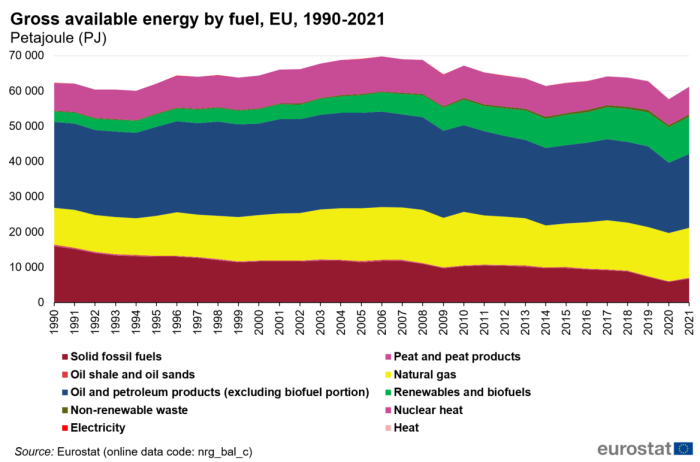
Gross available energy in the EU in 2021 reached 61 229 PJ, which is 6.0 % higher than in 2020 (Figure 4). This can be attributed to a large extent to lifting some of the COVID-19 pandemic-related restrictions. However, this quantity is still 1.8 % lower than in 1990.
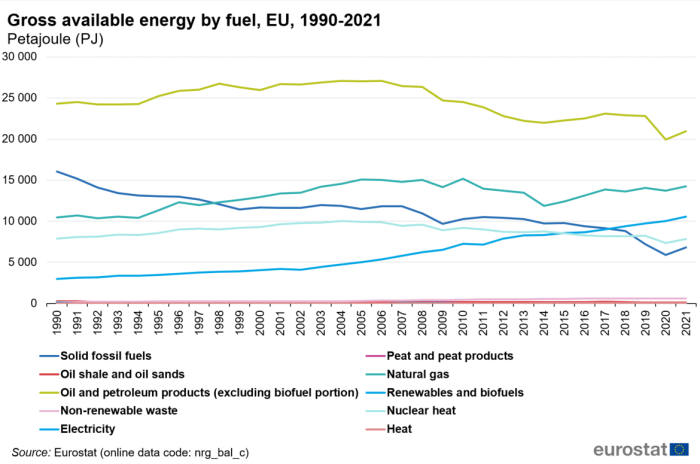
In the aftermath of the 2008 financial and economic crisis, gross available energy decreased by 6.1 % in 2009 compared with the previous year, with the sharpest drop observed in solid fossil fuels (-11.4 %), followed by oil and petroleum products (-6.3 %) and natural gas (-6.0 %) (Figure 5). After a recovery in 2010, with around 4 % rise in gross available energy, consecutive decreases were observed until 2015, when the trend reversed again. However, 2018 and 2019 once again saw a drop in gross available energy, although not nearly as significant as the one registered in 2020. The increase observed in 2021 does not compensate for previous decreases as it still falls below 2019 level.
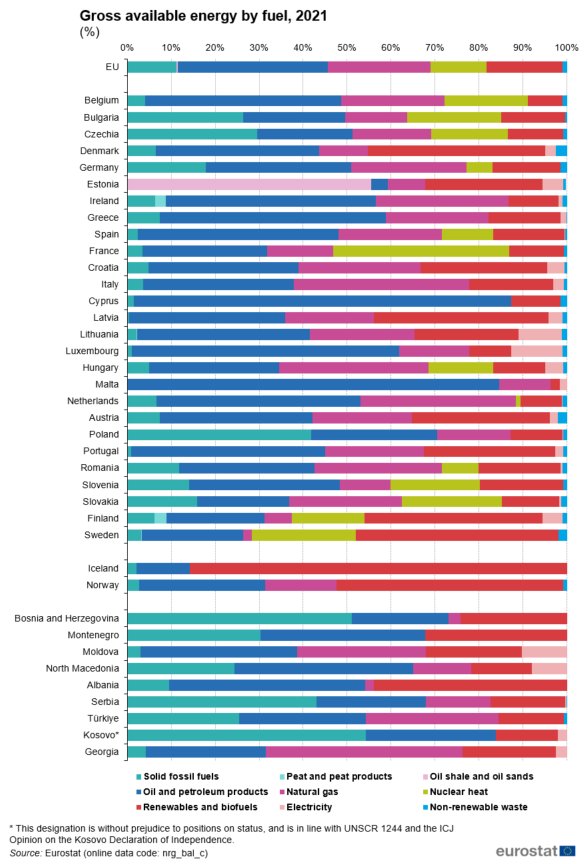
As for the structure of gross available energy in 2021, oil and petroleum products held the largest share (34.5 %), followed by natural gas (23.7 %), whereas solid fossil fuels represented 10.2 %. In other words, 68.4 % of all energy in the EU was produced from coal, crude oil and natural gas. Nuclear heat and renewable energies accounted for 12.7 % and 17.4 % of the total, respectively (Figure 6).
The mix of fuels and their share in gross available energy in different countries depends on the natural resources available, the structure of a country's economy, as well as on the national choices in energy systems. In 2021, only in four EU Member States was the cumulated share of solid fossil fuels, crude oil and petroleum products, and natural gas (i.e. main fossil fuels) in gross available energy below 50 %: Estonia 12.2 %, Sweden 29.4 %, Finland 34.6 % and France 47.5 % (Figure 6). It should be noted that France and Sweden were also the countries with the highest contribution of nuclear heat to the gross available energy (40.7 % and 24.7 %, respectively).
In 2021, the share of solid fossil fuels in gross available energy was highest in Poland (41.8 %) and Czechia (30.2 %). The EU average stood at a much lower figure of 11.1 %. The smallest shares of solid fossil fuels in gross available energy (under 2 %) in 2021 were observed in Portugal, Luxembourg, Latvia, Lithuania, Cyprus, Estonia, and Malta (Figure 6).
In 2021, oil shale and oil sands accounted for 55.5 % of the gross available energy in Estonia, whereas the share of peat and peat products in Finland and Ireland was 2.7 % and 2.4 %, respectively.
The largest shares of oil and petroleum products in gross available energy were observed in Cyprus (85.8 %), Malta (84.6 %), and Luxembourg (60.9 %). This is due to their specific national circumstances: Cyprus and Malta are small islands, while the consumption in Luxembourg is typically heavily affected by "fuel tourism", owing to relatively low prices of fuels used in the transport sector.
The share of natural gas ranged from 40 % in Italy to under 3 % in Sweden and Cyprus. Natural gas was also a significant energy source in the Netherlands, Hungary and Ireland, with a share of 30 % or more.
In Sweden, renewable energies accounted for almost half of their gross available energy in 2021 (48.2 %), while in Finland and Denmark this figure stood at 40.3 % and 40.4 %, respectively). The lowest results in this respect were registered in Malta (2.1 %), Belgium (8.0 %) and the Netherlands(9.5 %).
In 2021, there were 13 Member States with nuclear power plants. France had the highest nuclear share (40.7 % of nuclear heat in gross available energy), followed by Sweden (24.7 %), Slovakia (22.8 %), Bulgaria (22.2 %), and Slovenia (20.4 %).
In Luxembourg and Finland, the gross available energy in 2021 reached over 250 Terajoule (TJ) per capita, while in Romania it was under 75 TJ per capita (Map 1, Figure 7). This indicator is influenced by the structure of the industry in each country, the severity of winter weather, as well as other factors, such as fuel tourism in the case of Luxembourg. The EU average in 2021 stood at 137 TJ per capita.
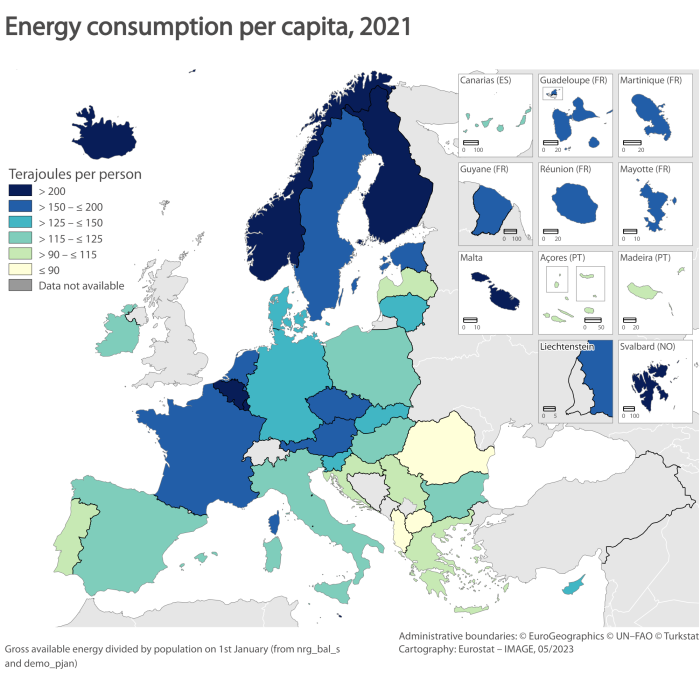
(terajoule per capita)
Source: Eurostat (nrg_bal_s), (demo_pjan)
Between 1990 and 2021, the EU average decreased by 8.2 %. However, at national level, the evolution varies. By far the largest increase in gross available energy per capita between 1990 and 2021 was observed in Malta (+134.3 %), followed by Portugal (+20.7 %), and Austria (+15.3 %). The sharpest decreases were registered in Estonia (-46.9 %), Germany (-37.4 %) and Romania (-34.3 %).
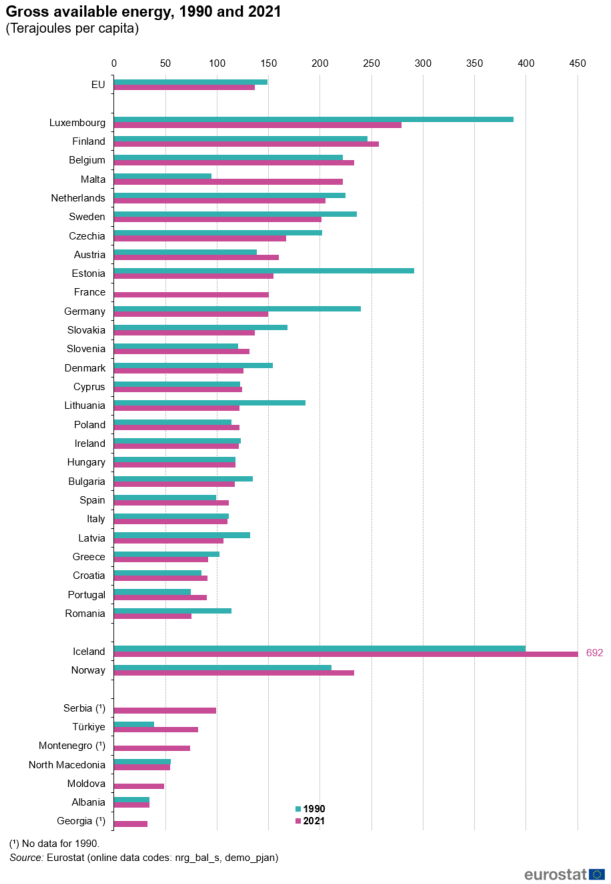
(terajoules per capita)
Source: Eurostat (nrg_bal_s), (demo_pjan)
Note: Detailed information for all years can be found in the source file
Figure 8 shows the structural split of gross available energy in the EU by the main categories of the energy balance. In 2021, the biggest share of energy in the EU was used in energy transformation[1] (24.4 %), followed by transport activities (19.3 %), households (18.4 %), the industry sector (16.9 %), services (9.1 %), non-energy use (6.6 %) and other sectors (5.2 %).
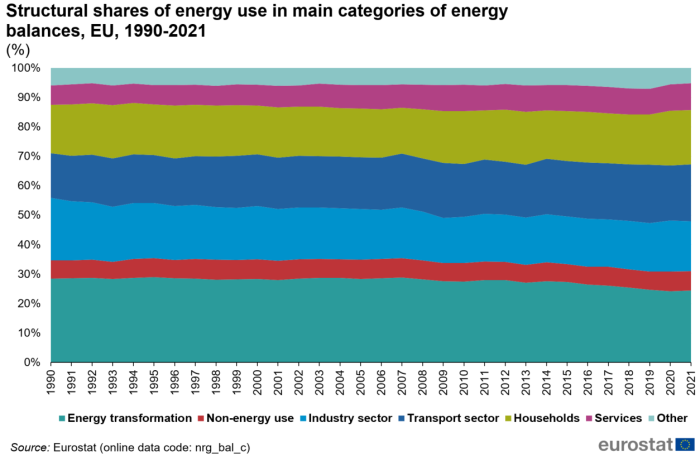
(%)
Source: Eurostat (nrg_bal_c)
Final energy consumption
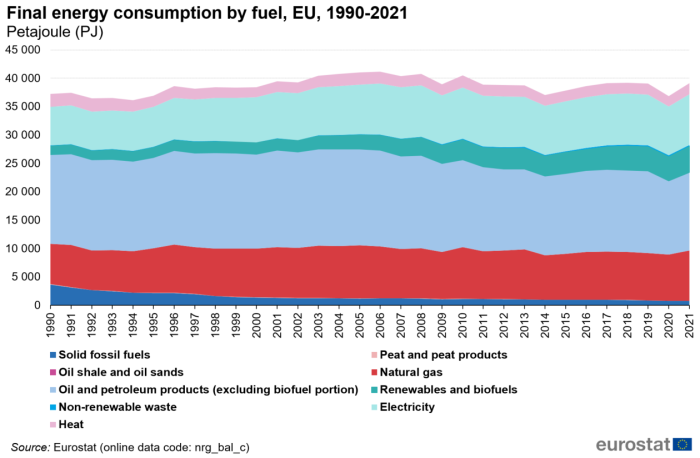
Final energy consumption in the EU in 2021 was 39 351 PJ, 6.2 % more than in 2020 (Figure 9). Final energy consumption was slowly increasing from 1994 until it reached its highest value of 41 447 Mtoe in 2006. By 2021 final energy consumption decreased from its peak level by 5.1 %.
Between 1990 and 2021 the amount and share of solid fossil fuels in final energy consumption dropped significantly (from 9.6 % in 1990 to 3.6 % in 2000, 2.8 % in 2010 and 2.0 % in 2021). On the other hand, renewable energy sources increased their share in the total, moving from 4.3 % in 1990 to 5.3 % in 2000 and 8.8 % in 2010, finally reaching 11.8 % in 2021. Natural gas remained quite stable over this period, ranging from 18.8 % (in 1990) to 22.6 % (in 2005 and 2021).
Oil and petroleum products accounted for the largest share (34.8 %) in the structure of final energy consumption in 2021, followed by electricity (22.8 %).
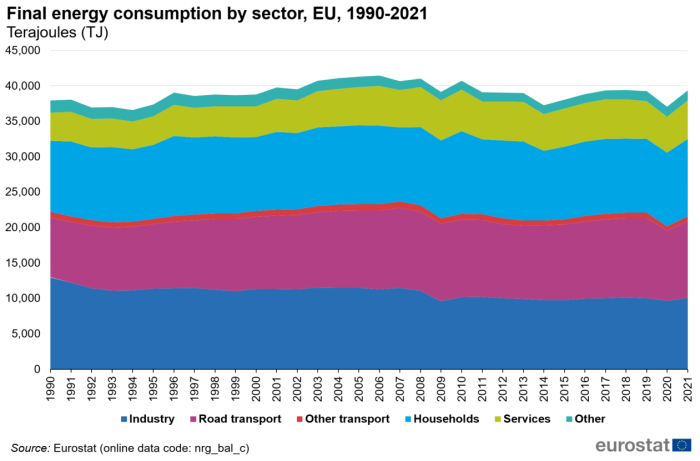
An analysis of the final end use of energy in the EU in 2021 reveals three dominant categories: transport (29.2 %), households (27.9 %), and industry (25.6 %) (Figure 10).
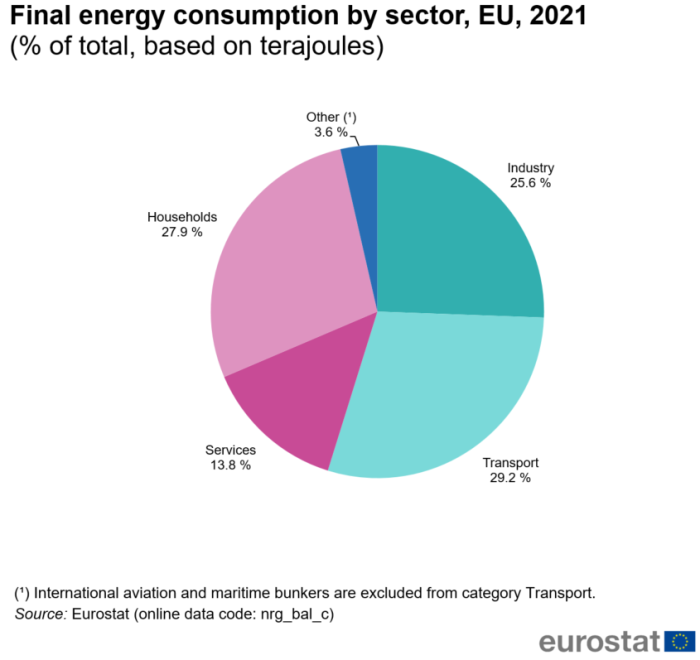
(% of total, based on terajoules)
Source: Eurostat (nrg_bal_s)
The total energy consumption of all transport modes[2] in the EU accounted for 11 506 PJ in 2021. There was a marked change in the development of energy consumption for transport after 2007. Until that year, the consumption was characterised by a steady growth, rising each year from the start of the time series in 1990. However, with the onset of the global financial and economic crisis in 2008, the consumption of energy for transport purposes fell by 1.4 %. The decline continued until 2013. By 2014, this trend had reversed, and the increase in the consumption of energy in for transport activities continued all the way to 2019 (when it was 30.8nbsp;% higher than in 1990), although the 2007 levels were not reached. However, the biggest drop in energy consumption for transport was observed in 2020, -12.9 % compared with 2019, mostly due to the COVID-19 pandemic. In 2021, the trend reversed and a 9.3 % increase was recorded compared with 2020, but still below 2019 level.
A similar analysis for all end uses (based on the period from 2007 onwards) reveals that EU final energy consumption for industry fell overall by 12.4 % during the period between 2007 and 2021. The overall reduction in energy consumption for transport was also very pronounced and stood at 5.8 %. Final energy consumption by services and households increased by 2.4 % and 5.0 %, respectively.
There were considerable differences in the development of energy consumption across various transport modes, with a rapid growth for international aviation (90.9 %) between 1990 and 2008 (Figure 12). However, 2009 was marked by a considerable reduction in energy consumption for this particular transport mode (-8.4 % compared with 2008), followed by a short period without a clear development pattern in terms of energy consumption in international aviation. In the period between 2013 and 2019 there was a steady growth in consumption, causing the 2019 levels to be 20.1 % higher than the previous relative peak in 2008. International aviation was, of course, the transport mode most severely impacted by the COVID-19 pandemic and related restrictions. Compared with 2019, the energy consumed by international aviation almost halved (-48.6 %) in 2021.
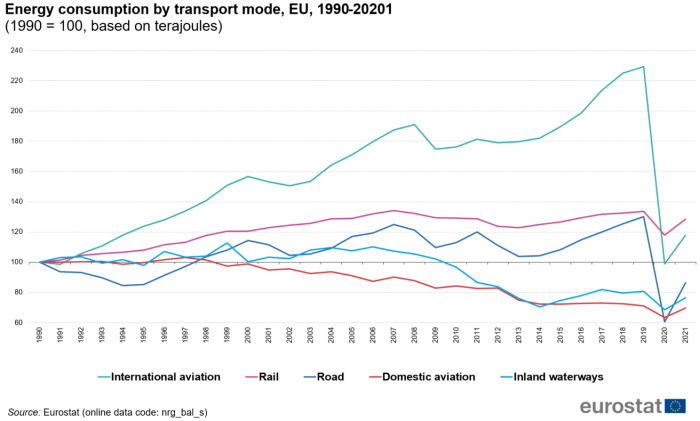
(1990 = 100, based on terajoules)
Source: Eurostat (nrg_bal_s)
As shown in Figure 12, which compares the principal modes of transport in the period between 1990 and 2021, international aviation had the biggest growth until 2019, before dropping very prominently to slightly below 1990 levels in 2020, and then recovering in 2021 to a similar level as in 1994. After a decline in 2020, road transport reported an increase in 2021 to a level 28 % higher than in 1990. Domestic aviation also reported an increase in energy consumption over the period 1990-2019 (33.9 %), with a sharp decline in 2020 (-11.8 % decrease compared with 2019) and a small recovery in 2021 to reach a similar level than in 1995. Energy consumption for rail transport continued its fall and in 2021 was around 30 % lower than in 1990, whereas the figure was 23.5 % lower for transport via inland waterways.
In absolute terms, over the period between 1990 and 2021 energy consumption for transport via inland waterways dropped by 51 PJ, whereas rail transport consumed 94 PJ less in 2021 than in 1990. Domestic aviation consumed 28 PJ less than in 1990, while the consumption of energy for international aviation increased by 137 PJ. By contrast, energy consumption in road transport saw an increase of 2 400 PJ. These changes reflect the use of each transport mode, which was significantly restricted in 2020, but can also be influenced by technological developments, especially when these relate to fuel-efficiency gains or losses.
Non-energy consumption
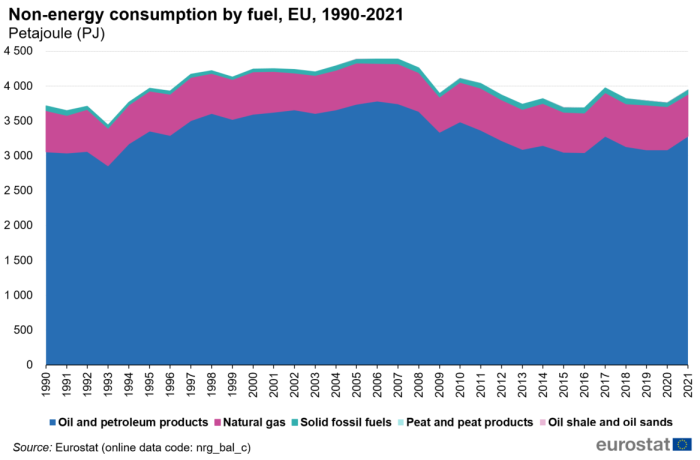
Final non-energy consumption includes fuels that are used as raw materials and are not consumed as fuel or transformed into another fuel (for example, natural gas used in fertilizers, or bitumen used in road construction). Non-energy consumption in 2021 was 3 951 PJ (Figure 13). Oil and petroleum products accounted for 81.9 %, natural gas 16.4 %, and solid fossil fuels 1.6 % of all non-energy consumption.
Energy dependency
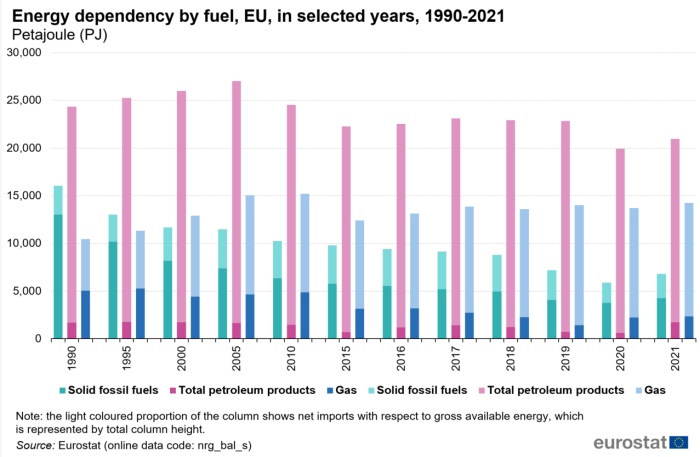
Gross available energy represents the quantity of energy necessary to satisfy the energy needs of a country or a region. The ratio between net imports and gross available energy indicates the ability of a country or a region to meet all its energy needs. This ratio is called energy dependency. In other words, it shows the extent to which a country or a region is dependent on energy imports. This is illustrated in Figure 14, where the light-coloured proportion of the column shows net imports with respect to gross available energy.
In 2021 the EU's energy demand was highest for oil and petroleum products reaching 20 965 PJ, of which 91.7 % was imported. For natural gas the demand in 2021 stood at 14 247 PJ, with 83.4 % of it covered by imports. The production of solid fossil fuels in the EU has been in decline over the last two decades (Figure 1), as was their gross available energy. At EU level in 2021, 37.5 % of solid fossil fuels consumed were imported. Overall, the long-term trend since 1990 points to an increasing import dependency. Whereas in 1990 50 % of all fuels consumed were imported, the figure stood at 55.5 % in 2021.
Energy intensity
Energy intensity can be considered as an approximation of the energy efficiency of a country's economy, and shows the amount of energy needed to produce a unit of GDP. There are various reasons for observed improvements in energy intensity: a general shift from industry towards a service-based economy in Europe, a shift within industry to less energy-intensive activities and production methods, the closure of inefficient units, and more energy-efficient appliances. Map 2 illustrates energy intensity using GDP purchasing power standards (PPS), which are more suited for comparison across countries in a specific year.
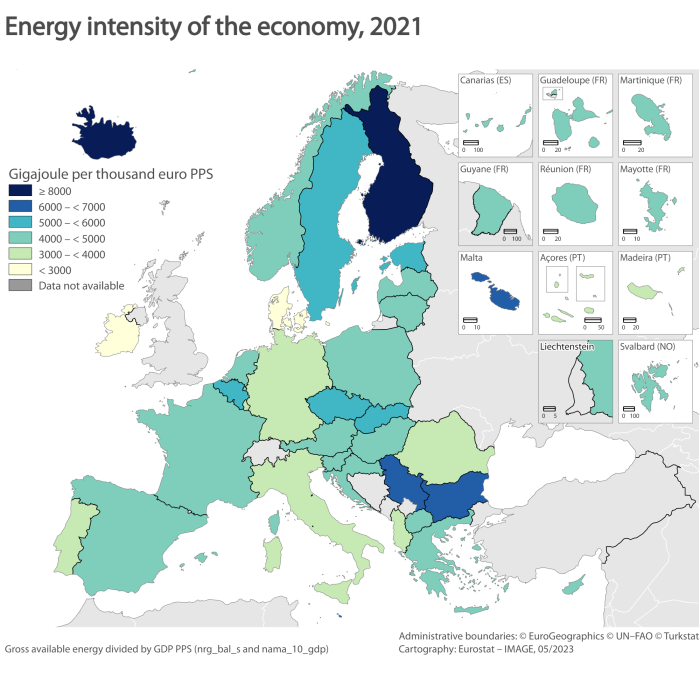
(gigajoule per thousand euro PPS)
Source: Eurostat (nrg_bal_s), (nama_10_gdp)
Figure 15 shows energy intensity using chain-linked GDP values, which are better suited for comparison of historic trends in each country. Compared with a decade ago, all EU Member States achieved improvements in terms of energy intensity.
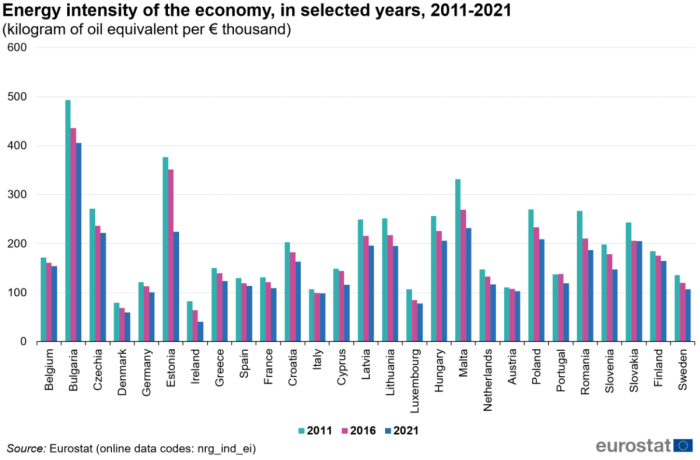
(kilogram of oil equivalent per € thousand)
Source: Eurostat (nrg_ind_ei)
Source data for tables and graphs
Data sources & methodology
Data on energy are submitted on the basis of internationally agreed methodology in joint annual energy questionnaires (Eurostat - OECD/International Energy Agency (IEA) - UNECE). Data are available for all EU Member States and the methodology is harmonised for all reporting countries. Consequently, data comparability across countries is very high. All energy data are available in the online database. Energy balances are constructed based on Eurostat's methodology that is described in the Energy balance guide.
Context
Everyday life depends on reliable and affordable energy services, such as heating and cooling, electricity supply, and transport. Energy enables the smooth functioning of all economic sectors, from business and industry to agriculture. The EU still relies heavily on fossil fuels for its energy and faces a number of challenges to securing affordable, reliable and sustainable energy supplies. Increasing energy efficiency, improving energy productivity and reducing total consumption, while at the same time ensuring security of supply, competitiveness and access to affordable energy for all its citizens, are some of the ways the EU can improve its energy system. Energy statistics provides crucial information for policy makers on many of these issues.
The energy union strategy aims at building an energy union that gives EU consumers - households and businesses - secure, sustainable, competitive and affordable energy. The European Green Deal provides an action plan to boost the efficient use of resources by moving to a clean, circular economy, as well as to restore biodiversity and cut pollution. The plan outlines investments needed and financing tools available. It explains how to ensure a just and inclusive transition. The EU aims to be climate-neutral by 2050. The Commission has proposed a European Climate Law to turn this political commitment into a legal obligation. The Fit for 55 legislative proposals cover a wide range of policy areas including climate, energy, transport and taxation, setting out the ways in which the Commission will reach its updated 2030 target in real terms.
Energy statistics renders the complex processes of the energy we use more comprehensible and can help us understand the developments of energy consumption. It includes a broad spectrum of energy data such as annual data on crude oil, oil products, natural gas, electricity, derived heat, solid fossil fuels, renewables and wastes, covering the full spectrum of the energy balance positions from supply through transformation to final energy consumption by sector and fuel type. These are the data used in this article.
Direct access to
See also
- Energy statistics - main indicators (t_nrg_indic)
- Energy statistics - quantities, annual data (nrg_quanta)
- Energy balances (nrg_bal)
- Supply, transformation and consumption - commodity balances (nrg_cb)
- Energy indicator (nrg_ind)
- Energy infrastructure and capacities (nrg_inf)
- Stocks (nrg_stk)
- Trade by partner country (nrg_t)
Dedicated section
- Energy, transport and environment statistics - 2020 edition
- Energy data - 2020 edition
- Sustainable development in the European Union — Monitoring report on progress towards the SDGs in an EU context — 2020 edition
- Shedding light on energy in the EU — A guided tour of energy statistics — 2020 edition
- Energy balances (ESMS metadata file — nrg_bal_esms)
- Energy statistics - quantities (European and national ESMS metadata file — nrg_quant_esms)
- Supply, transformation and consumption — commodity balances (ESMS metadata file — nrg_cb_esms)
Visualisations
- Explore annual energy data - This interactive tool helps you to obtain an overview of key energy trends.
- Sankey diagram - Energy flows
- A European Green Deal
- European Commission — Directorate-General for Energy — Energy strategy
- European Commission — Directorate-General for Mobility and Transport — European strategies
- Energy Community
- Euro Mediterranean Statistical Cooperation
- EU4Energy Programme
- INOGATE
- International Energy Agency (IEA) — Data and statistics
- OECD — Green growth and sustainable development — Greening energy
Notes
- ↑ Energy transformation includes energy lost during conversion of primary energy products into secondary energy products that are actually consumed by end users; for example crude oil refining into motor gasoline or production of electricity from coal.
- ↑ In energy balances, international aviation and maritime bunkers are excluded from final energy consumption.
