Archive:Employment rates – annual statistics
Data from April 2018.
Planned update of the article: April 2019'
</updatedata>
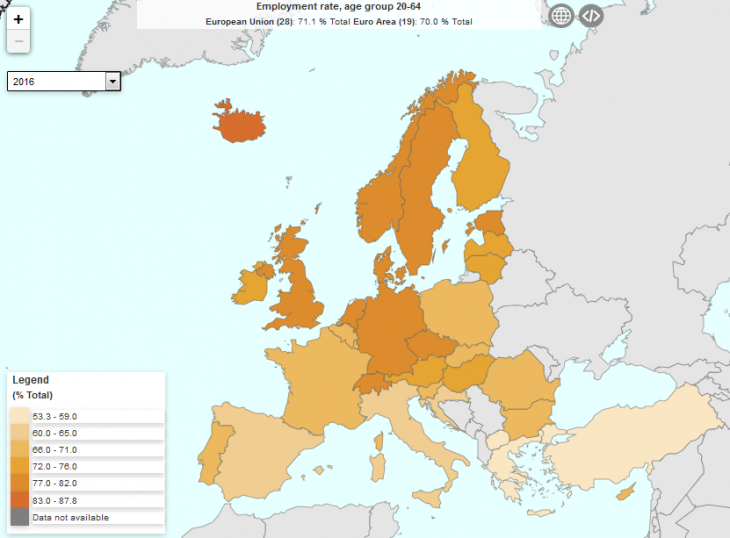 Map 1: Employment rates
Click on the map for an interactive view of the data.
The EU Member States have set national targets for the employment rate in 2020, as part of the EU 2020 strategy. This article shows how they are progressing towards this goal, and offers some insight into these developments.
The employment rate gives information on the share of the adult population who have a paid job (or, more technically, is an employed person). The pay can be in cash or in kind, and the job can be as an employee, as a self-employed person, or as a family worker. As a paid job in most cases is the main source for determining the living standard of people, the employment rate gives an indication of the socio-economic conditions of individuals in a country. It also describes to what extent the human resources of a country are utilised for economic purposes, and thereby also provides key macroeconomic information.
</highlight>
Full article
Steady increase and new record of high employment rate
In 2017, the employment rate of persons aged 20-64 in the EU-28 was 72.2 %. This was the highest rate recorded since the start of the data series in 2001.
The rate increased by 1.1 percentage points between 2016 and 2017, the fastest growth ever recorded (measured in year-on-year percentage point movement). There have now been four consecutive years of growth, averaging 0.95 percentage points per year. By contrast, the average annual growth over the period 2001 – 2013 was 0.13 percentage points per year.

Nine EU Member States, two more than in 2016, had reached their EU 2020 employment rate goal in 2017.
The target at EU level is an employment rate of 75% in 2020. In order to reach this target (marked with the 75 % line in Figure 1), the growth will have to continue at at least 0.9 percentage points per year until 2020.
The differences in rate development are more visible in Figure 2, where effectively focus is on the percentage point changes, with no regard to the level of the rate. The decreases (graph line below zero) of 2002, 2009-2010, and 2012, and the peak periods of 2005-2008 and 2014-2017 are the main features. In order to reach the EU2020 target, the employment rate growth will have to continue for the coming three years, but it can do so at a slightly lower speed than in 2017 and still reach the 2020 goal. If this happens, it will become the longest and largest growth period since the start of the dataset in 2001.

However, as shown on Map 1, there are notable differences in employment rates between the EU Member States. In 2017, there was a difference of 24 percentage points from the lowest to the highest. At the bottom end lies Greece (57.8 %), the only Member State with a rate below 60 %, and at the top end is Sweden (81.8 %), the only Member State above 80 %.
Map 1: Employment rates
Click on the map for an interactive view of the data.
In-between these two extremes there are two major groups of EU Member States, one in the range of 60 % - 69.9 %, and one for the 70 % - 79.9 % range.
The group with rates in the 60s contains five countries: Italy, Croatia, Spain, Belgium, and Romania. In the 70s group there are 21 EU Member States, among which are Germany, France and the United Kingdom. Additionally, it includes a large majority of the Central and Northern countries, but also Portugal.
The countries outside the EU showed an even higher spread, from 54.8 % in the former Yugoslav Republic of Macedonia, to 87.6 % in Iceland.
Nine EU Member States have reached their EU2020 goal
As already seen, one of the targets of the Europe 2020 strategy is to have an employment rate of at least 75 % for persons aged 20-64 in the EU by 2020. This objective has been translated into national targets in order to reflect the situation and the possibilities of each EU Member State to contribute to the common goal. The national targets vary considerably across countries, stretching from 62.9 % in Croatia to 80.0 % in Denmark, the Netherlands and Sweden.
Nine EU Member States had reached or exceeded their national target in 2017 (Germany, Estonia, Lithuania, Sweden, the Czech Republic, Ireland, Croatia, Latvia, and Malta). Two of them reached their target in 2017, three in 2016, another three in 2015, and one reached it in 2013. It is worth noting that Sweden, while being one of the Member States with the highest national targets, achieved its goal six years ahead of schedule, and continues to maintain it in 2017.
The countries that in 2017 have achieved their national employment rate targets can be found at the top of Figure 3 . There are, however, quite different paths for how they got there. Germany, the Czech Republic, and Malta are the only three among these nine countries which have had a steady upward movement over the last 14 years. For Sweden, Lithuania, Estonia, Ireland, Latvia, and Croatia there have been ups and downs over this time period.
Germany is the only country which reached its goal in 2013 and has kept it since then.

There are 16 countries that are less than 5 percentage points below their national employment rate target in 2017. They also come in several categories: Denmark has been stable over the whole period. Poland has grown considerably and steadily, from being more than 10 percentage points from their target in 2003 to being less than 5 percentage points from it now. Slovenia and Portugal have had ups and downs.
Further down in Figure 3 is the only country which is 5-10 percentage points below its target (Spain) and which has experienced notable fluctuations over the last 15 years.
Finally, at the bottom of the figure lies Greece, which is more than 10 percentage points below its target, and has been so since 2011.
Employment rate gender gap shrinking but still above 10 percentage points
Figure 4 shows the gender employment gap, as well as the employment rate level of men and women in each country in 2008 (in orange) and 2017 (in blue). The countries are ranked on the size of gender gap in 2017, with Lithuania on the top with the smallest gap, and Malta at the bottom with the largest gap among the EU Member States. The left hand side of the bars show the employment rate of women, while the right hand side of the bars refers to the employment rate of men. The difference between the employment rate of men and women (i.e. the gender gap) is consequently represented by the length of the bar. This means the longer the bar, the larger the gender gap.

At EU-28 level the gap was 15.1 percentage points in 2008, and it has diminished to 11.5 in 2017. The decrease is a result of increasing employment among women. Among men the rate has practically been standing still the last ten years (the right hand side of the orange and the blue bar are practically the same, whereas the left hand side of the bars do not line up).
Germany, Estonia, Lithuania, and Sweden are the only Member States where the blue bars are entirely above the 75 % line, meaning that they fulfilled the average EU-28 employment rate target both for men and for women in 2017. In contrast, Belgium, Greece, Spain, Croatia, and Italy have blue bars fully below the 75% line, meaning that neither men nor women achieved the average EU employment rate target in 2017.
Twenty-six EU Member States have a decrease in the gender employment gap over the period 2008 – 2017, with only Hungary and Romania having an increase.
Four Member States (Denmark, Greece, Cyprus, and Finland) have falling employment rates both for men and for women over this time period, while eleven Member States (the Czech Republic, Germany, Estonia, Lithuania, Hungary, Malta, Poland, Romania, Slovakia, Sweden, and the United Kingdom) have increasing rates both for men and for women. The other thirteen Member States show increased employment rates for women and decreased employment rates for men.
The decreasing gaps can, therefore, be attributed to two main factors, almost equally distributed among the countries: about half of the countries have a rising employment rate of both women and men, but with faster increases among women; and the other half have decreasing employment rates among men while at the same time increasing rates among women.
Fewer young and more elderly persons in employment
In addition to increasing the employment rate of women, a clear policy target in the European Union is also to increase the employment rate of older persons, i.e. make people work longer. Under the hypothesis that the employment rate of younger people is stable, this should increase the total employment rate.
In Figure 5, light orange represents the decrease in employment rate between 2003 and 2017, darker orange shows the level in 2017, and the full bar shows the level in 2003. This means that an age group with an orange bar has had a decrease in employment rate over this period. For the bars that are blue, dark blue represents the increase in the employment rate in the same period. Consequently the lighter blue bars show the level in 2003, and the total length of the blue bars represents the level in 2017. Age groups with blue bars, therefore, have had an increase in their employment rate. The numbers on the bar show the development (in employment rate percentage points) between 2003 and 2017 for each of the age groups.

This clearly shows that the increase in the employment rate is proportional with age: among persons aged 60-64 it has increased by 17.6 percentage points between 2003 and 2017, whereas it has decreased by 0.6 percentage points among persons aged 20-24. The age groups from 30 up to 54 are above the 75% EU2020 target. The highest employment rate in 2017 is recorded in the 45-49 age group, whereas in 2003 the 35-39 age group was highest.
Large increase of highly educated, large decrease of persons with low education

Figure 6 shows that persons with a medium level education (defined as upper secondary and post-secondary non-tertiary education, ISCED levels 3 and 4) constitute the largest proportion of those in employment both in 2003 and in 2017.
In contrast, the fastest decreasing group is men with low education (a drop of 8.1 million persons in employment over the time period 2003 to 2017), and the fastest increasing group is women with high education (an increase of 16.8 million). In 2017, women with high education outnumber men with high education, a clear shift from what the situation was in 2003.
In 2003, one quarter of the persons in employment had a low education, another quarter had a high education, and half had a medium education. In 2017, this had shifted so that one sixth had low education, one third had high education, and the medium level education stood still at one half.
Figure 7 shows the evolution of the number of employed persons in the EU from 2002-2017. The orange colour means a decrease in the number of persons, and the blue colour means an increase in the number of persons. The stronger the colour, the stronger the change over time. Combining the variables age, sex, and education over the time period 2002-2017 shows a very clear pattern: the upper left hand side (young and low education) shows a decrease, and the lower right hand side (older and high education) shows an increase. It also shows that men outnumber women among those with low level education for all age groups for the whole time period, and that women outnumber men among those with high level education for the young and middle age groups in the most recent years.
In conclusion, we see a marked shift in the European labour market over the last fifteen years, with many more highly educated persons, a notable rise in the number of women, fewer young and many more older persons.

<datadetails>
Data sources
Source: The European Union Labour Force Survey (EU-LFS) is a large sample, quarterly survey providing results for the population in private households in the EU, EFTA and the candidate countries. Conscripts in military or community service are not included in the results.
Reference period: Yearly results are obtained as averages of the four quarters in the year.
Coverage:
France - since the first quarter of 2014 the overseas departments of Guadeloupe, Martinique, Guyane, and La Réunion are covered, in addition to the metropolitan territory. Overseas departments are included in the results of the detailed series, but not in the results of the main indicator.
Cyprus - the survey covers only the areas of Cyprus controlled by the Government of the Republic of Cyprus.
European aggregates: EU refers to the sum of EU-28 Member States and EA to the sum of the 19 euro area Member States. If data are unavailable for a country, the calculation of the corresponding aggregates takes into account the data for the same country for the most recent period available. Such cases are indicated.
Definitions: The concepts and definitions used in the survey follow the guidelines of the International Labour Organisation. Employment covers persons aged 15 years and over (16 and over in Spain, Italy and the United Kingdom, 15-74 years in Estonia, Latvia, Hungary, Finland, Sweden, Norway and Denmark, and 16-74 years in Iceland), living in private households, who during the reference week performed work, even for just one hour, for pay, profit or family gain, or were not at work but had a job or business from which they were temporarily absent, for example because of illness, holidays, industrial dispute or education and training. The LFS employment concept differs from national accounts domestic employment, as the latter sets no limit on age or type of household, and also includes the non-resident population contributing to GDP and conscripts in military or community service. Definitions of indicators reported in this publication are available on the EU-LFS Statistics Explained webpage: EU Labour Force Survey (Statistics Explained)
<datadetails>
Source data for tables and graphs
Context
Please note that Eurostat provides two sets of indicators linked to the annual employment rate, which serve different purposes and which in some cases differ from each other:
1) The main indicators, which are seasonally adjusted. They include the headline indicators under the EU2020 Strategy and are consequently used for monitoring the EU2020 targets (at EU and national levels). They have only a few breakdowns and normally refer to the age group 20-64. Please also note that for France the main indicators exclude overseas departments.
2) The detailed results, which are not seasonally adjusted. They have a large number of breakdowns and can therefore be used for more detailed analysis. These include the French overseas departments.
This article presents annual results for some indicators from the two sets described here above.
The article on Labour market and Labour force survey (LFS) statistics presents a series of other annual results of the LFS. For deeper insight into the labour market, this article should also be read together with Unemployment statistics and Underemployment and potential additional labour force statistics. The main source for the employment rate calculation is the labour force survey (LFS). The results from the survey currently cover all European Union Member States, the EFTA Member States of Iceland, Norway, Switzerland, as well as the candidate countries Turkey and the former Yugoslav Republic of Macedonia. The survey is based on the same target populations and uses the same definitions in all countries, which means that the results are comparable between the countries. Five different articles on detailed technical and methodological information is linked from the overview page EU labour force survey.
The EU-LFS is the largest European household sample survey providing quarterly and annual results on labour participation of people aged 15 and over as well as on persons outside the labour force. It covers residents in private households. The EU-LFS is an important source of information about the situation and trends in the national and EU labour markets.
Each quarter around 1.8 million interviews are conducted throughout the participating countries to obtain statistical information for some 100 variables. Due to the diversity of information and the large sample size the EU-LFS is also an important source for other European statistics like Education statistics or Regional statistics.
Direct access to