Electricity and heat statistics
Data extracted in June and July 2022.
Planned article update: July 2024.
Highlights
In 2021, the gross electricity production in the EU showed an increase of 4.4 % compared with 2020, at 2 907 TWh, slightly more than the pre-COVID year 2019.
Gross electricity production by fuel, EU, 2000-2022
This article provides an overview of the production and consumption of electricity and derived heat in the European Union (EU). The figures are based on the annual data provided by the Member States. When available, preliminary 2022 annual data are used to show the most recent trends. Eurostat's energy statistics contain data as of 1990 for all Member States and 13 non-EU countries. This article focuses primarily on data for the EU and the comparison between 2020 and 2021, including 2022 if available. The article also presents a simplified electricity and derived heat balance, as well as trade data and some derived indicators of consumption linking to population and GDP.
Full article
General overview
Gross electricity production in the EU increased from 2 657 TWh in 2000 to its peak of 2 994 TWh in 2008. In 2021, the gross electricity production increased by 4.4 % compared with 2020 and reached 2 907 TWh, slightly more than the pre-COVID year 2019. Compared with the 2008 peak value, this is a drop of 2.9 %.
In 2021, renewable energy sources were the largest contributors to electricity production, surpassing natural gas and manufactured gases, solid fossil fuels (coal) and nuclear energy. This was the second time that more electricity was generated from renewables (1 102 TWh) than from all fossil fuels together (1 073 TWh). In the period from 2000 until 2021, electricity generation from renewable energy sources more than doubled (from 436 to 1 102 TWh). Compared with 2015, electricity production from renewable sources increased by 24.7 %.
Production of electricity
The total gross electricity production in 2021 in the EU registered a 4.4 % increase compared with 2020, amounting to 2 907 TWh. Contrary to this, we had seen a decreasing trend in the three years before (see Table 1, Figure 1).
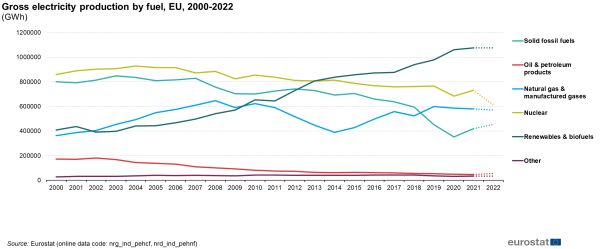
(GWh)
Source: Eurostat (nrg_ind_pehcf), (nrg_ind_pehnf)
The highest share of electricity in 2021 was produced in power plants using renewable energy sources (37.9 %), followed by nuclear power plants (25.2 %), gas fired plants[1] (19.9 %) and coal fired power plants (14.4 %). Lower shares were noticed for oil[2] (1.6 %) and non-renewable wastes (0.7 %). The detailed data on gross electricity production by fuel are shown in Table 1.
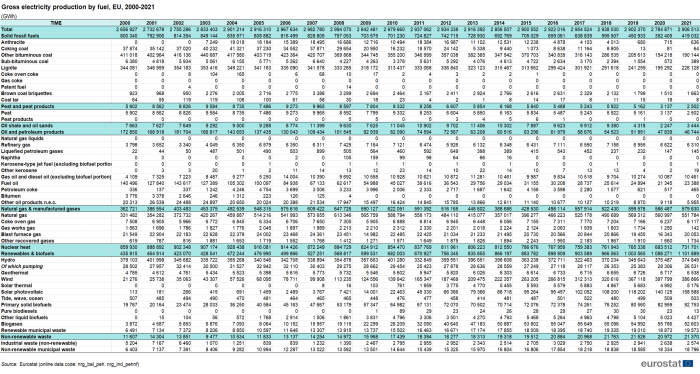
(GWh)
Source: Eurostat (nrg_bal_peh), (nrg_ind_pehnf)
There have been significant changes in the contribution of the different renewable energy sources to electricity production over the last two decades. In 2000, 87.0 % of renewable electricity was produced from hydro energy, a share which dropped to 34 % in 2021. Electricity from wind, on the other hand, increased significantly in the same period, from 4.9 % of all renewables in 2000, to 35.1 % in 2021. Other renewable energy sources with large shares in electricity production in 2021 were solar photovoltaic (14.4 % of all renewables), primary solid biofuels (8.4 %) and biogases (4.8 %).
The time series for gross electricity production by fuel is presented in Figure 1[3]. Since 2000 electricity generation from renewable energy sources has more than doubled and it is the only source which continued to grow after 2008 (with only a small decrease in 2011). The electricity production of coal fired power plants started to grow again in 2021. In 2020, the lowest level since 2000 was registered . Preliminary data for 2022, however, show that it increased in 2022 again by 8% to reach 453 TWh. Electricity generated from natural gas increased from 331 TWh in 2000 to its peak of 614 TWh in 2008. However, by 2014 the electricity generation from natural gas decreased to 357 TWh. In 2021, 552 TWh were generated using natural gas. In the course of 2022 the electricity production from natural gas decreased slightly and reached 545 TWh. Electricity production from nuclear power plants increased to 732 TWh in 2021 (+7 % compared with 2020). Preliminary data for 2022 show a clear decrease to reach 609 TWh.
Installed electrical capacity
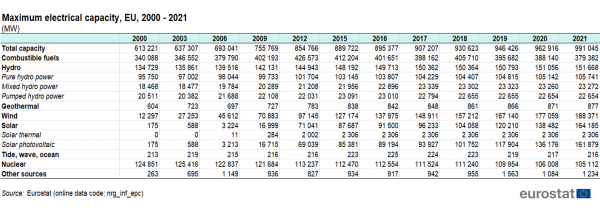
The installed electrical capacity in the EU is presented in Table 2. It increased by 61.6 % in the period from 2000 to 2021. Its structure changed significantly over this period. In 2000, the highest share of installed capacity was accounted for combustible fuels (55.5 %), followed by hydro (22.0 %), nuclear (20.4 %) and wind (2.0 %), with all others together less than 1.0 %. In 2021, the share of installed capacity of combustible fuels decreased to 38.3 %, the share of hydro to 15.3 % and the share of nuclear to 10.6 %. On the other hand, the share of wind increased to 19.0 % and the share of solar photovoltaic to 16.3 %, while geothermal and tide, wave and ocean remained negligible.
Import and export of electricity
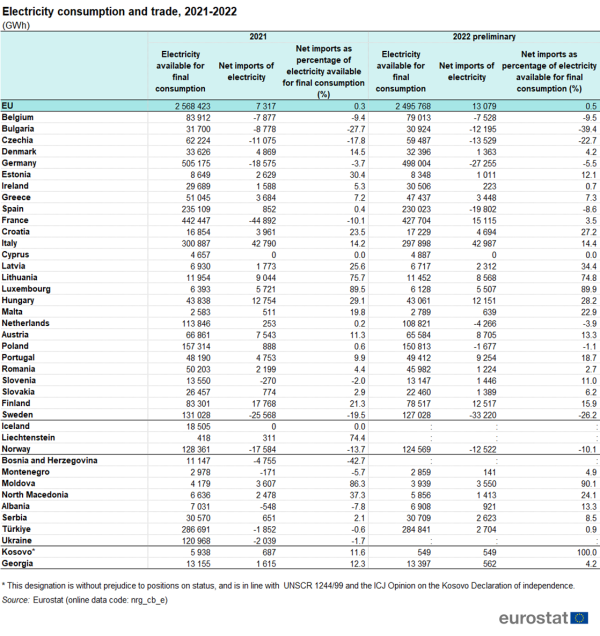
At an overall EU level, net imports of electricity in 2021 represented only 0.3 % of the electricity available for final consumption, whereas in 2022, according to preliminary data, this figure grew and stood at 0.5 %. However, there were significant differences between various EU Member States. Having a close look at the relative shares of electricity available for final consumption, the net imports of electricity in 2022 in Luxembourg represented as much as 89.9 %, whereas in Lithuania they amounted to 74.8 %, in Latvia 34.4 %, in Hungary 28.2 %, and in Croatia 27.2 %. On the other side of the scale, the percentages of net exports of electricity in Bulgaria were 39.4 %, Sweden 26.2 %, Czechia 22.7 %, Belgium 9.5 %, Spain 8.6 % and Germany 5.5 %.
In 2022, according to preliminary data, the biggest net importers of electricity in absolute values were Italy, France, Finland and Hungary, while Sweden, Germany and Spain were the biggest net exporters of electricity (Table 3).
It is worth mentioning that France, one of the biggest net exporters of electricity in the past in absolute values, became a net importer in 2022.
Derived heat production
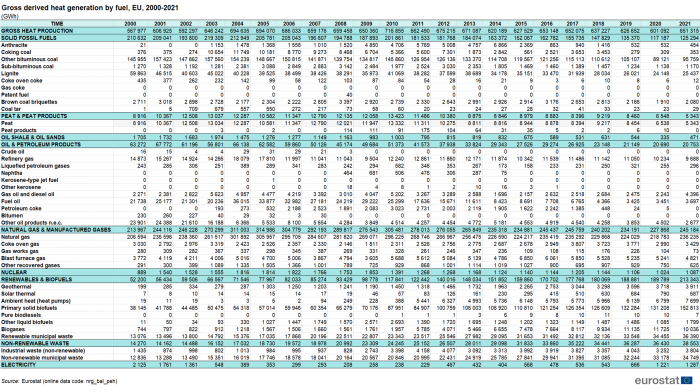
EU total gross production of derived heat in 2021 amounted to 651 TWh, or 8.4 % more than in 2020. The highest share of heat was produced from natural gas and manufactured gases (37.6 %), followed by renewable energies (32.8 %) and solid fossil fuels (19.2 %). The detailed data on gross heat production by fuel are shown in Table 4 and Figure 2. Figure 2 also includes preliminary data for 2022[4].
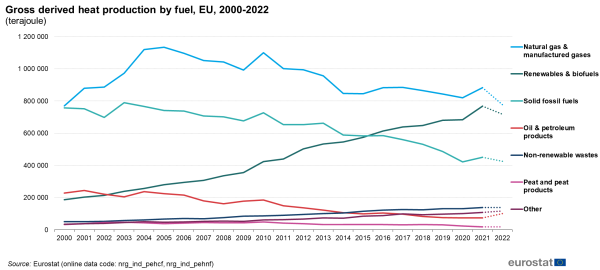
(GWh)
Source: Eurostat (nrg_ind_pehcf), (nrg_ind_pehnf)
Production of derived heat from solid fossil fuels continued its long term decreasing trend into 2021: since 2000 it decreased by 40.5 % to 125 TWh (451 PJ) in 2021 and dropped by 5.6 % to 118 TWh (426 PJ) in 2022. The record low was seen in 2020 with 117 TWh (422 PJ). Oil and petroleum products showed a similar trend for heat production: in the period from 2000 until 2021 we observe a decrease of 67.2 % with a record low of 21 TWh (74 PJ) in 2020. As the consumption in 2021 remained almost stable with 2020, in 2022 there was an increase of 35.2 % compared to 2021. Natural gas, which peaked in 2005, increased by 14.3 % in 2021 compared to 2000. Natural gas and manufactured gases together decreased by 11.9 % in 2022 compared with the previous year. Renewable energy continued its long-term increasing trend into 2021, but in 2022 we could see a slight drop of 6.5 % compared with 2021. From 2000 to 2021 heat produced from renewable sources increased by as much as 408.7 %.
Consumption of electricity and derived heat
Electricity grids and distribution systems of derived heat always have to be in balance: all produced electricity and derived heat need to be consumed in one way or another. While there are transmission and distribution losses, the overall consumption pattern follows the production pattern very closely.
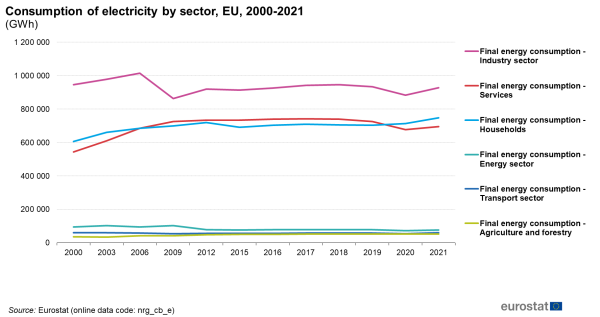
In the EU the consumption of electricity increased significantly during the 90’s but stabilised over the last 10 years. The households and services sectors are responsible for the growth of electricity consumption, while consumption in the transport sector remained stable over the years. Consumption of electricity in the industrial sector follows the economic cycle.
In 2021, however, there was an increase in electricity consumption in many sectors compared with the previous year. The amount of electricity consumed for transport went up by 11.6 %, the industry sector saw an increase of 5 %, the residential sector an increase of 4.9 %, whereas the energy sector's electricity consumption increased by 3.6 % and the services sector consumed 2.8 % more. By contrast, the electricity consumption in agriculture and forestry decreased by 0.3 %. Nevertheless, as shown in Figure 3, electricity consumption in the services sector increased by as much as 27.9 % in the period from 2000 to 2021, while electricity consumption in the households sector increased by 23.4 % during the same period. For the second time since 2006, the electricity consumption of households was higher than that of services (by 7.3 %).
In 2021, electricity consumption amounted to 928 TWh in the industry sector, 747 TWh in the residential sector, 696 TWh in the services sector and 61 TWh in the transport sector.
The detailed data on electricity and derived heat production and consumption for 2021 are also presented in the simplified electricity and heat balance in Table 5.
Simplified electricity and derived heat balance
The simplified electricity and derived heat balance is derived from the complete energy balance and presents the most relevant flows for electricity and derived heat - their production and consumption in 2021 (Table 5). All data in the simplified electricity and heat balance for the EU are presented in a common energy unit (ktoe - thousand tonnes of oil equivalent). The simplified balance presents in the first part the fuels input to electricity and heat production, in the second part the electricity and heat produced and in the third part the consumption, offering a more detailed view of the consumption by industry sectors.
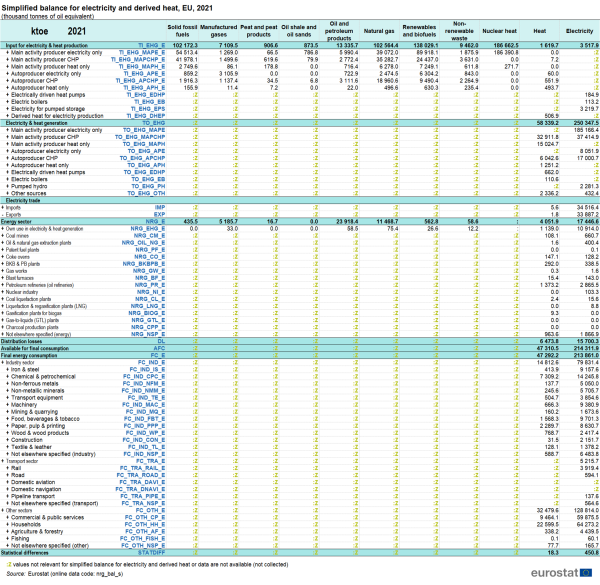
(thousand tonnes of oil equivalent)
Source: Eurostat (nrg_bal_s)
Consumption of electricity per capita in the households sector
Electricity consumption per capita in the households sector in the EU in 2021 was 1.7 MWh per capita (1 671 kWh). The range of electricity consumption per capita in the households sector in the EU Member States in 2021 varied widely, from consumption below 1 MWh per capita in Romania, Poland and Latvia, to consumption of more than 4 MWh per capita in Finland and Sweden (Figure 4).
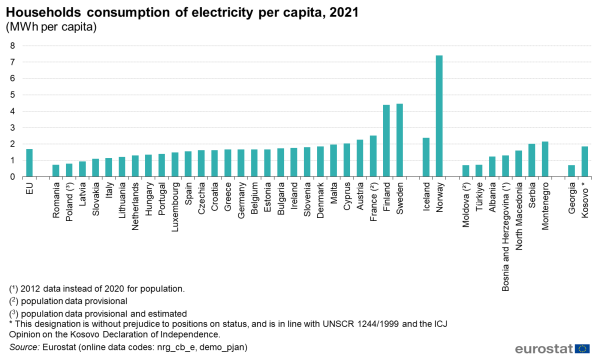
(MWh per capita)
Source: Eurostat (nrg_cb_e), (demo_pjan)
Looking at electricity consumption per capita in the households sector in non-EU countries, an even wider range is observed: from 0.7 MWh in Turkey, Moldova and Georgia to 7.4 MWh in Norway. The range is affected by the choice of energy used for space heating, climate conditions, as well as the level of economic development of each country.
Consumption of electricity per unit of GDP
Electricity consumption per unit of GDP (using purchasing power standards) in the EU in 2021 was 176.7 kWh per 1 000 euro (Figure 5). The amount of electricity consumed per unit of GDP depends on many factors, such as the general standard of living, the economy and weather conditions as well as the energy efficiency of buildings and appliances. Using GDP in purchasing power standards allows for better comparison across countries in one year.
The EU Member States with the lowest electricity consumption per unit of GDP in 2021 were Ireland, Luxembourg and Denmark. The highest rates of electricity consumption per unit of GDP were registered in Bulgaria and Finland.
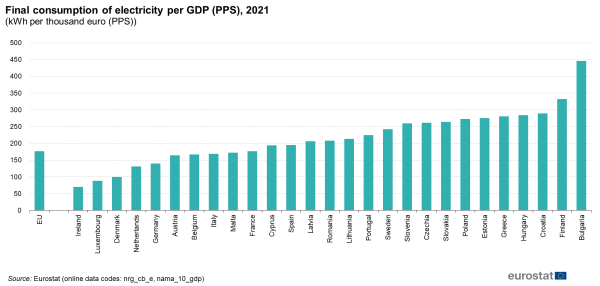
(kWh per thousand euro (PPS))
Source: Eurostat (nrg_cb_e), (nama_10_gdp)
Source data for tables and graphs
- Download the MS Excel file containing the data for the Tables and Figures.

Data sources
Data on energy are submitted on the basis of an internationally agreed methodology in joint annual energy questionnaires (Eurostat - OECD/IEA - UNECE). Data are available for all EU Member States and the methodology is harmonised for all reporting countries. Consequently, comparisons across countries can be performed.
Context
Modern societies are heavily dependent on electricity. Maintaining electricity supply is crucial for economic growth and prosperity of citizens. Heat plays a significant role in the supply of district heating in several countries in Europe. It is particularly widespread in North, Central and Eastern Europe. While both electricity and heat are appearing in nature in some form or another, in modern energy economy they are secondary energy sources. Electricity and heat are generated from primary energy sources, such as fossil fuels (mostly natural gas and coal), nuclear and renewables (hydro, wind, solar PV, geothermal energy, ambient heat and biofuels). Transition towards more sustainable supply of electricity power (e.g. from fossil fuels towards renewables) is crucially important for implementation of decarbonisation objectives of the EU – such as electrification of road transport. Several European policies in the context of the Energy Union and the European Green Deal are targeting also the electricity supply described in this article.
Direct access to
Visualisations
- Energy (nrg), see:
Energy statistics - quantities, annual data (nrg_quanta)
- Energy balances (nrg_bal)
- Production of electricity and derived heat by type of fuel (nrg_bal_peh)
- Supply, transformation and consumption - commodity balances (nrg_cb)
- Supply, transformation and consumption of electricity (nrg_cb_e)
- Supply, transformation and consumption of derived heat (nrg_cb_h)
- Energy indicators (nrg_ind)
- Gross and net production of electricity and derived heat by type of plant and operator (nrg_ind_peh)
- Gross production of electricity and derived heat from combustible fuels by type of plant and operator (nrg_ind_pehcf)
- Gross production of electricity and derived heat from non-combustible fuels by type of plant and operator (nrg_ind_pehnf)
- Production of electricity and heat by autoproducers, by type of plant (nrg_ind_pehap)
- Energy infrastructure and capacities (nrg_inf)
- Electricity production capacities by main fuel groups and operator (nrg_inf_epc)
- Electricity production capacities for renewables and wastes (nrg_inf_epcrw)
- Electricity production capacities for combustible fuels by technology and operator (nrg_inf_epct)
- Trade by partner country (nrg_t)
- Imports of electricity and derived heat by partner country (nrg_ti_eh)
- Exports of electricity and derived heat by partner country (nrg_te_eh)
- Energy balances (nrg_bal)
According to the purpose of production, power plants can be classified as main activity producers (enterprises, both privately or publicly owned, which generate electricity and/or heat for sale to third parties as their principal activity) and autoproducers (enterprises, both privately or publicly owned, which generate electricity and/or heat wholly or partly for their own use as an activity which supports their primary activity). Both main activity producers and autoproducers can produce only electricity, a combination of heat and electricity (CHP) or heat only.
Detailed data on gross electricity production by fuel and by main activity producers and autoproducers, as well as CHP main activity producers and CHP autoproducers are presented in Eurostat's energy database.
Derived heat includes heat produced in main activity producer plants and heat sold produced in autoproducer plants. Heat produced at the final place of consumption in the final consumption sectors (such as households) is not counted as the final energy consumption of "derived heat"; it is counted as the final energy consumption of the respective fuel (electricity, natural gas, etc.).
Gross electricity production is the total amount of electricity produced in power plants. Power plants consume some electricity for their own use; by deducting the own use of power plants from gross electricity production net electricity production is obtained. Net electricity production is transmitted and distributed via grids to final consumers.
- Supply, transformation and consumption — commodity balances (ESMS metadata file — nrg_cb_esms)
- Energy Statistics Manual
- Regulation (EU) 2018/1999 on the Governance of the Energy Union and Climate Action
- Regulation (EC) No 1099/2008 on energy statistics
Notes
- ↑ Gas includes natural gas and derived gases; and excludes biogas included in renewable energy sources.
- ↑ Oil includes crude oil and petroleum products.
- ↑ The category "Other" includes peat, peat products, oil shale and oil sands, non-renewables wastes, heat from chemical sources and other fuels.
- ↑ The category "Other" includes nuclear fuels, electricity, heat from chemical sources, oil shale and oil sands, and other fuels.
