EU international trade in transport services
Data extracted in March 2024
Planned article update: March 2025
Highlights
Sea transport was the biggest contributor to EU international trade in transport services between 2010 and 2022, accounting for about half of the total transport services, for both exports and imports.
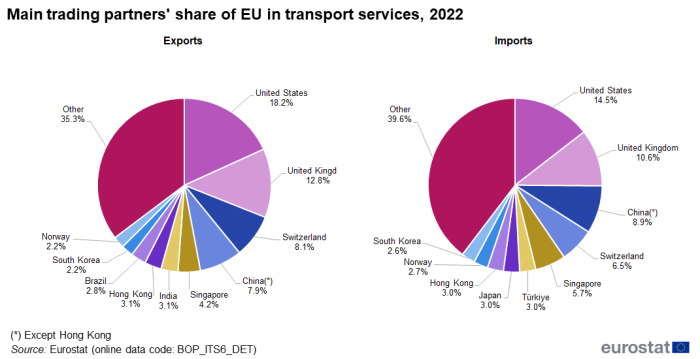
The United States was the EU's main trading partner in transport services in 2022, accounting for about 18.2 % of EU exports and 14.5 % of EU imports.
EU trade in transport services with extra-EU, 2010-2022
The role of trade in services in EU international trade has been growing steadily over the last decade and plays a major role in modern economies in an increasingly interlinked and globalised world. International trade in services flows show the transactions between residents and non-residents according to twelve main service categories of the Extended Balance of Payments Services classification (EBOPS 2010). In 2022 'Transport services' is the second largest contributor to EU trade in services with extra-EU accounting for 22.4 % of total services exports and 20.3 % of total services imports from non-EU countries. The largest service category is 'Other business services', presented in a separate article.
This article focuses on the structure and evolution of the EU's international trade in transport services with extra-EU. 'Transport services' can be further divided into four sub-categories[1] , namely 'Sea transport', 'Air transport', 'Other modes of transport' and 'Postal and courier services'. These sub-categories are presented in this article.
Full article
General overview
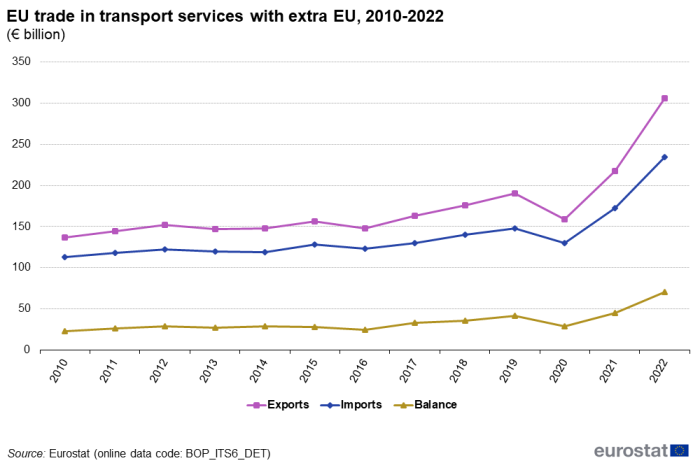
Figure 1 shows the time series for the evolution of international trade in 'Transport services' from 2010 to 2022. Exports of 'Transport services' exceeded imports during the entire period, resulting in a constant surplus for the EU. During the period 2010 to 2019 exports of 'Transport services' decreased only in 2013 (-3.2 % compared with the previous year) and 2016 (-5.6 %). Exports continuously increased for each year in the period 2017 to 2019. Exports of 'Transport services' decreased by 16.3 % in 2020. In 2021 the sector managed to recover increasing by 36.9 % compared with 2020. In 2022 transport services exports reached the highest level for the observed period (€305 billion) increasing by 40.2 %. Imports fluctuated in a similar manner as exports. In 2020, the decrease in the imports was smaller when compared with the exports (12.3 %). In 2021 imports increased by 33.1 % and by 35.6 % in 2022, reaching their highest level for the entire period (€234 billion). The sharp decrease in 2020 of both exports and imports of 'Transport services' was due to the Covid-19 pandemic and associated restrictive measures.
Source: Eurostat (bop_its6_det)
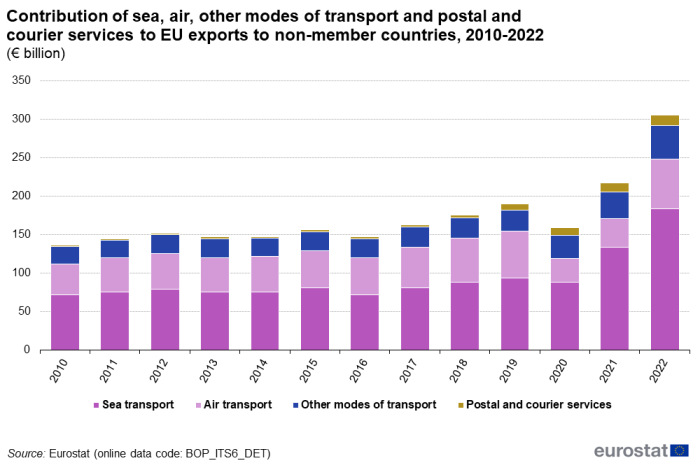
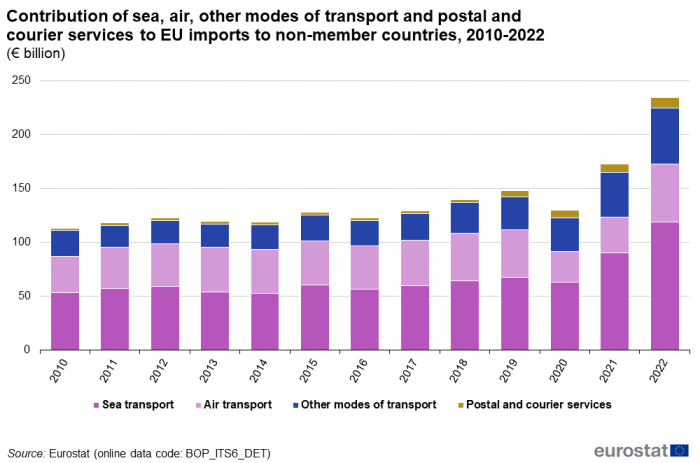
Figures 2 and 3 show the contributions of the four sub-categories of 'Transport services' to exports and imports for years 2010 to 2022.'Sea transport' provides the biggest contribution to both exports and imports accounting for about 60.3 % of the exports and 50.7 % of the imports in 2022. For exports, 'Air transport' was the second biggest category in 2022 (21.1 %), followed by 'Other modes of transport' (14.3 %), and 'Postal and courier services' (4.2 %). For imports, the second biggest category was 'Air transport' with 23.2 %, followed by 'Other modes of transport' (22.2 %) and 'Postal and courier services' (4.0 %).
'Air transport' exhibited both the sharpest decrease falling by 48.7 % for exports and 35.9 % for imports in 2020, and the sharpest increase rising by 73.9 % for exports and 62.9 % for imports in 2022.
Source: Eurostat (bop_its6_det)
Source: Eurostat (bop_its6_det)
In 2022, the United States was the EU's main trading partner for exports of transport services, accounting for 18.2 % of EU exports, followed by the United Kingdom with 12.8 % and by Switzerland with 8.1 %. As far as imports are concerned, the United States again has the leading role with 14.5 %; the United Kingdom comes second with 10.6 % and China except Hong Kong third with 8.9 % (see Figure 4).
Source: Eurostat (bop_its6_det)
Sea transport
'Sea transport'[2] covers all international freight and passenger transport services undertaken by seagoing vessels, except cruise fares (included in 'Travel'). It does not include transport by underwater pipelines (included in 'Pipeline transport').
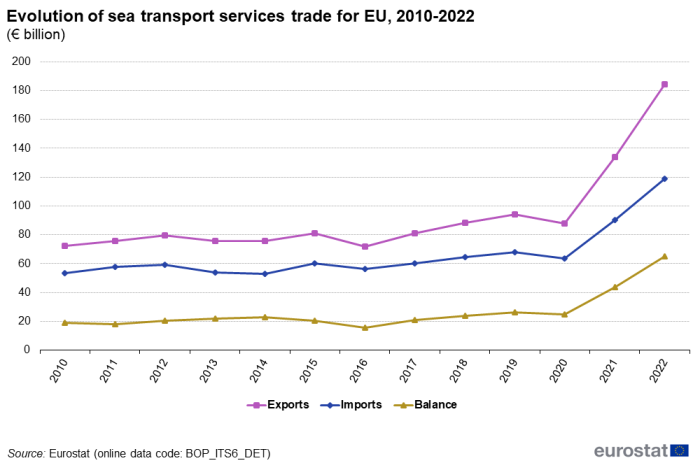
The evolution of the time series for 'Sea transport' services is shown in Figure 5. Exports of 'Sea transport' have been higher than imports during the observed period, resulting in a continuous trade surplus. A big decrease both in exports and imports was observed in 2016 (11.1 % and 6.3 % respectively). During the following three years both flows continuously increased. In 2020, there was a decrease of 6.4 % for exports and 6.6 % for imports. In 2021 and 2022 both exports and imports increased significantly: in 2021 by 52.2 % and 42.4 % respectively, and in 2022 by 37.3 % and 31.7 %).
Source: Eurostat (bop_its6_det)
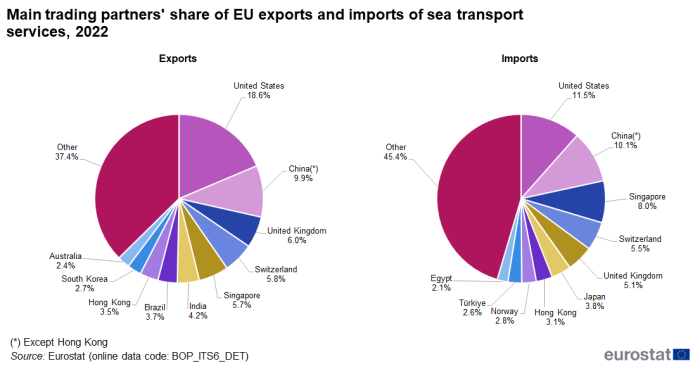
In 2022, the EU's largest trade partner for 'Sea transport' services was again the United States with 18.6 % of exports and 11.5 % of imports. For exports, China except Hong Kong came second with 9.9 % and the United Kingdom third with 6.0 %. For imports, the second biggest partner was China except Hong Kong with 10.1 % followed by Singapore with 8.0 % (see Figure 6).
Source: Eurostat (bop_its6_det)
Air transport
'Air transport'[3] covers all international freight and passenger transport services provided by aircraft.
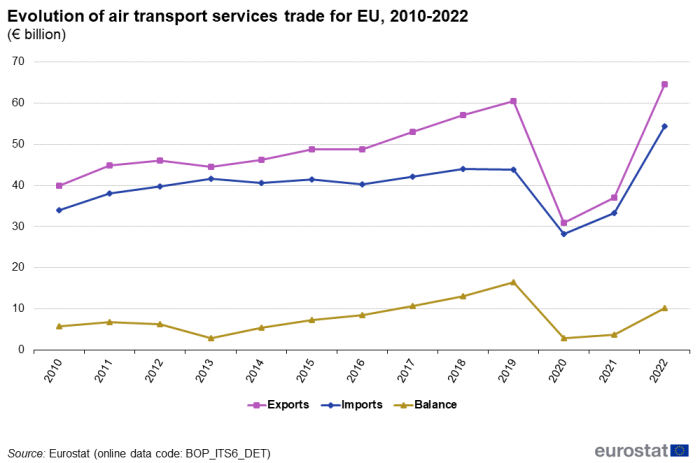
EU exports of air transport services has consistently exceeded imports during the period 2010 to 2022, resulting in a positive balance for all years in the observed period. Exports have been almost constantly increasing up to 2020 when a sharp drop of 48.7 % was recorded. In the same period imports exhibited small fluctuations until 2019, in which year they remained practically stable. In 2020, imports exhibited a sharp decline of 35.9 % (see Figure 7). The significant drop in both exports and imports of air transport in 2020 is due to the movement restriction measures associated with the Covid-19 pandemic. The 2020 exports and imports of air transport services are the lowest ever recorded in the period 2010-2020. In 2021 both exports and imports increased by 19.6 % and 18.6 % respectively, still remaining well below pre-pandemic levels. In 2022, both exports and imports increased significantly (exports by 73.9 % and imports by 62.9 %) and surpassed the values of 2019, before the Covid-19 pandemic.
Source: Eurostat (bop_its6_det)
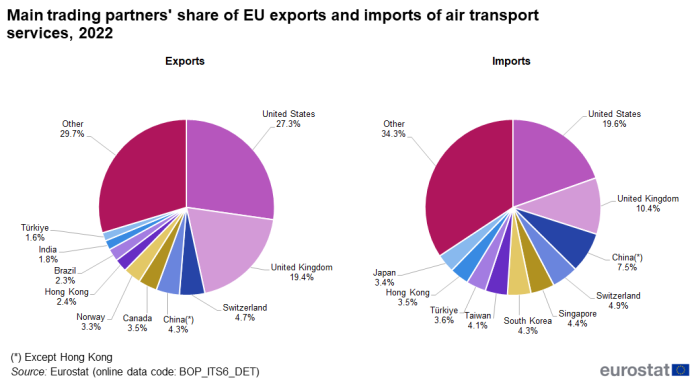
In 2022, the United States was again the largest partner for air transport services, accounting for 27.3 % of EU exports and 19.6 % of imports. The second largest partner was the United Kingdom with 19.4 % of exports and 10.4 % of imports. The third largest partners were Switzerland for exports with 4.7 % and China except Hong Kong for imports with 7.5 % (see Figure 8).
Source: Eurostat (bop_its6_det)
Other modes of transport
'Other modes of transport' services include all other modes of transport besides sea and air. They can be disaggregated to: space transport, rail transport, road transport, inland waterway transport, pipeline transport, electricity transmission and other supporting and auxiliary transport services (i.e. all other transport services that cannot be allocated to any of the components of transport services previously described).
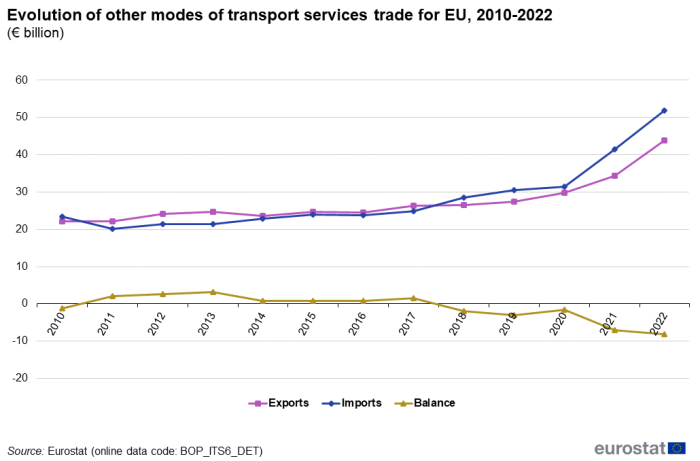
The time series for trade in 'Other modes of transport' for the period 2010-2022 is shown in Figure 9. Imports and exports have fluctuated for the observed period, resulting in higher imports for some of the years and to a negative balance in 2010, and all years after 2017. The Covid-19 pandemic does not seem to have significantly affected these modes of transport (a modest increase by 9.0 % for exports and 3.0 % for imports was recorded in 2020). The highest increase for exports during this period is observed in 2022 (27.2 %) and in 2021 for imports (32.5 %).
Source: Eurostat (bop_its6_det)
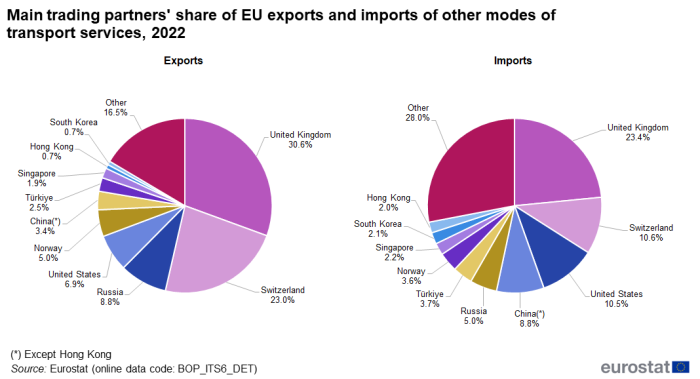
Regarding the EU's main trading partners for 'Other modes of transport' in 2022, the United Kingdom was the largest partner with 30.6 % of the EU exports and 23.4 % imports; Switzerland accounted for the second place with 23.0 % exports and 10.6 % imports. The third partners were Russia for exports (8.8 %) and the United States for imports (10.5 %) (see Figure 10).
Source: Eurostat (bop_its6_det)
Postal and courier services
'Postal and courier services'[4] cover the pick-up, transport and delivery of letters, newspapers, periodicals, brochures, other printed matter, parcels, and packages, including post office courier and mailbox rental services.
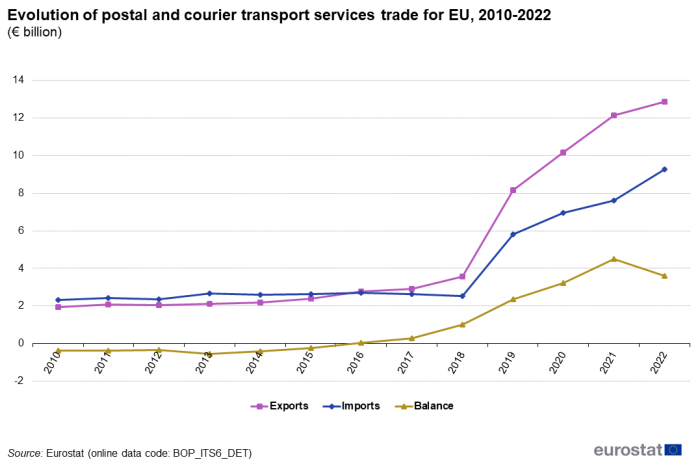
Figure 11 shows the evolution of 'Postal and courier services' for the period 2010 to 2022. During this period, EU exports of 'Postal and courier services' were constantly increasing excepting 2013 (-2 %). Imports of these services have been largely stable until 2018. Both exports and imports of 'Postal and courier services' recorded a sharp increase in 2019 (both by about 130 %) and continued to increase in the period 2020-2022. The balance of 'Postal and courier services' was negative until 2015 and has been positive since 2016.
Source: Eurostat (bop_its6_det)
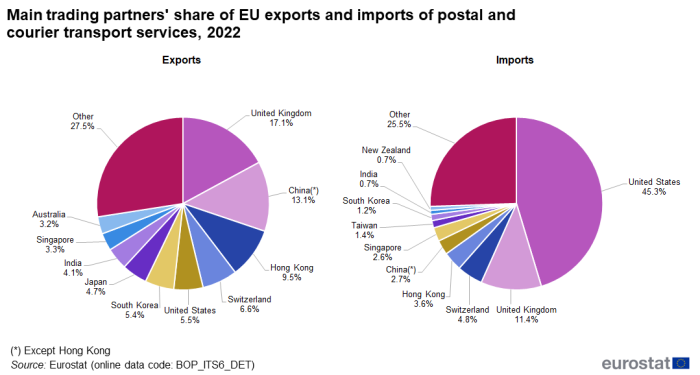
For 'Postal and courier services' the EU's main trading partner for exports in 2022 was the United Kingdom with 17.1 %, followed by China except Hong Kong with 13.1 % and Hong Kong with 9.5 %. Regarding imports, the main partner in 2022 was the United States with a share of 45.3 %, followed by the United Kingdom with 11.4 % and Switzerland with 4.8 % (see Figure 12).
Source: Eurostat (bop_its6_det)
Source data for tables and graphs
Data sources
EU data on transport services trade come from the Eurostat reference database on international trade in services and are prepared in accordance with BPM6, the current balance of payments methodology. The data are updated annually. They are available since 2010 for EU aggregates, all EU Member States and non-EU countries (EFTA, candidate countries and other countries). Pre-2010 data are also available in the Eurostat reference database but are prepared in accordance with the previous balance of payments methodology (BPM5). Statistics on EU trade with extra-EU are calculated as the sum of trade conducted by the 27 Member States and the European Union institutions (except the European Central Bank and European Stability Mechanism) with the countries outside the EU (no flows within the EU are taken into account).
Transport[5] is the process of carriage of people and objects from one location to another as well as related supporting and auxiliary services.
Transport can be classified according to:
- (i) mode of transport and
- (ii) what is carried. The transport services category can be further divided into four sub-categories[6] , namely:
- Sea transport
- Air transport
- Other modes of transport
- Postal and courier services.
For instance, in the case of passenger transport, international trade in transport services covers all services provided to non-residents by resident carriers and to residents by non-resident carriers. Nevertheless, the transport of travellers (non-residents) is not included in transport. In international services trade it is classified under travel services. In the case of freight, transport services include all the international transport of the economy's exports and imports of goods. Moreover, it includes freight services provided by resident operators on the compiling economy's imports inside the customs frontier of the exporting economy (exports of freight services). Accordingly it also comprises transport services provided by non-resident operators of the compiling economy, inside the customs frontier of the compiling economy, on the compiling economy exports (imports of freight services).
Context
International trade in services makes up part of the current account of the balance of payments and covers the transactions between the residents and non-residents of a country during a given period. International trade in services follows the BPM6 methodology, which uses 12 main service categories, one of which is transport services. EU trade in services with the non EU countries has been on an increasing trend from 2010 to 2019 for both imports and exports.
Direct access to
Other articles
- All articles on balance of payments
- Balance of payments and international investment position manual (BPM6)
- Measuring international trade in services - from BPM5 to BPM6
- Services trade by enterprise characteristics - STEC
- EU international trade in other business services
- International trade in services
- Services trade statistics by modes of supply
- International Trade in Services statistics - background
Dedicated section
Methodology
- Balance of payments - International transactions (BPM6) (ESMS metadata file — bop_6_esms)
- International trade in services, geographical breakdown (BPM6) (ESMS metadata file — bop_its6_esms)
Legislation
- Regulation (EC) No 184/2005 of 12 January 2005 on Community statistics concerning balance of payments, international trade in services and foreign direct investment. (Summary)
- Regulation (EU) No 555/2012 of 22 June 2012 amending Regulation (EC) No 184/2005 on Community statistics concerning balance of payments, international trade in services and foreign direct investment, as regards the update of data requirements and definitions.
- Regulation (EU) No 2016/1013 of 8 June 2016 amending Regulation (EC) No 184/2005 on Community statistics concerning balance of payments, international trade in services and foreign direct investment.
Visualisations
External links
- European Commission — Trade
- International Monetary Fund (IMF) — International Trade in Services: Recent Methodological Developments
- Newsletter of the Interagency Task Force on Statistics of International Trade in Services
- OECD — Services trade
- United Nations Conference on Trade and Development (UNCTAD) — Manual on Statistics of International Trade in Services 2010 (MSITS 2010)
Notes
- ↑ As defined by the Balance of Payments Manual 6 (BPM6) par. 10.74
- ↑ According to MSITS par. 3.83
- ↑ According to MSITS par. 3.84
- ↑ According to the Balance of Payments Manual 6 (BPM6) par. 10.82
- ↑ As defined by the Balance of Payments Manual 6 (BPM6) par. 10.74
- ↑ As defined by the Balance of Payments Manual 6 (BPM6) par. 10.74