Digital economy and society statistics - enterprises
Data extracted in January 2024
Planned article update: January 2025
Highlights
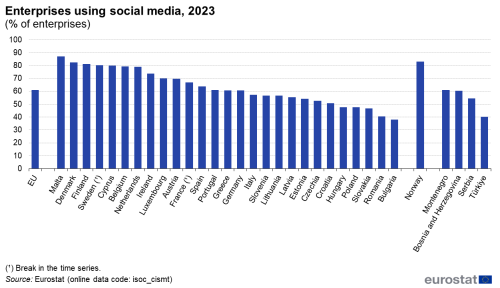
In 2023, 60.9 % of EU enterprises used social media.
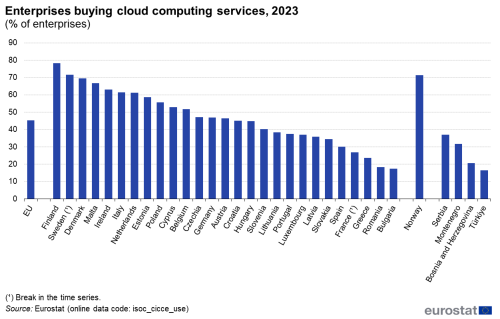
In 2023, 45.2 % of EU enterprises bought cloud computing services.
During 2023, 22.9 % of EU enterprises made electronic sales (e-sales).
The share of EU enterprises using fixed internet connections of more than 1 Gb/s was 12.8 % in 2023.
Enterprises performing data analytics by own employees or by an external provider, 2023
This article presents recent statistical data on several different aspects of the digital economy and society in the European Union (EU), focusing on the use of information and communication technologies (ICT) by enterprises.
Progress in the development of the digital economy is regarded as essential to improve the competitiveness of the EU’s economy. ICTs have quickly become an integral part of how enterprises function: indeed, their extensive use has had a profound impact on how businesses are run, touching upon a range of aspects such as how they organise their production or service provision processes and their internal or external communication.
This article presents recent statistics on the use of the internet by enterprises; the functions provided by enterprises’ websites; the types of social media used by enterprises; the use of e-business applications and data analytics. Other important topics in the article reflect the adoption in the EU enterprises of some advanced technologies like cloud computing and artificial intelligence (AI). The article closes with information on e-commerce.
Full article
Access to the internet
Enterprises connected to the internet via fixed broadband
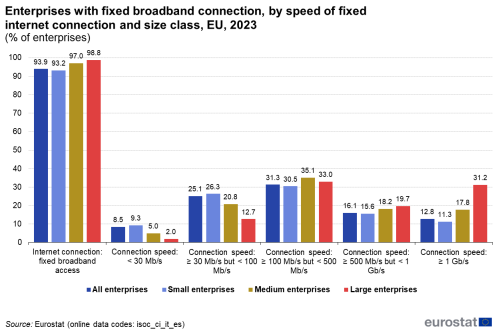
In 2023, the vast majority (93.9 %) of EU enterprises with at least 10 employees and self-employed persons used a fixed broadband connection to access the internet (see Figure 1). The share was even higher for medium and large enterprises, where almost all enterprises reported to connect to the internet via fixed broadband.
(% of enterprises)
Source: Eurostat (isoc_ci_it_es)
More than one quarter of large enterprises use internet connections faster than 1Gb/s
With almost all enterprises connected to the internet via broadband, the speed of these connections still deserves attention, as the use of other more advanced technologies by the enterprises often relies on high speed of the internet. In 2023, 8.5 % of enterprises in the EU had an internet connection speed that was below < 30 Mb/s, with higher shares having a connection that was in the range of ≥ 30 Mb/s but < 100 Mb/s (25.1 %) and in the range of ≥ 100 Mb/s but < 500 Mb/s (31.3 %). Nearly one sixth (16.1 %) had a connection in the range of ≥ 100 Mb/s but < 1 Gb/s, while the fastest internet connections (at least 1 Gb/s) were used by one eighth (12.8 %) of enterprises in the EU. As can be seen from Figure 1, the share of large enterprises using the fastest connection speeds (≥ 1 Gb/s) was almost three times higher (31.2 %) than the figure recorded for small enterprises (11.3 %).
In 2023, 78.1 % of EU enterprises have a website
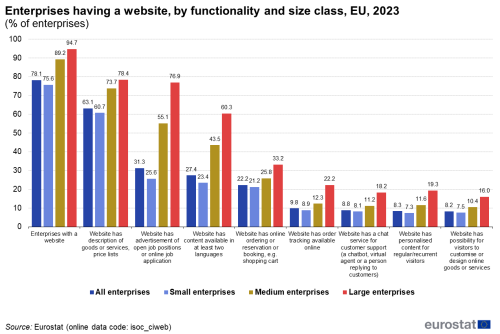
The use of ICT has the potential to make significant changes to the way that enterprises are run, the adoption of ICT-based solutions within business processes is often referred to using the generic term of ‘e-business’. Figure 2 presents information in relation to one of the most basic types of e-business that is used by enterprises, namely having a website. In 2023, more than three quarters (78.1 %) of enterprises in the EU had a website, with a much higher share for large enterprises (94.7 %) compared with small enterprises (75.6 %). The most popular functions provided by enterprises’ websites were related to the description of goods and services and price lists (63.1 % of enterprises), advertisement of open job positions or online job application (31.3 %) and content available in at least two languages (27.4 %).
(% of enterprises)
Source: Eurostat (isoc_ciweb)
Enterprises using social media
Enterprises use social media for image building or for marketing purposes, for gaining insights from customers or communicating within or outside the enterprise or for recruiting. The three most widely known categories of social media include:
- social networks (e.g. Facebook, LinkedIn, Xing, Viadeo, Yammer),
- corporate blogs or microblogs such as Twitter (now known as X),
- multimedia content-sharing websites (e.g. YouTube, Flickr, SlideShare, Instagram, Pinterest, Snapchat).
More than half of EU enterprises use social networks
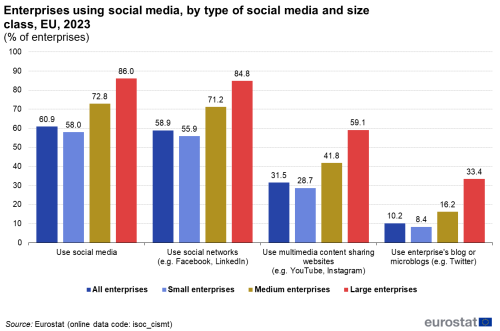
As shown in Figure 3, 60.9 % of EU enterprises used any type of social media in 2023. Social networks were the most popular social media, used by 58.9 % of enterprises in the EU, followed by multimedia content-sharing websites, which were used by 31.5 % of enterprises. Corporate blogs were less popular and were used by 10.2 % of EU enterprises. In 2023, the share of large enterprises, which used any type of social media stood at 86 % and was 28 percentage points higher than the figure recorded for small enterprises employing 10 to 49 people (58 %). More than four fifths of EU large enterprises (84.8 %) had an account and used some kind of social networks. By contrast, slightly more than half of small enterprises (55.9 %) used social networks. Multimedia content-sharing websites were used by 59.1 % of large enterprises compared with 28.7 % of small EU businesses (Figure 3).
(% of enterprises)
Source: Eurostat (isoc_cismt)
Figure 4 presents the use of social media by enterprises in the Member States. Social media was most popular among enterprises in Malta, where 87.1 % of enterprises reported to use any type of social media. In seven other EU Member States (Denmark, Finland, Sweden, Cyprus, Belgium, the Netherlands and Ireland) the recorded figures were higher than 70 %. The share of enterprises using social media was less than 40 % in Bulgaria (38 %).
E-business integration
E-business integration refers to the use of information and communication technologies (ICT) by enterprises to run, integrate and improve their business processes, share and exchange information internally, analyse data or communicate with business partners and customers. The sharing and exchange of information electronically and automatically between different business functions within the enterprise is implemented using software applications for enterprise resource planning (ERP). The integration and management of the communitarian with customers is implemented by the use of customer relationship management (CRM) applications. Furthermore, the analysis of data from internal and external sources and the presentation of the findings in reports, graphs, charts and maps with the aim to provide users with insights for decision-making and strategic planning is done with Business Intelligence (BI) software.
More than one in three enterprises use enterprise resource planning (ERP) software applications
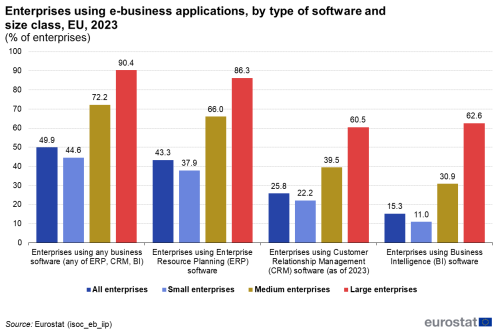
The percentage of EU enterprises that used ERP software applications reached 43.3 % in 2023. The share of small enterprises using ERP software applications was 37.9 %, and it was almost two times lower than the percentage recorded for medium (66 %) and more than two and half times lower than the percentage for large enterprises (86.3 %). Customer relationship management (CRM) applications were used by one-fourth (25.8 %) of EU enterprises in 2023. The share of small enterprises using CRM applications stood at 22.2 % and was almost 16 percentage points lower that the figure recorded for the use of ERP software. The adoption of CRM applications among large enterprises (60.5 %) was 25.8 percentage points lower compared to the use of ERP. The share of enterprises using Business Intelligence (BI) software was 15.3 % in 2023 and it was lower than the shares recorded for both ERP and CRM software. Among large enterprises however BI software (62.6 %) was used slightly more that CRM software. In 2023, almost half of EU enterprises (49.9 %) used any ERP, CRM, or BI business software (Figure 5).
(% of enterprises)
Source: Eurostat (isoc_eb_iip)
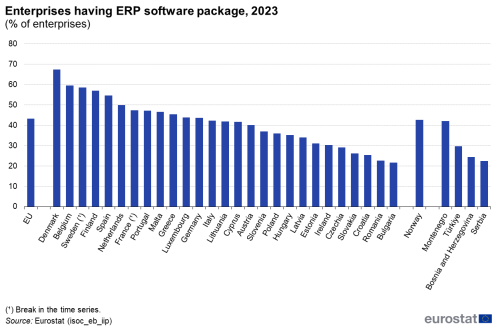
Among the three types of business software, the ERP was used by the highest share of EU enterprises. In 2023, more than half of the enterprises in Denmark, Belgium, Sweden, Finland and Spain used an ERP software package to share information between different functional areas. On the other hand, ERP software was used by less than one quarter of enterprises in Romania (22.6 %) and Bulgaria (21.7 %) (Figure 6).
(% of enterprises)
Source: Eurostat (isoc_eb_iip)
Cloud computing
Instead of building or expanding their own IT infrastructure, enterprises can buy computing resources hosted by third parties on the internet. This pool of resources is most commonly known as ‘cloud computing’ and includes flexible, on demand access to services like software, computing power, storage capacity, etc.
45.2 % of enterprises in the EU use cloud computing services
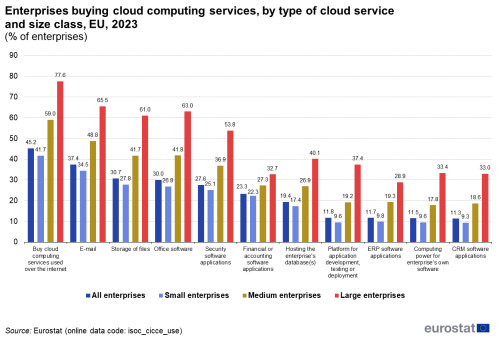
In 2023, 45.2 % of enterprises in the EU with more than 10 employees and self-employed persons reported that they used cloud computing services (see Figure 7). The adoption of cloud computing was at a very high level among large enterprises with a share of 77.6 % of enterprises. More than one third of EU enterprises (37.4 %) relied on a cloud solution for their e-mails. Almost one in three enterprises (30.7 %) used the cloud for storing files. 30 % reported using it for office software (e.g. word processors, spreadsheets) and 27.6 % for security software applications, while some 19.4 % used it to host their database. Most importantly, via the cloud, enterprises have access to more sophisticated applications, for finances/accounting (23.3 %), for planning their processes and resources (enterprise resource planning (ERP)) (11.7 %) and for managing information about their customers (customer relationship management (CRM)) (11.3 %). Slightly more than one in nine enterprises (11.8 %) purchased cloud computing services as computing platform providing a hosted environment for application development, testing or deployment. In addition, 11.5 % reported buying cloud computing power in order to run their own business software applications.
(% of enterprises)
Source: Eurostat (isoc_cicce_use)
In 2023, the use of cloud computing varied significantly among EU Member States. The highest shares were reported in Finland (78.3 %), Sweden (71.6 %), Denmark (69.5 %) and Malta (66.7 %). On the other hand, cloud computing services were used by fewer than one in five enterprises in Bulgaria (17.5 %) and Romania (18.4 %) (Figure 8).
(% of enterprises)
Source: Eurostat (isoc_cicce_use)
Data analytics
Data analytics refers to the use of technologies, techniques or software tools for analysing internal data or data from external sources and to extract patterns, trends and insights from the data to make conclusions, predictions and better decision-making with the aim to improve the performance in the enterprise (e.g. increase production, reduce costs).
More than two thirds of large EU enterprises perform data analytics
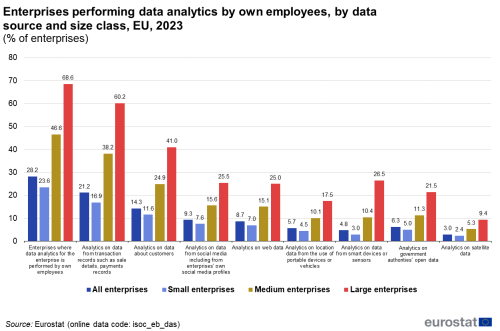
In 2023, more than a quarter (28.2 %) of enterprises in the EU with more than 10 employees and self-employed persons were performing data analytics by their own employees. The share of large enterprises (68.6 %) where their own employees performed data analytics was almost three times higher compared with small enterprises (23.6 %). Data analytics was performed on data from different sources. In more than one in five enterprises (21.2 %) data analytics was performed on data from transaction records such as sale details, payments records. Analytics on data about customers was performed by 14.3 % of enterprises. The third most common data source for data analytics was data from social media that was used by almost 1 in 10 enterprises (9.3 %). Among large enterprises however the third most popular data analytics source with a share of 26.5 % were data from smart devices or sensors (compared to 25.5 % for social media data). The least popular data source was satellite data, where 3 % of EU enterprises reported to perform data analytics on such data (Figure 9).
(% of enterprises)
Source: Eurostat (isoc_eb_das)
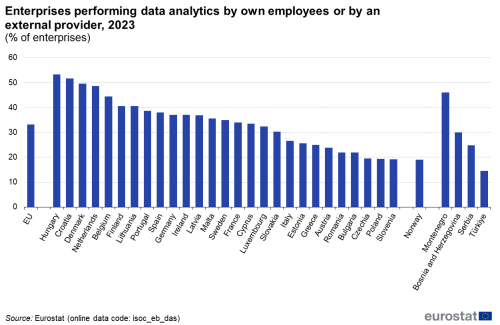
In 2023, 28.2 % of enterprises in the EU performed data analytics by their own employees. In 10.4 % of enterprises data analytics for the enterprise was performed by an external enterprise or organisation (see isoc_eb_das). Combined, one third of EU enterprises (33.2 %) performed data analytics. Among EU Member States, more than half of enterprises performed data analytics either by their own employees or by an external provider in Hungary (53.2 %) and Croatia (51.7 %). In contrast, less than 20 % of enterprises in Czechia (19.5 %), Poland (19.3 %), and Slovenia (19.1 %) reported performing data analytics in 2023.
(% of enterprises)
Source: Eurostat (isoc_eb_das)
Artificial intelligence (AI)
Artificial intelligence refers to systems that use technologies such as: text mining, computer vision, speech recognition, natural language generation, machine learning, deep learning to gather and/or use data to predict, recommend or decide, with varying levels of autonomy, the best action to achieve specific goals. Artificial intelligence systems can be purely software based, or embedded in devices.
In 2023 less than 1 in 10 EU enterprises used AI technologies
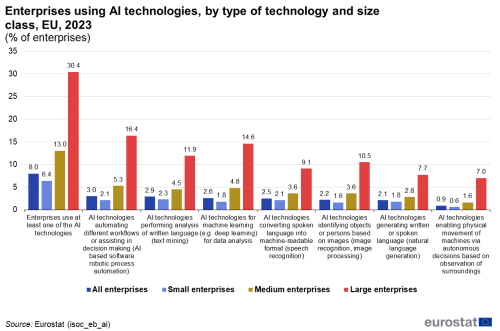
In 2023, 8 % of enterprises in the EU with more than 10 employees and self-employed persons reported using one or several of the following AI technologies:
- AI technologies for performing analysis of written language
- AI technologies for machine learning (e.g. deep learning)
- AI technologies automating different workflows or assisting in decision making
- AI technologies for converting spoken language into machine-readable format
- AI technologies for identifying objects or persons based on images
- AI technologies for generating written or spoken language
- AI technologies enabling physical movement of machines via autonomous decisions based on observation of surroundings
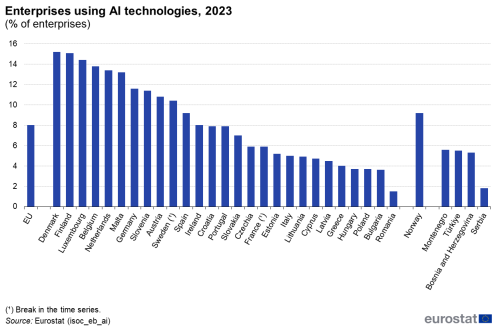
The share of large enterprises using these AI technologies stood at 30.4 % and was significantly higher than the value recorded for small enterprises (6.4 %). The difference might be explained with the complexity of the implementation of the AI technologies within the enterprise. Although at a low level, EU enterprises used most AI technologies automating different workflows (3 %), AI technologies for performing analysis of written language (2.9 %) and AI technologies for machine learning (2.6 %). Again, the share of large enterprises reported using these types of AI technologies was 4 to 6 times higher (Figure 11).
(% of enterprises)
Source: Eurostat (isoc_eb_ai)
Among EU Member States, AI technologies were used by more than 15 % of enterprises in Denmark 15.2 % and Finland (15.1 %). The take up of AI technologies was at a low level in the majority of the other EU Member States with shares below 10 %. The lowest figures were recorded in Hungary and Poland (both 3.7 %), Bulgaria (3.6 %) and Romania (1.5 %).
Enterprises engaged in e-commerce
E-commerce refers to the trading of goods or services over computer networks such as the internet. E-sales concern the receipt of orders by methods specifically designed for the purpose of receiving orders, either via electronic data interchange (EDI) or through websites or apps (web sales); orders received by way of manually typed e-mail messages are excluded.
Almost 1 in 4 EU enterprises made e-sales in 2022
In 2022, 22.9 % of enterprises in the EU made e-commerce sales. These e-sales accounted for 18.0 % of the total turnover generated during 2022 (see Figure 13).
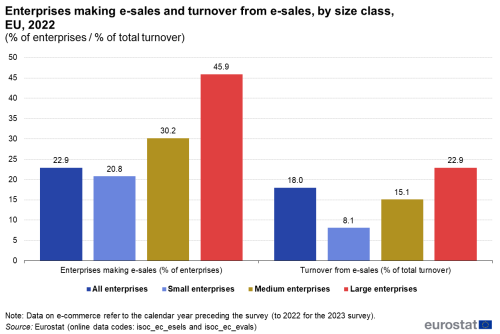
(% of enterprises / % of total turnover)
Source: Eurostat (isoc_ec_esels) and (isoc_ec_evals)
The share of turnover from EDI-type sales is greater than that from web sales
Enterprises which receive e-commerce orders may be divided into those making e-sales via a website or apps (web sales) and those making e-sales via electronic data interchange (EDI). Although a higher proportion (19.4 %) of enterprises used websites and apps to make e-sales in 20221 than used EDI-type sales (6.0 %) (see Eurostat data source isoc_ec_esels), the share of turnover from web sales in the total turnover generated by EU enterprises was relatively low, standing at 6.7 % in comparison with 11.2 % for the turnover from EDI-type sales (see Figure 14).
In relative terms, the split in turnover between that generated from e-sales via EDI-type messages and that generated by web sales was most pronounced in Poland, Slovenia, Denmark, Finland, Italy and Hungary, where EDI-type sales accounted for a share of total turnover that was at least two and half times as high as that recorded for web sales. By contrast, in the Netherlands, Latvia, Lithuania, Bulgaria, Ireland, Greece and Cyprus, the share of total turnover generated by web sales was higher than the share generated via EDI-type sales.
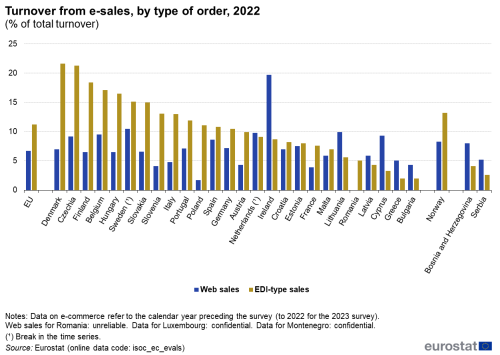
(% of total turnover)
Source: Eurostat (isoc_ec_evals)
More turnover comes from web sales to other businesses and public authorities than from business to consumer web sales
Across the EU, enterprises generated 6.7 % of their total turnover from web sales during 2022, consisting of sales via a website or apps. Figure 15 presents an analysis of how these sales were divided between different types of customer. Total turnover coming from web sales to other businesses and government (B2BG) was 3.6 %, while 3.1 % of total turnover came from business to consumer web sales (B2C).
Malta, Romania, France, Greece, Czechia, Spain, and Latvia were the EU Member States to report that the majority of their turnover from web sales in 2022 was derived from business to consumer sales. By contrast, the share of total turnover that was derived from web sales made through business to business and business to government web transactions was at least twice as high as the share from business to consumer web sales in Slovakia, Hungary, Slovenia, and Belgium.
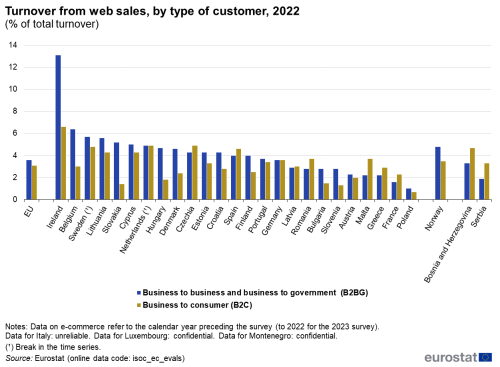
(% of total turnover)
Source: Eurostat (isoc_ec_evals)
Almost twice as many enterprises use their own websites or apps than e-commerce marketplaces for their web sales
Figure 16 presents the breakdown by sales channel used by enterprises that made web sales in 2022. The information is split between those enterprises that made web sales via their own website or apps and those enterprises that made web sales via e-commerce marketplaces. During 2022, 84.7 % of enterprises in the EU used their own website or apps for sales, while 42.9 % used an e-commerce marketplace. More than 95 % of enterprises with web sales sold online via their own website or apps in Estonia (97.3 %), Denmark (95.6 %) and Finland (95.1 %). The lowest share was registered in Lithuania (42.8 %), where enterprises with web sales preferred to sell via e-commerce marketplaces (82.3 %). High shares of enterprises with web sales selling via e-commerce marketplaces were recorded in Greece (50.2 %), Cyprus (52.9 %), Italy (57.7 %) and Poland (59.5 %) (Figure 16).
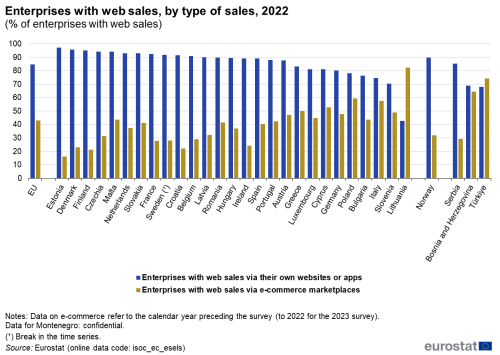
(% of enterprises with web sales)
Source: Eurostat (isoc_ec_esels) aEnterprises with web sales, by type of sales, 2022
Source data for tables and graphs
Data sources
Rapid technological changes in areas related to the internet and other new applications of ICTs pose challenges for statistics. As such, this area of statistics changes at a relatively rapid pace, compared with most other official statistics. Indeed, statistical tools are adapted to satisfy new demands for data and the ICT survey is reassessed on an annual basis in order to reflect the rapid pace of technological change.
The information presented in this article is based on the results of a EU survey on ICT usage and e-commerce in enterprises. The statistics were obtained from enterprise surveys conducted by national statistical authorities. The results of this annual survey are used to benchmark ICT-driven developments, both by following developments for core variables over time and by looking in greater depth at other aspects at a specific point in time.
While the survey on ICT usage in enterprises initially concentrated on e-commerce, internet access and connectivity issues, its scope has subsequently been extended to cover a wider variety of subjects (for example, cloud computing, social media, mobile connections to the internet, the use of e-business solutions, ICT specialists, the outsourcing of ICT functions, the use of IoT and artificial intelligence, data analysis and 3D printing).
Coverage
The statistical observation unit is the enterprise, as defined in Regulation (EEC) No 696/93. Note that the annual survey on ICT usage in enterprises covers enterprises that have at least 10 employees and self-employed persons.
The activity coverage of the survey is restricted to those enterprises whose principal activity is within NACE Rev. 2 Sections C to N excluding Section K and Division 75, but including Group 95.1. These are manufacturing; electricity, gas, steam and water supply, sewerage and waste management; construction; wholesale and retail trade, repair of motor vehicles and motorcycles; transportation and storage; accommodation and food service activities; information and communication; real estate; professional, scientific and technical activities (excluding veterinary activities); administrative and support activities; and the repair of computers and communication equipment.
The data collected can be analysed according to enterprise size classes (defined in terms of employees and self-employed persons), with information presented for small enterprises (10-49 employees and self-employed persons), medium enterprises (50-249 employees and self-employed persons) and large enterprises (250 or more employees and self-employed persons).
The data are organised in Eurostat’s online database according to the year in which the survey was conducted. Most data refer to the situation during the early part of the same year as the survey. However, data on e-commerce, recruitment of ICT specialists and consequences of ICT related security incidents refer to the calendar year preceding the survey (in other words, to 2022 for the 2023 survey).
Context
In 2019, the new European Commission President, Ursula von der Leyen, described how she wanted the EU to grasp the opportunities presented by the digital age. Indeed, A Europe fit for the digital age is one of six Commission priorities for the period 2019-2024. Such a digital transformation is based on the premise that digital technologies and solutions should: open up new opportunities for businesses; boost the development of trustworthy technology; foster an open and democratic society; enable a vibrant and sustainable economy; help fight climate change. With this in mind, during February 2020 the European Commission adopted an overarching presentation of the Commission’s ideas and actions for Shaping Europe’s Digital Future, as well as specific proposals in relation to:
- A European strategy for data which seeks to promote the EU as a leading role model for a society empowered by data to make better decisions — in business and the public sector; and
- White Paper on Artificial Intelligence — A European approach to excellence and trust which supports a regulatory and investment oriented approach with the twin objectives of promoting the uptake of artificial intelligence and addressing the risks associated with certain uses of this new technology.
In 2021, the Digital Compass for the EU's Digital Decade (COM(2021)118 final, set the EU’s digital targets for 2030 by the evolving around four cardinal points: skills, digital transformation of businesses, secure and sustainable digital infrastructures, and digitalization of public services.
Direct access to
- Digital economy and society statistics - enterprises
- E-commerce statistics
- Cloud computing - statistics on the use by enterprises
- Use of artificial intelligence in enterprises
- Use of Internet of Things in enterprises
- E-business integration
- ICT security in enterprises
- Social media - statistics on the use by enterprises
- ICT specialists in employment
- Impact of COVID-19 on the use of ICT in enterprises
- Impact of COVID-19 on e-sales of enterprises
- ICT usage in enterprises (t_isoc_e)
- Digital skills (t_isoc_sk)
- ICT sector (t_isoc_se)
- Digital economy and society<noprint>, see:
- ICT usage in enterprises (isoc_e)
- E-commerce (isoc_ec)
- E-commerce sales of enterprises by size class of enterprise (isoc_ec_esels)
- Value of e-commerce sales by size class of enterprise (isoc_ec_evals)
- Connection to the internet (isoc_ci)
- Internet access by size class of enterprise (isoc_ci_in_es)
- Websites and use of social media (isoc_cism)
- Websites and functionalities by size class of enterprise (isoc_ciweb)
- Social media use by type, internet advertising and size class of enterprise (isoc_cismt)
- E-business (isoc_eb)
- Integration of internal processes by size class of enterprise (isoc_eb_iip)
- Cloud computing services by size class of enterprise (isoc_cicce_use)
- Data analytics by size class of enterprise (isoc_eb_das)
- Artificial intelligence by size class of enterprise (isoc_eb_ai)
- E-commerce (isoc_ec)
- Regulation (EU) 2019/2152 of the European Parliament and of the Council of 27 November 2019 on European business statistics
- Regulation (EC) No 808/2004 of the European Parliament and of the Council of 21 April 2004 concerning Community statistics on the information society
- Regulation (EC) No 960/2008 of 30 September 2008 implementing Regulation (EC) No 808/2004 concerning Community statistics on the information society
- Regulation (EC) No 1023/2009 of 29 October 2009 implementing Regulation (EC) No 808/2004 concerning Community statistics on the information society
- Regulation (EU) No 821/2010 of 17 September 2010 implementing Regulation (EC) No 808/2004 concerning Community statistics on the information society
- Regulation (EU) No 937/2011 of 21 September 2011 implementing Regulation (EC) No 808/2004 concerning Community statistics on the information society
- Regulation (EU) No 1083/2012 of 19 November 2012 implementing Regulation (EC) No 808/2004 concerning Community statistics on the information society
- Regulation (EU) No 859/2013 of 5 September 2013 implementing Regulation (EC) No 808/2004 concerning Community statistics on the information society
- Regulation (EU) No 1196/2014 of 30 October 2014 implementing Regulation (EC) No 808/2004 concerning Community statistics on the information society
- Regulation (EU) 2015/2003 of 10 November 2015 implementing Regulation (EC) No 808/2004 concerning Community statistics on the information society
- Regulation (EU) 2016/2015 of 17 November 2016 implementing Regulation (EC) No 808/2004 concerning Community statistics on the information society
- Regulation (EU) 2017/1515 of 31 August 2017 implementing Regulation (EC) No 808/2004 concerning Community statistics on the information society
- Regulation (EU) 2018/1798 of 21 November 2018 implementing Regulation (EC) No 808/2004 of the European Parliament and of the Council concerning Community statistics on the information society for the reference year 2019
- Regulation (EU) 2019/1910 of 7 November 2019 implementing Regulation (EC) No 808/2004 of the European Parliament and of the Council concerning Community statistics on the information society for reference year 2020
- Regulation (EU) 2020/1030 of 15 July 2020 laying down the technical specifications of data requirements for the topic ‘ICT usage and e-commerce’ for the reference year 2021, pursuant to Regulation (EU) 2019/2152 of the European Parliament and of the Council
- Regulation (EU) 2021/1190 of 15 July 2021 laying down the technical specifications of data requirements for the topic ‘ICT usage and e-commerce’ for the reference year 2022 pursuant to Regulation (EU) 2019/2152 of the European Parliament and of the Council
- Regulation (EU) 2022/1344 of 1 August 2022 laying down the technical specifications of data requirements for the topic 'ICT usage and e-commerce' for the reference year 2023, pursuant to Regulation (EU) 2019/2152 of the European Parliament and of the Council
