Archive:Crime statistics
- Data from January 2014. Most recent data: Further Eurostat information, Main tables and Database.
For a fresher article on this topic see Crime and criminal justice statistics.

(2007 = 100) - Source: Eurostat (crim_gen)

(per 100 000 inhabitants) - Source: Eurostat (crim_gen), (demo_pjan) and (demo_r_d2jan)
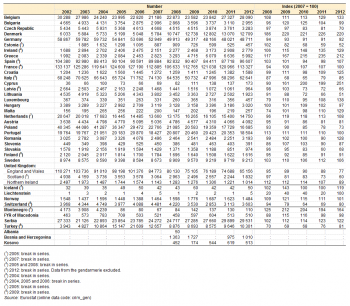
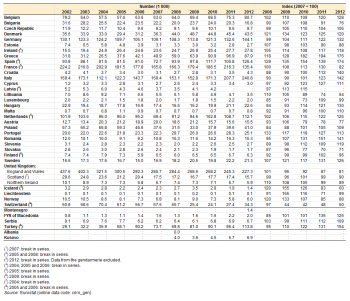
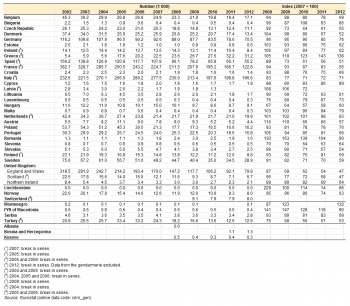

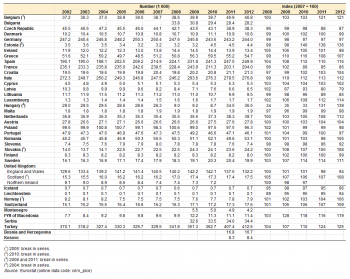
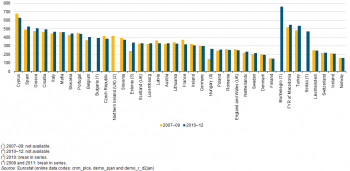
(per 100 000 inhabitants) - Source: Eurostat (crim_plce), (demo_pjan) and (demo_r_d2jan)

(per 100 000 inhabitants) - Source: Eurostat (crim_pris), (demo_pjan) and (demo_r_d2jan)
This article presents recent statistics on crime and criminal justice in the European Union (EU). The statistics currently available reflect the diversity of policing and legal systems within the EU: as such, comparisons of crime statistics between EU Member States should focus on trends over time, rather than directly comparing levels between countries for a specific year, given that the data can be affected by a range of factors, including different levels of criminalisation, the efficiency of criminal justice systems, and police recording practices. Furthermore, not all crimes are recorded by the police.
Main statistical findings
Crimes recorded by the police
The crime statistics presented in this article cover offences recorded by police in EU Member States and some other European countries. These data do not purport to describe all crime in Europe: some crime goes unreported and changes in rates of particular offences may be affected by new policing strategies or methodological changes.
There is usually no straight match to be made in types and levels of crime between countries, because legal and criminal justice systems differ in such areas as: definitions of crimes [1], methods of reporting, recording and counting crimes; and rates of reported to unreported crime — see the section titled data sources and availability.
National data have been aggregated to provide estimates for the EU as a whole for the purpose of identifying overall trends. Any inferences for the EU or Member States should be based on trends over time.
Total recorded crime
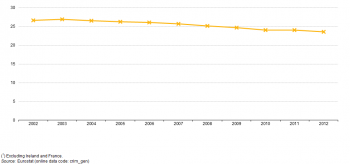
The data for total recorded crime show only offences against the penal or criminal code; less serious crimes (misdemeanours) are excluded. The number of crimes recorded in the EU-28 has been steadily decreasing since 2003 (see Figure 1), with 12 % fewer crimes recorded in the EU-28 in 2012 than nine years earlier. Note that these figures for the total number of recorded crimes cover a wider range of offences than those detailed in the analyses that follow — namely, for the selected offences of violent crime, homicide, robbery, property crime and drugs offences — and that the sum of these selected offences does not add up to the total of all recorded crimes.
There was a general tendency for levels of recorded crime to decrease in recent years: the number of most types of crimes recorded by the police in the EU-28 fell between 2007 and 2012 as can be seen from Figure 2. While crimes linked to drug trafficking, robbery and violent crimes decreased by an amount between 4 % and 10 % during the period 2007 to 2012, the number of motor vehicle thefts fell considerably faster over the same period (-37 %), confirming a longer term trend. By contrast, domestic burglary is a category of crime with a rising trend in the EU-28: compared with 2007, 14 % more cases of domestic burglary were reported in 2012.
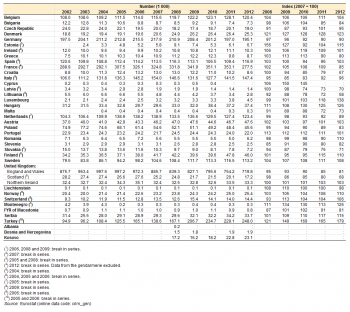
From Table 1 it can be seen that 10 EU Member States saw their number of crimes increase between 2007 and 2012 (time series not available for Ireland or France). By contrast, total recorded crime decreased in the remaining 16 EU Member States, the most noticeable changes being recorded in Greece (-54 %), parts of the United Kingdom (-25 % in England and Wales and -29 % in Scotland), Estonia (-19 %) and Slovakia (-18 %); note that there is a break in series for Greece which may in part explain the particularly large reduction.
England and Wales had the greatest influence on the downward trend in the EU-28 during this period, with the largest decrease of crimes in terms of registered cases, more than 1.2 million less in 2012 than in 2007. Among the non-member countries shown in Table 1, the total number of crimes recorded by the police in Turkey increased by 96 % between 2007 and 2012.
Violent crime
Data for violent crime comprise violence against the person (such as physical assault), robbery (stealing by force or threat of force) and sexual offences (including rape and sexual assault). A detailed analysis of this type of crime is difficult because not all EU Member States use the standard definition. Furthermore, because 2012 violent crime data for France exclude crimes recorded by the gendarmerie (break in series), comparisons with total violent crimes registered for the reference year 2011 would be misleading.
However, the general trend for the EU-28 shows a decline of about 10 % in the number of violent crimes recorded between 2007 and 2012. This overall decline is strongly influenced by the data from England and Wales, where there was a fall of 166 thousand violent crimes recorded between 2007 and 2012 (Table 2). Looking at the other EU Member States, the picture appears heterogeneous, with significant rises between 2007 and 2012 in Luxembourg (38 %), Hungary (26 %) and Denmark (23 %) and large decreases in Lithuania (-42 %), Croatia (-33 %), Scotland (-32 %), Latvia and Slovakia (both -30 %), and Malta (-27 %).
Homicide
Homicide is defined as the intentional killing of a person, including murder, manslaughter, euthanasia and infanticide. It excludes death by dangerous driving, abortion and assisted suicide. Homicides are reported fairly consistently and definitions vary less between countries than for other types of crime. The results presented are for completed homicides, except for Latvia where the data include attempted homicide. In some countries, the police register any death that cannot immediately be attributed to other causes as homicide; this heading may, therefore, be over-reported.
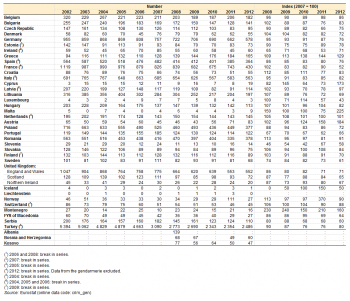
The number of homicides recorded per country is shown in Table 3. The rate of homicides per 100 thousand inhabitants (see Figure 3) reveals a downward trend when comparing the average ratios for 2007–09 with those for 2010–12: a decrease can be noted for all countries except for Greece, Malta and Austria. Despite decreases in the homicide rates for the three Baltic Member States, the number of homicides per 100 thousand inhabitants remained higher in these countries than in all other Member States.
Robbery
Robbery is a particular type of violent crime, defined as stealing by force or by threat of force. It includes mugging (bag-snatching) and theft with violence. Because 2012 robbery data for France exclude crimes recorded by the gendarmerie (break in series), comparisons with total robberies registered for the reference year 2011 would be misleading.
Across the EU-28 as a whole, the number of robberies remained fairly stable, with a drop of 4 % between 2007 and 2012. Despite the significant decrease in the number of robberies reported in the Baltic Member States (averaging -46 % for the period 2007–12) and Scotland (-40 %), a few countries recorded very large increases. From 2007 to 2012, the number of robberies more than doubled in Cyprus, Denmark and Greece (see Table 4).
Property crime
Property crime covers the stealing or destruction of property. Data for domestic burglary and theft of a motor vehicle are presented in Tables 5 and 6 and these show different trends. Because 2012 domestic burglary and motor vehicle theft data for France exclude crimes recorded by the gendarmerie (break in series), comparisons with total domestic burglaries and motor vehicle thefts registered for the reference year 2011 would be misleading.
Domestic burglary is defined as gaining access to a dwelling by force in order to steal goods. Between 2007 and 2012 it increased by 14 % within the EU-28 as a whole (Figure 2). Among the EU Member States with a continuous data series over this period, the highest increases in the number of recorded cases of domestic burglary occurred in Greece (76 %), Spain (74 %), Italy (42 %), Romania (41 %) and Croatia (40 %). Conversely, large decreases were reported by Lithuania (-36 %) and Slovakia (-29 %) over the five-year period covered by the index in Table 5; note that there is a break in series for Spain which may in part explain the particularly large increase.
Theft of a motor vehicle covers thefts of cars, motorcycles, buses and lorries, as well as construction and agricultural vehicles. The number of motor vehicle thefts fell steadily across the EU in recent years, partly as a result of technical improvements in vehicle theft deterrents. The number of offences recorded in the EU-28 under this category of crime decreased by 37 % between 2007 and 2012, with motor vehicle thefts more than halving in England and Wales and also in Scotland (both -53 %). In Greece, the number of motor vehicle thefts increased between 2007 and 2012 by 38 % (Table 6).
Drug offences
Drug trafficking is a sub-set of the broader class of drugs offences. It includes the illegal possession, cultivation, production, supplying, transportation, importing, exporting and financing of drug operations. Because 2012 drug trafficking data for France exclude crimes recorded by the gendarmerie (break in series), comparisons with total drug trafficking registered for the reference year 2011 would be misleading.
Compared with the trends registered for several other types of crime, the number of drug trafficking offences registered a relatively small reduction (-5 %) across the EU-28 between 2007 and 2012 (see Figure 2). A substantial decrease in drug trafficking was recorded in Scotland (-48 %) and Estonia (-40 %) — see Table 7 — while smaller decreases were recorded in some of the largest EU Member States, notably Germany (-26 %); a particularly large fall was recorded in Hungary, mainly attributed to a break in series. However, most Member States (18 Member States, as well as Northern Ireland and England and Wales) registered increases in their overall number of drug trafficking offences between 2007 and 2012, the largest being in Lithuania and Sweden where the number of drug trafficking offences more than doubled between 2007 and 2012. Furthermore, among the non-member countries shown in Table 7 the number of crimes linked to drug trafficking in Turkey more than tripled between 2007 and 2012.
The number of police officers remained stable
Police officers include criminal police, traffic police, border police, gendarmerie, uniformed police, city guard and municipal police, while excluding civilian staff, customs officers, tax police, military police, secret service police, special duty police reserves, cadets and court police. However, it should be noted that variations in this definition exist between the various jurisdictions.
The total number of police officers across the EU-28 was stable in recent years. Excluding Northern Ireland and Bulgaria, the number of police officers in the EU increased by 2.3 % during the period 2007–12 (see Table 8). In 2012, Italy, Spain and Germany had the largest number of police officers among the EU Member States; together they accounted for 45 % of the EU total.
Relative to the size of the population, the largest number of police officers in the period 2010–12 was in Cyprus (631 per 100 thousand inhabitants), while the lowest was in Finland (151 per 100 thousand inhabitants) — see Figure 4. Between 2007–09 and 2010–12 the number of police officers relative to the size of the population grew substantially in Hungary and Estonia (although there were breaks in series during this period for both of these Member States), as well as in Belgium, Spain and Greece. By contrast, over the same period, France and Cyprus recorded the largest falls in their number of police officers compared with the size of their respective populations.
A steadily increasing prison population
Prison population data comprise adult and juvenile convicted prisoners and pre-trial detainees in all types of prison establishments. Non-criminal prisoners held for administrative reasons (such as investigation of immigration status) are excluded.
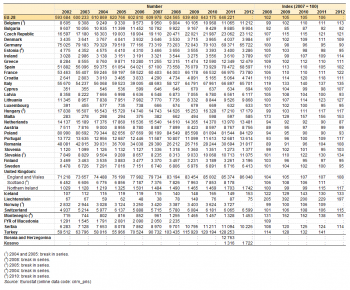
In 2012, there were about 643 000 prisoners in the EU-28 (excluding Scotland) and between 2007 and 2012 the total number of prisoners in the EU-28 (again excluding Scotland) rose by 7 % (see Table 9). During this period, Malta’s prison population increased by just over half (53 %) and those in Italy and Slovakia by just over one third (35 % and 34 % respectively). Among the non-member countries shown in Table 9 large increases (in relative terms) were recorded for Liechtenstein (97 %), Montenegro (51 %) and Turkey (41 % between 2007 and 2011); note that there is a break in series that may in part explain the large increase in Montenegro.
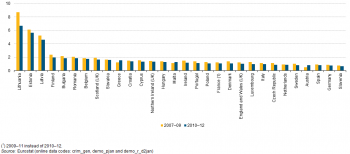
An analysis of the number of prisoners relative to the overall population size is presented in Figure 5 as an average for the periods 2007–09 and 2010–12. For both of these periods the three Baltic Member States recorded the highest rates of prisoners per inhabitant: Latvia’s rate remained stable between the two periods, Lithuania’s rose, while that for Estonia fell. Excluding Scotland, for the period 2010–12 the EU-28 average stood at 128 prisoners per 100 thousand inhabitants, as opposed to 125 for the period 2007–09. The lowest rates in the period 2010–12 were in the Nordic Member States and Slovenia (between 60 and 72 prisoners per 100 thousand inhabitants).
Data sources and availability
Eurostat publishes statistics on crime and criminal justice systems from 1950 onwards for the total number of recorded crimes, and from 1993 onwards for a set of specific offences; the database also includes statistics for prison populations from 1987 onwards and the number of police officers from 1993 onwards.
Data for the United Kingdom are reported for the separate jurisdictions of England and Wales, Scotland, and Northern Ireland.
As a general rule, comparisons of statistics on crime and criminal justice systems should be based upon trends rather than upon levels, on the assumption that the characteristics of the recording system within a specific country remain fairly constant over time. There are, however, a large number of breaks in time series and other methodological/definitional changes.
Comparisons of crime statistics between countries may be affected by a range of factors, including:
- different legal and criminal justice systems;
- the proportion of crimes reported to the police and recorded by them;
- differences in the timing of recording crimes (for example, when reported to the police, when a suspect is identified, and so on);
- differences in the rules by which multiple offences are counted;
- differences in the list of offences that are included in the overall crime data.
Consequently, care should be taken when analysing the information presented.
Data for the prison population may also be affected by a range of factors, including:
- the number of cases dealt with by the courts;
- the proportion of convicted criminals given a custodial sentence;
- the length of the sentences imposed;
- the size of the population on remand;
- the date at which the survey was conducted (especially where amnesties or other early release arrangements might apply).
The prison population should be measured as the total number of adult and juvenile prisoners (including pre-trial detainees) as of 1 September each year. The data include offenders held in prison administration facilities, juvenile offenders’ institutions, drug addicts’ institutions and psychiatric or other hospitals.
Work is in progress to improve the comparability of crime statistics across the EU Member States. The development of a more comparable system of crime and criminal justice statistics is outlined in a European Commission Communication titled ‘Measuring Crime in the EU: Statistics Action Plan 2011–2015’ (COM(2011) 713 final).
Context
The progressive elimination of border controls within the EU has considerably facilitated the free movement of European citizens, but may have also made it easier for criminals to operate, especially since the scope of law enforcement authorities and criminal justice systems is generally limited to the boundaries of national borders.
Since the adoption of the Amsterdam Treaty, the EU has set itself the objective of providing a common area of freedom, security and justice. This goal was further developed by the Hague programme in 2004, which outlined 10 priority areas: strengthening fundamental rights and citizenship; anti-terrorist measures; defining a balanced approach to migration; developing integrated management of the EU’s external borders; setting-up a common asylum procedure; maximising the positive impact of immigration; striking the right balance between privacy and security while sharing information; developing a strategic concept on tackling organised crime; ensuring a genuine European area of justice; and sharing responsibility and solidarity.
Mutual recognition of decisions taken by national judges is set to become the cornerstone of judicial cooperation in criminal matters, with a range of tools having been developed to facilitate practical cooperation across borders.
As part of the work to harmonise and develop statistics on crime and criminal justice systems, EU Member States agreed to approximate the definitions of offences and the level of sanctions for certain type of offences.
See also
- Crime trends in detail
- Government expenditure on public order and safety
- Social protection statistics
Further Eurostat information
Publications
- Trends in crime and criminal justice, 2010 — Statistics in focus 18/2013
- Trafficking in human beings — 2013 edition — Working Paper
- Money Laundering in Europe — 2013 edition — Working Paper
Database
- Crimes recorded by the police (crim_gen)
- Crimes recorded by the police - NUTS 3 regions (crim_gen_reg)
- Crimes recorded by the police: homicide in cities (crim_hom_city)
- Crimes recorded by the police: historical data (total crime) 1950-2000 (crim_hist)
- Police officers (crim_plce)
- Prison population (crim_pris)
- Prison population: historical data 1987-2000 (crim_pris_hist)
Dedicated section
Methodology / Metadata
- Crime and criminal justice (ESMS metadata file — crim_esms)
Source data for tables and figures (MS Excel)
Other information
- Commission Communication COM/2006/437 final: Developing a comprehensive and coherent EU strategy to measure crime and criminal justice: an EU Action Plan 2006–2010
- The Hague Programme: strengthening freedom, security and justice in the European Union (Official Journal C 53 of 3.3.2005, p.11)
- The Stockholm Programme — An open and secure Europe serving and protecting citizens (Official Journal C 115 of 4.5.2010, p.1)
External links
- Council of Europe
- European Institute for Gender Equality
- European Monitoring Centre for Drugs and Drug Addiction
- European Sourcebook of Crime and Criminal Justice Statistics — 4th edition
- European Union Agency for Fundamental Rights
- United Nations Office on Drugs and Crime — Data and analysis
Notes
- ↑ For example, Greece, Cyprus, Luxembourg, Iceland and Liechtenstein do not distinguish ‘domestic burglary’, and count all burglary (in shops, garages etc.). Their data cannot therefore be compared directly with that for other countries which only include burglary in a dwelling.
