Archive:Consumer prices - detailed average prices
Data from September 2016. Most recent data: Further Eurostat information, Main tables and Database. The 2015 data collection is the eighth and final exercise, therefore this article will not be updated
This article presents detailed consumer prices for the European Union (EU). These were collected for the 'Detailed average prices' (DAP)' project, run jointly by Eurostat and national statistical institutes. Detailed price statistics and detailed data on price levels are needed for several purposes, including product market and sector monitoring. As part of the closer monitoring of single market policies, DAP seeks to improve understanding of how markets work.
Eurostat and the national statistical institutes are always keen to explore ways of extending the system of price statistics. The detailed average prices project, lasting from 2009 to 2016, aims to supplement existing consumer price statistics by providing indicative average prices for specific consumer goods and services across Europe.
Main statistical findings
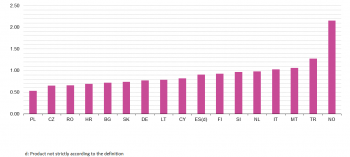
In general, some difference is to be expected in the price of a particular product in different countries. There are many reasons for this, including differences in excise duties and value added tax (VAT), national production conditions (for products in which cross-border trade is not significant) and exchange rates if relevant. Nonetheless, among the 190 products published in 2015 within the detailed average prices project, the price of a number of products was similar across Europe. One example is white sugar (1 kg fine, granulated), the price of which was surveyed in 17 countries (Figure 1). Poland had the lowest average price (0.53 €/kg) and Norway the highest (2.15 €/kg). However, the remaining 15 countries had more similar prices, ranging from 0.65 €/kg (Czech Republic) to 1.28 €/kg (Turkey) and being the maximum/minimum price ratio across EU countries equal to 2.0.
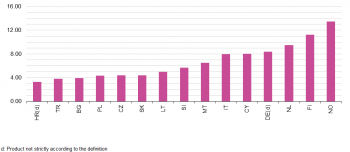
The price of cigarettes (pack of 20, filter) was surveyed in 14 countries (Figure 2). The lowest average price was recorded in Bulgaria, at 2.51 € per pack of cigarettes. 7 other countries had prices below 3.50 €/pack. At the other end of the scale, average prices in Norway were above 11 €/pack. In many countries tobacco prices are heavily influenced by government policy, through excise duties and taxes, or controlled directly by means of a minimum price.
The price of cinema tickets (one ticket, Saturday evening) was surveyed in 15 countries (Figure 3). 8 countries — 7 eastern European Union countries and Turkey — had prices below 6 €/ticket. The average price was the highest in Norway and Finland (13.48 and 11.26 €/ticket respectively) while 4 countries had prices around 8-9 €/ticket.
The price of a cup of coffee was surveyed in 15 countries (Figure 4). 8 countries had prices below 1.15 €/cup (7 Eastern European countries and Italy). Norway had the highest average price, where a serving of a cup of coffee costs 3.08 €/cup on average. 3 other countries had prices above 2€/cup (The Netherlands, Finland and Germany).
Data sources and availability
The first detailed average prices project was carried out in 2008 and other pilot projects have subsequently been carried out each year. For the reference year 2015, the indicative average prices of specific consumer goods and services from 17 countries are published in Eurobase (Figure 5). The 2015 data collection is the eighth and final exercise. The DAP project will be discontinued.
National statistical institutes carry out sampling and data collection, with Eurostat and participating countries jointly deciding the product sample. National statistical institutes choose data sources. Some national statistical institutes use existing data from the HICP, the main purpose of which is to measure price changes. Others have developed separate surveys.
Context
All findings should be interpreted with caution as the prices quoted are indicative of the average prices of products within the scope of the definitions used. They do not represent official national average prices. Average EU or euro-area prices are not published. The following factors may influence price differences and limit the comparability of the results:
- One product cannot represent the entire market in all countries for the consumption sectors concerned. Even when products are identical across countries, they may not have the same relevance for consumers in the various countries. For example, the average price of a loaf of white bread may not be indicative of the price of bread in general in a given country. Even within the limits of the product specification, the positions of the selected products in national markets may also differ across countries.
- The structure of distribution and retail also varies between countries. Differences in the price of ice cream, for example, could be related to differences in market and retail structure (i.e. whether ice cream is produced and sold locally or whether consumers would tend to buy it in supermarkets).
- National samples may only include prices for certain types of brands, and the same brands will not necessarily be chosen in different countries. Even within the limits of the product specification, there may be differences in quality.
- In each Member State, the products have been selected according to the procedures of that Member State’s national statistical institute. Its national statistical institute is responsible for computing the average. Many countries use an unweighted arithmetic average of the price observations. Other countries weight regional or municipal price averages on the basis of population figures or household consumption data.
- Short-term fluctuations in exchange rates may affect prices. The impact of this depends on whether products were imported or produced locally, the tradability of the products in question and other reasons.
- Price levels cannot be compared over time to estimate inflation since differences in prices from one year to another may come from other reasons. For example, products may be different in various periods and still according to the specification in those periods (Samples are regularly updated in order to keep them representative). Additionally, differences across time in the distribution of outlets where prices have been collected may influence the differences in price levels. Finally, comparability over time of price levels in euros will be directly affected by changes in currency exchange rates in countries not members of the euro-area.
See also
- Comparative price levels of consumer goods and services
- HICP methodology
- Purchasing power parities (PPPs) - calculation and uses
Further Eurostat information
Database
- Detailed average prices (prc_dap)
Dedicated section
Methodology / Metadata
- Detailed average prices metadata (ESMS metadata file — prc_dap_esms)
Other information
- Harmonised indices of consumer prices (HICP) (prc_hicp)
External links
- Consumer Markets Scoreboard European Commission - Directorate General Health and Food Safety (DG SANTE)


