Building permit index overview
Data extracted in April 2024.
Planned article update: April 2025.
Highlights

Source: Eurostat (sts_cobp_a)
The indices for building permits are business cycle indicators providing information on the development of granted building permits in the European Union (EU).
Short-term statistics provide two types of indices for building permits. The "dwelling index" simply reflects the evolution in terms of the number of dwellings. A second indicator, the "floor area index" shows the evolution of the useful floor area for which the building permits are issued. Where the useful floor area is not available, an alternative measure of size may be used. The dwelling index for the number of permits covers only one-dwelling residential buildings and residential buildings with two or more dwellings but not residential buildings for communities (e.g. residences for the elderly). The floor area index is more complete than the dwelling index, it covers all types of residential buildings (including residences for communities) and non-residential buildings, for example offices, hotels, shops, warehouses, industrial buildings, schools and hospitals. Unlike other STS indicators, building permits are not only available as indices but also in absolute figures. Moreover, building permits are, as of 2022, also available on a monthly basis. Although monthly data are not provided by all Member States, the coverage is usually sufficient to calculate European aggregates.
Full article
Absolute values and rates of change
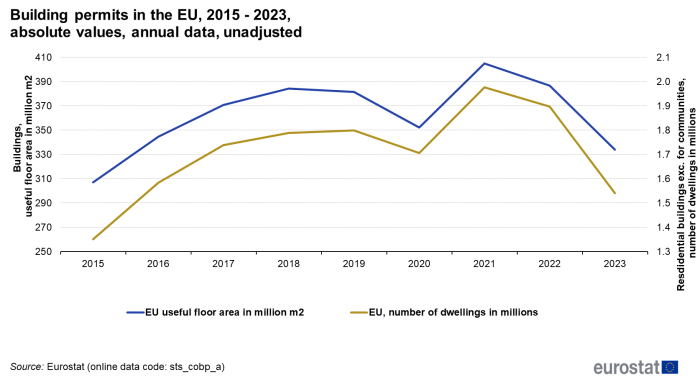
Figure 1 shows the evolution of building permits for the EU since 2015. It shows the useful floor area index for all buildings (left vertical axis) and the dwelling index for residential buildings excluding residences for communities (right vertical axis). The building index levels in 2020 fell by 7.6 % (EU, useful floor area) and 5.0 % (EU, number of dwellings), mainly as a result of the Covid-19 pandemic. From the last quarter of 2020, the building permits index started to recover. In 2021, building permits increased by 15.1 % for the EU useful floor area and by 16.1 % for EU number of dwellings.
In 2022, both indices fell again. The index for the useful floor are by 4.3 %, the dwelling index by 3.7 %. In 2023 the decline in the issued permits accelerated to -14.5 :% for the floor area index and to -19.8 :% for the number of dwellings.

Source: Eurostat (sts_cobp_a)
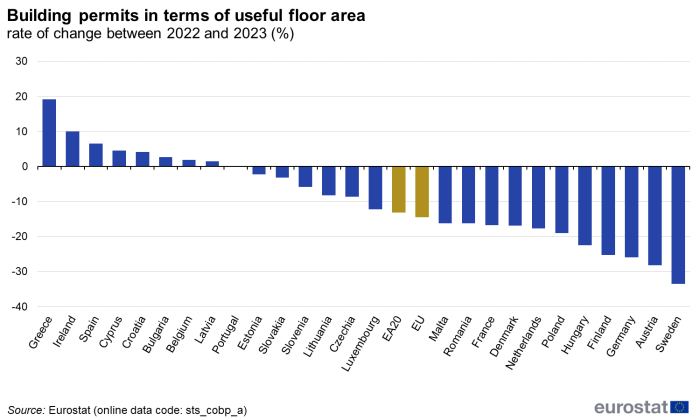
The average EU rate (floor area index) for 2023 of -14.5 % (-13.2 % for the EA-20) hides large differences between the Member States (Figure 2). The issued building permits (for all types of buildings measured in m2 of floor area) rose in eight EU countries. The increases were particularly high in Greece (19.1 %) and Ireland (10.0 %). The building permit index fell in 18 EU countries, in some countries quite sharply, e.g. in Sweden (-33.5 %), in Austria (-28.2 %), in Germany (-25.9 :%), and in Finland (-25.3 :%). (No data for Italy.)

Source: Eurostat (sts_cobp_a)
Indices
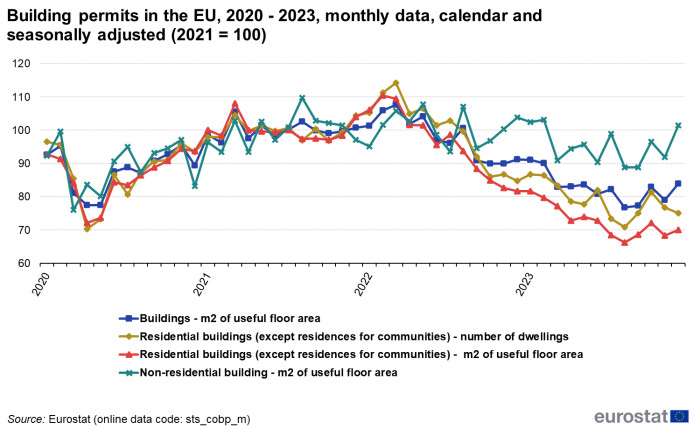
Figure 3 shows the monthly evolution of the EU building permits index since 2020. As can be seen, the indices for buildings and residential buildings have followed a similar pattern, whether measured in terms of number of buildings or useful floor area. However, the index for non-residential buildings shows a somewhat different trend, especially in 2023.

Source: Eurostat (sts_cobp_m)
Source data for tables and graphs
Data sources
Information on building permits is usually collected from the authorities issuing the permits (often municipalities). As the collection of information is exhaustive, issues of sample size, weighting, etc. do not apply. The mandatory reference period under Regulation (EU) No 2019/2152 of 27 November 2019 (European Business Statistics Regulation) is one quarter. Several Member States supply data on a monthly basis. Data are generally available 3 months after the end of the reference period.Context
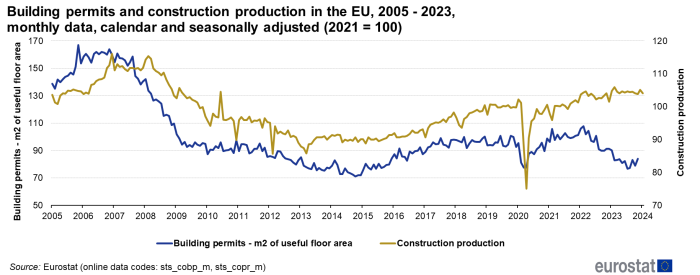
A building permit is issued by the authorities in response to an application and on the basis of a specific building plan. It is the final administrative authorisation to start work on a specific building project and is one of the last steps before the actual construction work begins. The amount of work that does not require a permit is generally quite limited. Therefore, the evolution of the building permits indicator is broadly comparable to that of the actual work (Figure 4). However, the leading indicator quality of permits should be interpreted with some caution, as there is no immediate link between the two. In none of the countries covered by the European Business Statistics Regulation does a permit imply an obligation to start construction. Therefore, some permits may not be used by builders and the building permits index may overestimate future building activity. In addition, the time between the issue of a permit and the start of construction may vary depending on, for example, the type of construction, the economic cycle or the country. Even if there were a regular delay between the granting of a building permit and the start of construction, the statistical relationship between the evolution of building permits and the evolution of construction output could still vary depending on how fast or slow construction progresses. In cases where a building permit is withdrawn, the indicator is not adjusted for this effect. There may also be some double counting if the same construction project is later restarted with a new permit after the first permit has expired.

Source: Eurostat (sts_cobp_m) and (sts_copr_m)
The financial crisis of 2007–2010, which was triggered by the downturn of the US housing market and which resulted in substantial losses of construction output, highlighted the need for more information on the housing market. The building permit indices were therefore integrated into the list of 'Principal European economic indicators' or 'PEEI' (together with residential property prices and house sales).
Direct access to
- Construction, building and civil engineering (NACE F) (t_sts_cons)
- Building permits (teiis540)
- Construction, building and civil engineering (NACE F) (sts_cons)
- Building permits – index (sts_cons_per)
- Short-term business statistics - Metadata in SDMX format (ESMS metadata file — sts_esms)